cyclogenesis
-
Posts
53 -
Joined
-
Last visited
Content Type
Profiles
Blogs
Forums
American Weather
Media Demo
Store
Gallery
Everything posted by cyclogenesis
-
Any of you weather hobbyists have recommendations for THE BEST CAMERA for taking HIGHEST RESOLUTION VIDEO & photography? The camera NEEDS to EXCEL in LOW-LIGHTING and ZOOMING capabilities, WITHOUT graininess, blurring & coarseness. As I poured through a number of cameras, the market release dates were all in the late 2017's era. It seems they're letting PHONE cameras take over the market. Any insights on this subject, for the BEST camera in highest resolution, zooming, and low-lighting??
-
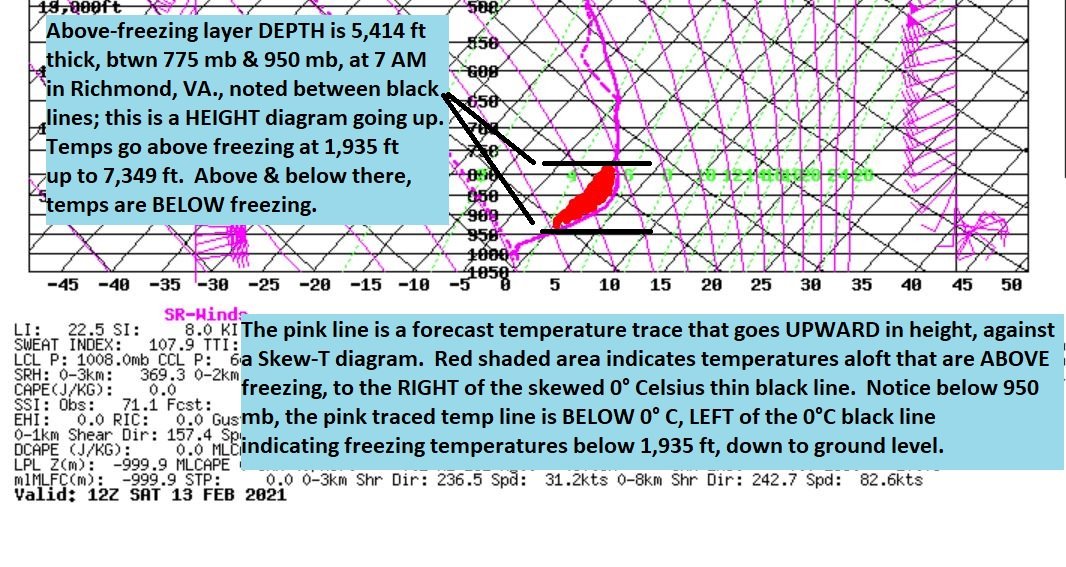
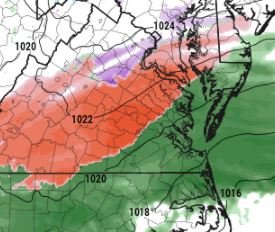
February 12, 2021 this Friday night 856 PM EST So, now that everyone know WHAT to expect and WHEN to expect it, I thought I’d open with the topic of UNDERSTANDING the MECHANICS of what’s going on here. First, we take a LOOK at the mechanics in play: How does the TEMPERATURE profile change WITH HEIGHT? That tells the KEY as to what precipitation type you’re going to get. That is what this attached visual graphic I’m producing here details. The pink-traced line is a forecast temperature that goes UPWARD in HEIGHT, centered at 7 AM on Saturday morning, over Richmond, Virginia, just after the start of the freezing rain event. The background of thin, black lines is the skewed temperature scale that angles right-ward with height. If the pink-traced line STAYS LEFT of the 0°C thin, black line, this means the temperature stays freezing all the way upward in height, if the pink traced line LIES to the LEFT of the 0°C thin black line. In such a case, precipitation would fall as snow. If the pink-traced line STAYS RIGHT of the 0°C thin, black line all the way up, staying RIGHT of it, then it all falls as rain. But what happens if the pink-traced, (forecast temperature line), crosses over between above-freezing and below freezing?? Then, it can either be FREEZING RAIN, (in this case for tomorrow), or in other times as sleet or even snow some other times. The DEPTH of the above-freezing layer aloft and the MAGNITUDE, of HOW WARM dictate as to whether it converts to freezing rain, sleet, or snow. For tomorrow’s case in Richmond, VA on Feb. 13th, I’ve calculated the ABOVE-FREEZING LAYER DEPTH to be 1,650 meters, which is about 5,414 feet in DEPTH, ALOFT, of above-freezing temperatures. (Refer to my visual attachment of the Skew-T). From ground level, up to 1,935 ft, temperatures are forecast to STAY either BELOW FREEZING or right at Freezing, 32°F. Then between 1,935 ft altitude on upward to ~ 7,349 ft, the temperature goes ABOVE freezing, with the WARMEST peaking at 4°C to 4.5°C between the 900 mb to 850 mb layer about 12 Noon, midday. This layer depth of above-freezing temperatures neither grows nor shrinks in depth throughout the day Saturday, except that the magnitude gets just a little warmer at the 900 to 850 mb layer. So what happens?? Take it from the top! Falls first as snow, ABOVE 7,500 ft, then begins melting to liquid cold rain in that 775 mb to 950 mb layer of ABOVE-FREEZING temperatures, between 7,349 ft to 1,935 ft. (Refer to my visual attachment of the Skew-T). Then in that last 1,900 ft down to the surface it HITS on contact as freezing rain, SO LONG AS THE SURFACE temperature stays either BELOW or AT 32°. (But why doesn’t it freeze back to snow or sleet between 1,900 ft and the surface??) Great question! The problem here is that the warm layer depth is so deep whose magnitude gets as warm as 4°C, that there isn’t time for the rain drops to freeze back to snow. If the boundary layer temperature was WAY BELOW freezing in the lowest 2,000 ft, as in like mid 20’s or lower, then MAYBE you could get some sleet out of it. There is a pronounced layer right at 975 mb that gets briefly near there, so it’s possible to get a few ice pellets, but predominantly will be freezing rain. (What determines freezing rain in this case??) So, the depth measurement of the above-freezing layer is about 1,650 meters, and the AVERAGE temperature within that above-freezing layer is running about 1.7°C, almost 2°C. (Refer to my visual attachment of the Skew-T). It does briefly peak to as warm as 4.0 to 4.5°C around midday and afternoon Saturday. With that depth & mean virtual temperature on the Tau Technique, at 1,650 meters & 1.7°C, this equates to a translation of FREEZING RAIN as the dominant type of precipitation, AS LONG AS YOUR SURFACE temperature is at least 32° or below. As soon as the temperature flips to 33° and above, then the jig is up! All the modeling data that I reviewed from Friday points to this being mostly an icing, freezing rain event; however you may occasionally observe some liquid rain mixed in, especially in the afternoon, and some ice pellets, or sleet during the morning. Mostly, should be rain freezing on contact, and may take time to see the ice accretion build by late morning. That RED-SHADED AREA is that layer DEPTH that is ABOVE-FREEZING, located between an altitude of 1,935 ft and 7,349 ft above ground level. -- cyclogenesis

-
RIC Airport -- I moved out of Virginia in June 2020. I moved down South, to the Gulf coast, so it'll be a rare occurrence that I write again, on any future events, for Richmond, beyond this one.
-
wasnow215 --- Yes, you are correct; it WILL take a while on Sunday to get back to normal. In fact, to the casual onlooker, it may "appear" as though it's simply raining, but after a while, there will be ICE ACCRETION that collects. The MOST DAMAGING effects will be to anyone out on the road. People can NOT take a chance with this one. Just stay at home, and don't risk mangling your vehicle off the roadway or ramming in to someone else. Although there could be some POWER OUTAGES in spots across the metro Richmond area, and especially outer-lying rural areas, the PRIMARY DANGERS are outside on the road way. Avoid driving altogether, and call-off from work. It's what I had to do in Dallas back in the 1990s, during an ice storm there. As another appended note: BE ESPECIALLY CAREFUL walking outside. A BAD SLIP & FALL DOWN, especially to the elderly, could send a person in the HOSPITAL, from SLICK, ICY sidewalks or stairways, either up or down from an apartment or home. Take this time NOW to SAND or SALT your outside walkways & sidewalks from your HOME, if you even need to walk outside. So, ya, I'd say wait until LATE Sunday afternoon, when temperatures get WELL-ABOVE freezing to go out again. Any LAST MINUTE preparations to get food, or run errands needs to be RUSHED to COMPLETION BEFORE 12 AM Midnight tonight, on Friday night. -- cyclogenesis
-
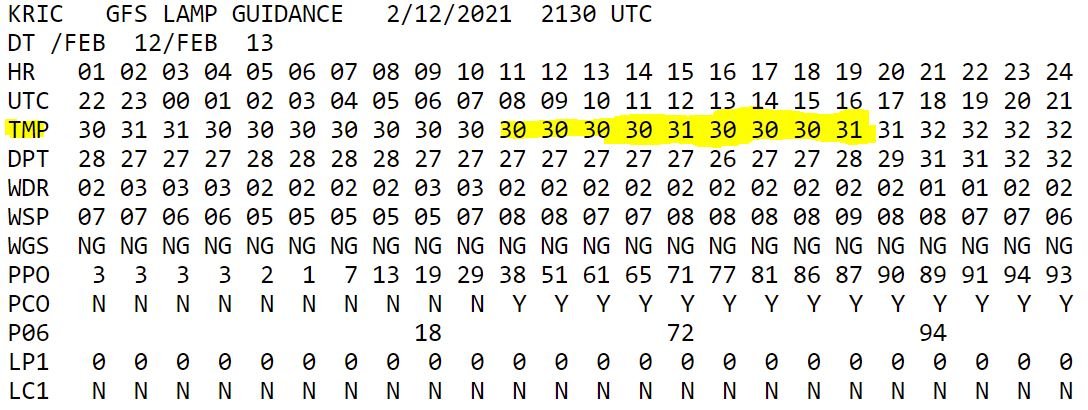
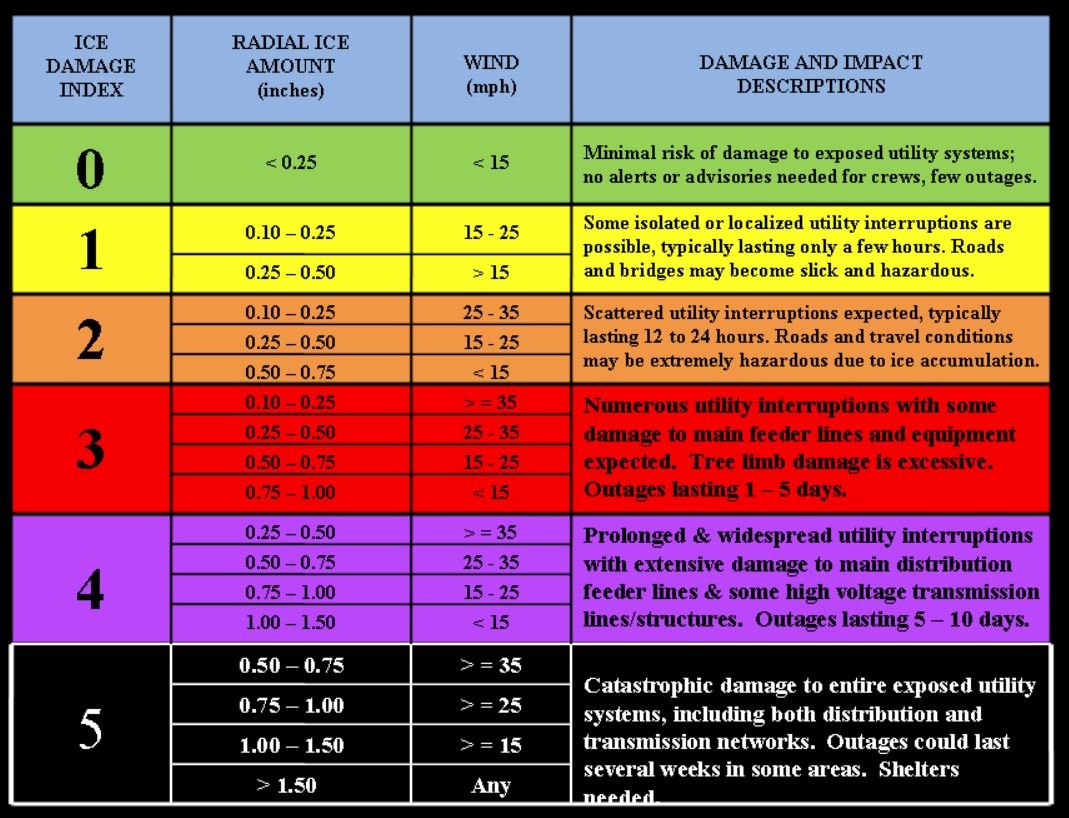
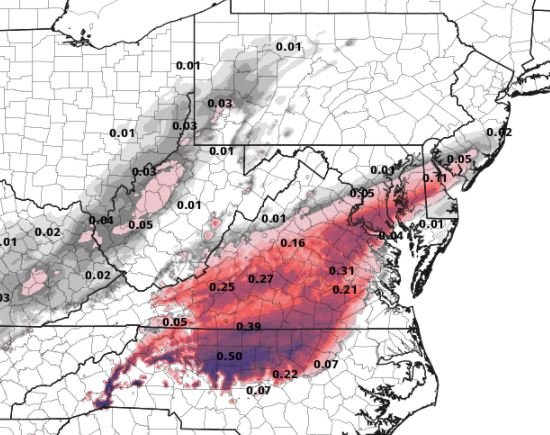
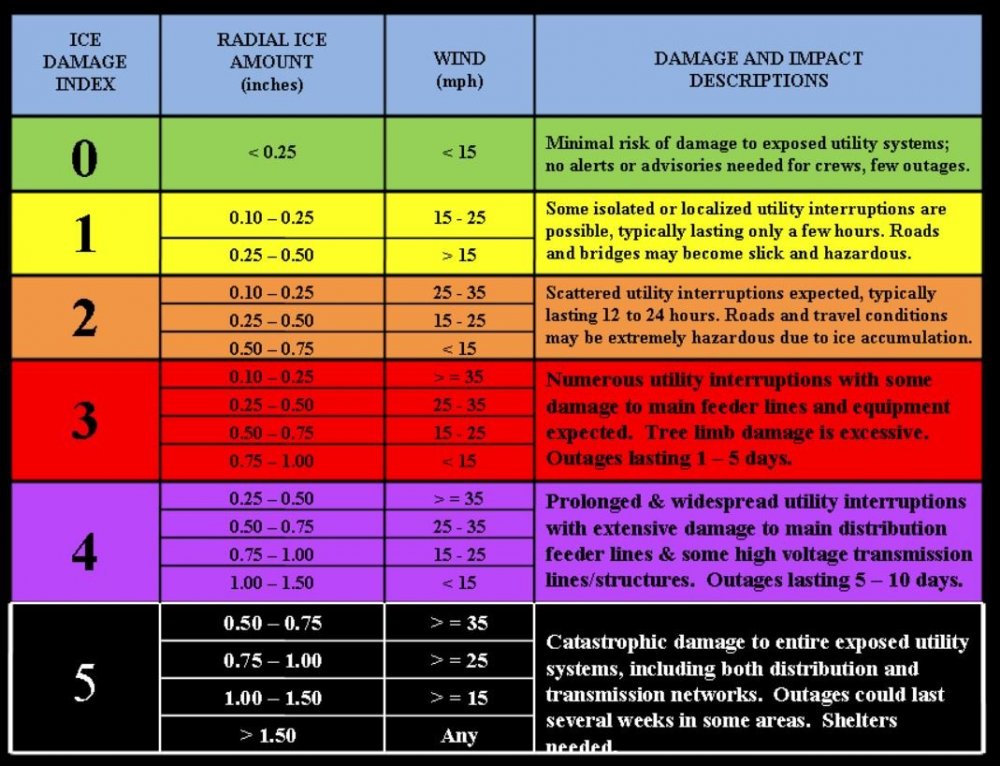
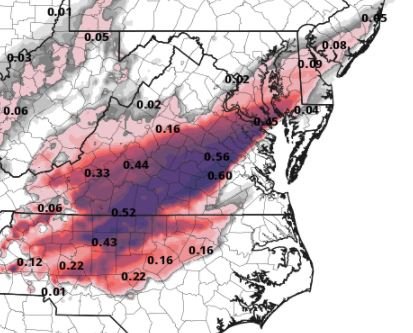
February 12, 2021 this Friday afternoon 510 PM EST Quite an interesting event coming up!! Here's what the latest forecast models from Friday show: Both of the higher definition forecast models indicate this SHOULD remain mostly a FREEZING RAIN event, in their hour-by-hour indications. This morning's NAM MOS vs. GFS MOS had a discrepancy in their Saturday afternoon temperatures, whereby Nam kept FREEZING TEMPS at 32°, and GFS MOS went ABOVE freezing to 33° at 1 PM onward in Richmond. HOWEVER.... newest GFS LAMP guidance from 21Z this afternoon is REVISING these hour-by-hour Saturday AFTERNOON temperatures DOWNWARD, indicating a temperature between 30° - 32° from 7 AM to 4 PM Saturday, through the afternoon. Looking at the forecast precipitation TYPE.... All models I reviewed are unanimous at pointing towards freezing rain, and ICING for the Richmond area. I do think there will be some periods of SLEET or ice pellets mixed in, and in any outlying areas, where temperatures hover at 33°, then that will yield a cold rain, at a surface temp of 33°, and above. The amounts rendered are the following: FREEZING RAIN / ICE amounts for Richmond -- HRRR -- 18Z Fri fcst iteration -->> 0.31" of ice, (freezing rain). TIMING 3 AM Saturday -- 7 PM Saturday night GFS -- 12Z Fri. fcst -->> 0.46" of ice; freezing rain ; Timing 3 AM Saturday thru 10 PM Saturday night GFS -- 18Z Fri. fcst -->> 0.26" of ice; freezing rain WRF -- 12Z Fri. fcst -->> 0.56" of ice; freezing rain ; TIMING 4 AM Saturday -- 9 PM Saturday night. NAM -- 12z Fri. fcst -->> 0.37" of ice; freezing rain; TIMING 1 AM Saturday -- 7 AM Sunday. (That's stretching it!) NAM -- 18z Fri. fcst -->> 0.44" of ice, freezing rain This yields an AVERAGE consensus of: 0.4" (4/10"). That is significant icing which will topple trees & tree branches, and cause power lines to sag. It is also enough significant ICING to completely CRIPPLE & DISABLE the entire road infrastructure, both secondary roads and primary roads. I can't emphasize enough to STAY OFF the MOTORWAYS, and avoid driving, starting late tonight, through all of Saturday, Saturday night & Sunday morning. The fortunate GOOD news out of this is that WIND SPEED forecasts are expected to REMAIN BELOW 15 mph. On the ice damage index, very damaging ice storms occur when WIND SPEEDS GET OVER 15 mph, and winds are forecast to stay below that. Not to let your guard down, though, because lessons learned from the Dallas interstate 75 -100 car pile-up occurred in only light icing. When I checked back at all the observations at the 3 airports in Dallas - Ft. Worth, Dallas Love Field's ICE ACCRETION sensor ONLY RECORDED just 0.08" of ice accumulation ; LESS than 1/10", but still tragedy of lost control of vehicles occurred so early in the morning on a bridge pitched at a slight decline was enough to send chaos through the air. Also, yesterday, storm reports in Central Texas near Austin, during their ice storm showed surrounding communities of 40,000 left with NO POWER, when icing of 1/4" to 1/2" was encountered yesterday there. So now, just think about the STEEP & ARCHED curvature to the infrastructure INSIDE the Richmond city limits on Interstates 64 and 95. Everyone should AVOID travelling on the roads, period. Just think of that infamous "stay-at-home" order you'd seen issued a little less than a year ago, and let this ICING event from yesterday in Dallas, be a reminder for tomorrow, in Richmond & surround areas, to STAY OFF THE ROADS altogether, from EARLY Saturday morning, all day Saturday, Saturday night & Sunday morning. Bridges, hills & curves on the roads are especially dangerous, and Richmond's got plenty of them. Just stay at home and don't drive, from Saturday morning through Sunday morning. How to inspect the icing?? Go look at THIN tree branches, and feel for the icing. It should be SLICK. The tree branches will SQUEAK in the wind or as you pull on them. Also, chain link fences & antennas on vehicles are other good places to inspect icing. Many vehicles on their undersides, and on SIDE MIRRORS will often show hanging icicles, if out in exposed weather, away from garages and overhangs. Here are the corresponding attachments that supplement this writing, supporting the ICING AMOUNT TOTALS.... -- cyclogenesis

-
That's a pretty tight, steep gradient in snowfall totals spanning from West End, Richmond, to East end, Richmond where I'm at, to the South side in Chester. This wasn't a one-size fits all forecast, for the Greater Richmond Metropolitan Area, but I'm glad to see that much of the populous in Richmond did get to see some snow, and at least a dusting, and more than a dusting ( ~ 1/2"), where I'm at, in East Richmond, and one poster had mentioned about 3" in Chester on the South side. It lasted about 3 hours in East Richmond, between 5 PM and 8 PM. It appears North & Northwest Richmond got the short end of the stick on this go-around, with the paucity of reports up thataways, and by viewing STP PCPN estimates on radar. -- cyclogenesis
-
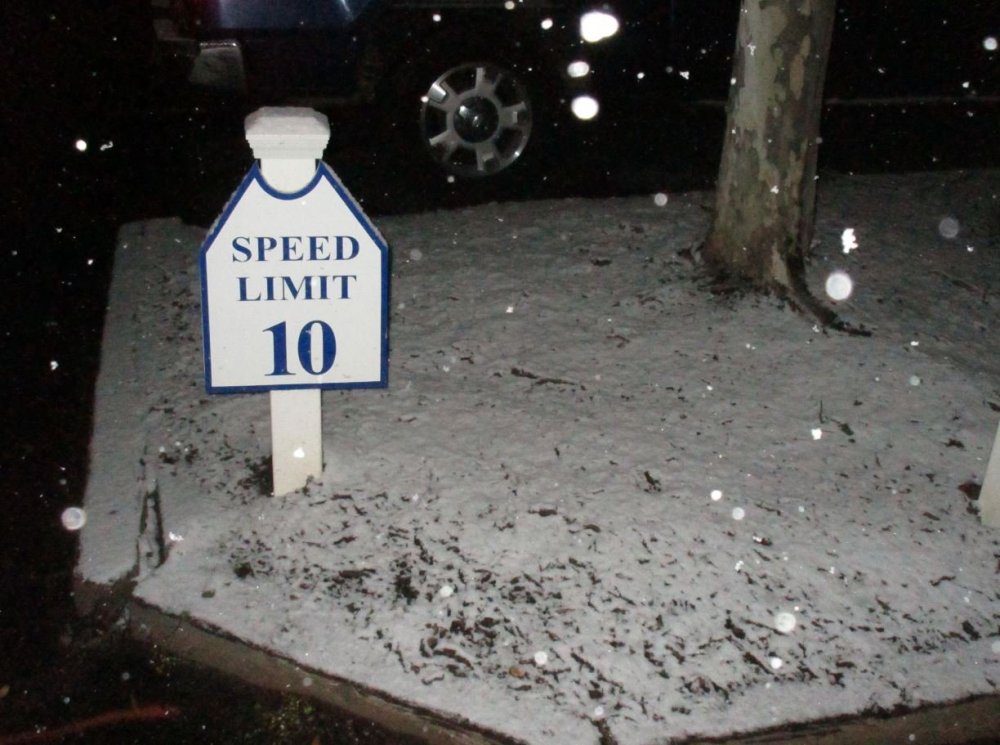
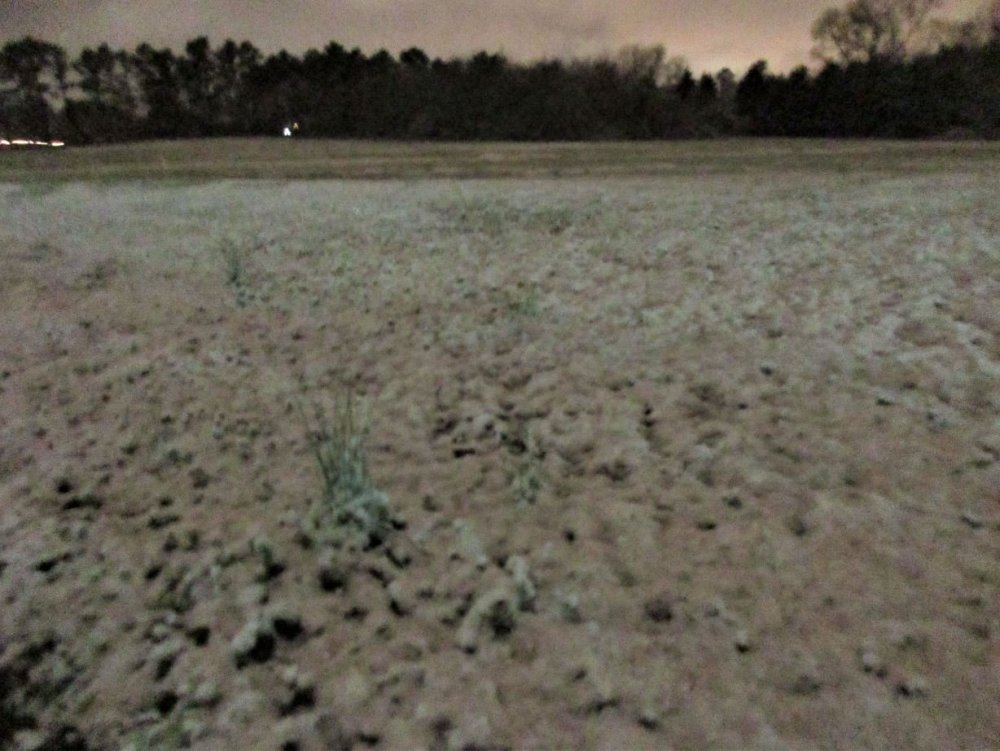
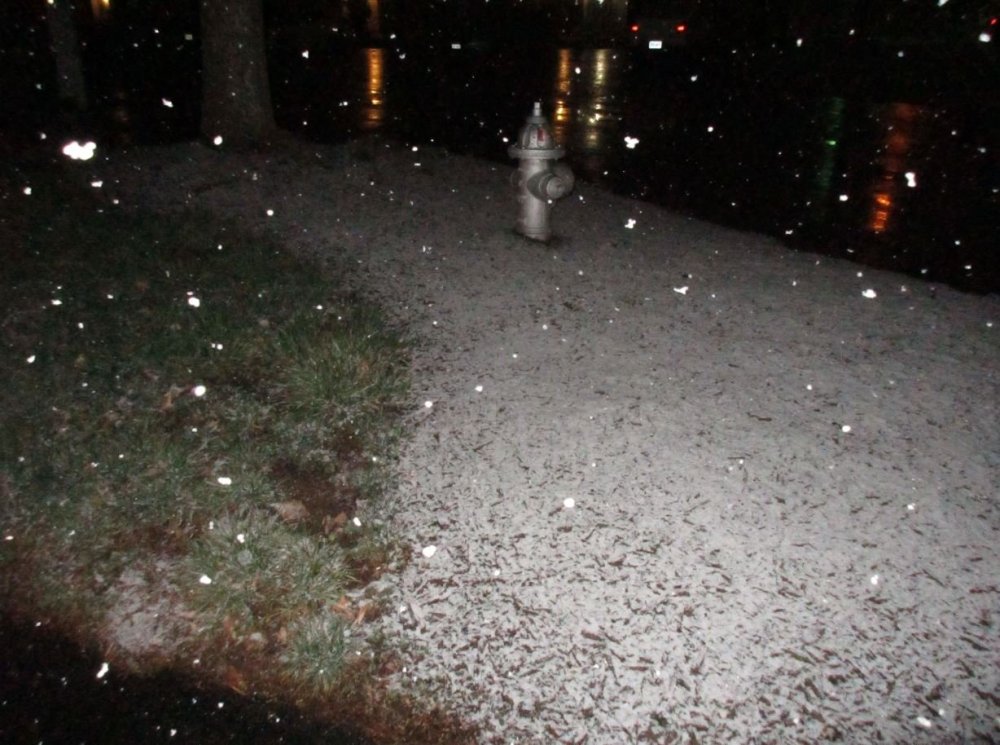
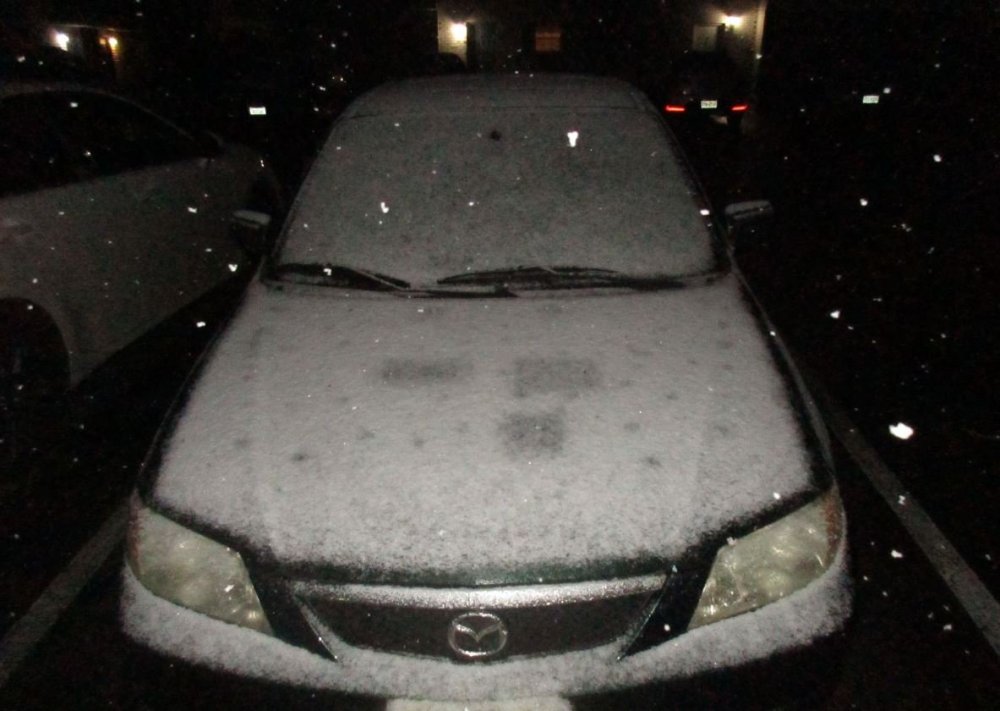
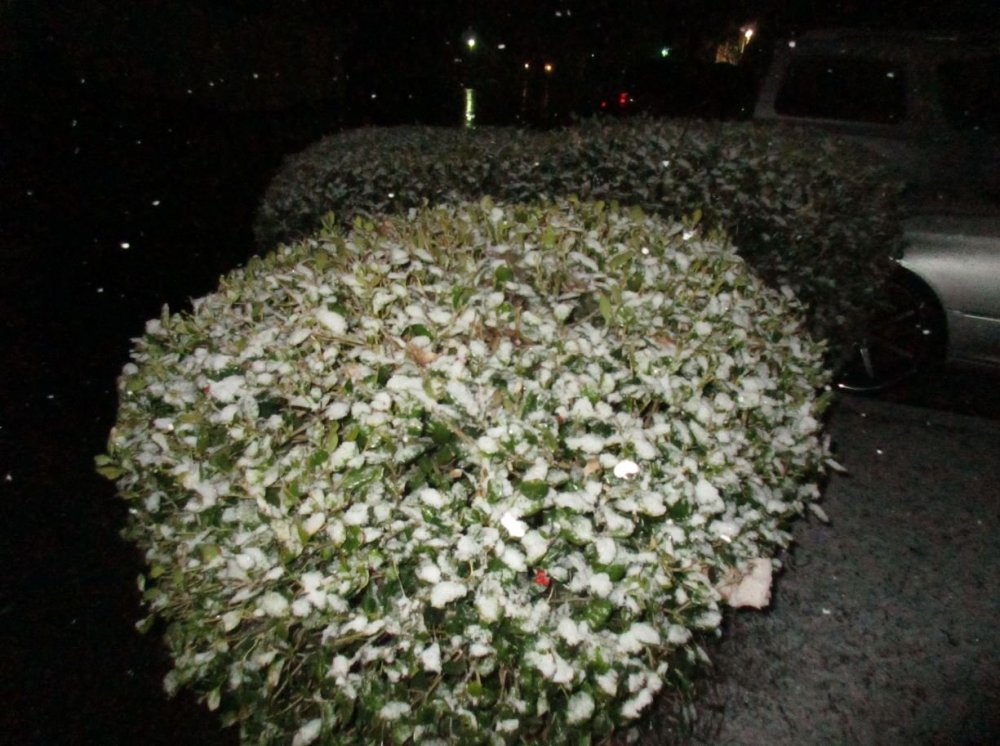
February 20, 2020 In the end, my final snowfall total in East Richmond, taken at 815 PM came out to be 0.6" of snow. East Richmond measured snowfall -->> 0.6" (6/10") final snowfall, (a little over 1/2"). -- cyclogenesis
-
My pictures I took between 7 PM and 815 PM, of the snow fall event here in East Richmond, VA. In East Richmond, VA:
-
February 20, 2020 709 PM EDT this Thursday evening My SNOWFALL measurement in East Henrico County, about 2 miles NW of the Richmond airport is: 0.4" at 7 PM. -- (4/10"). It is still snowing.
-
Done!
-
Here's my pictures I took at 618 PM this Thursday evening, 2/20/2020 In East Henrico County: At 618 PM ~~
-
For those who like to keep up with temperature change, have a look-see at how QUICKLY the temperature DROPPED at the Richmond airport from 38° ►before◄ the snow began down to 32°, ►after◄ it began. RAPID cooling once it started precipitating, a 6° temperature drop in 1 hour's time.
-
As it turns out between 4 PM and 7 PM *WAS* the magic time!!
-
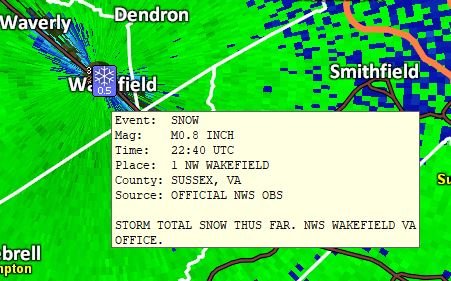
At 540 PM, just 22 minutes ago, your NWS Wakefield office measured 0.8" of snowfall, which is 47 miles Southeast of downtown Richmond. Wakefield will be adding to this total throughout the night, down Southeast of Richmond. Here in East Henrico County, near the Richmond airport, I'm already seeing a thin covering of snow, covering the roof of my vehicle -- 604 PM, Thurs, Feb. 20. -- cyclogenesis
-
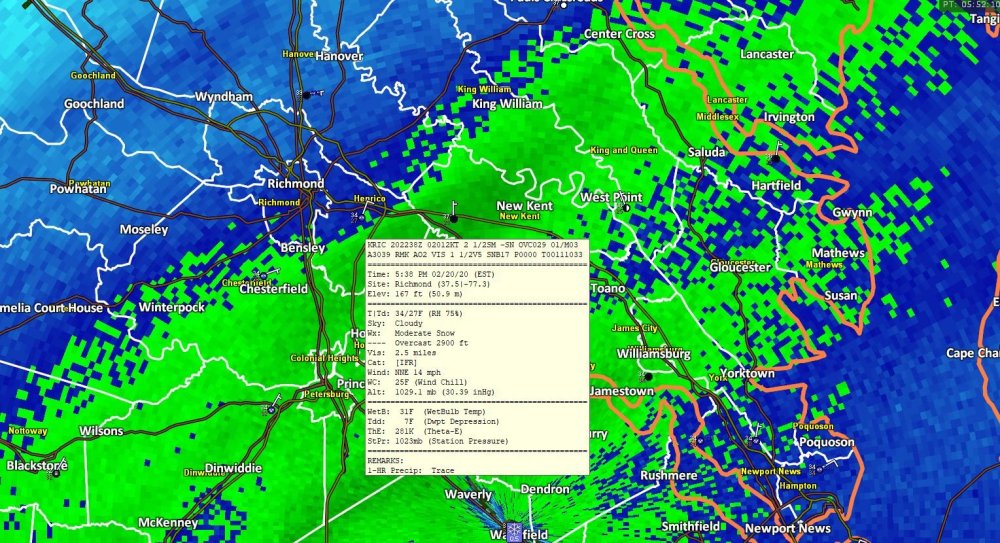
Here's radar at 552 PM this Thursday evening, February 20, 2020. It's happening! Right on the EDGE, it's happening. Your KRIC airport showing light snow, -SN, with a reduced visibility of 2 1/2 miles. It has to get to be 1/2 mile in order to be coined the term moderate snow, and 1/4 mile to be coined the term heavy snow. The rate of snow is based on visibility, in aviation weather standards. I've seen a goodly bit of LIGHT SNOW tonight between the hours of 5 PM and 6 PM tonight in East Henrico County. Have a see of the radar image I'm posting below --- RIGHT on the edge, gang!
-
I'm seeing snow flurries here in East Henrico Co. at 512 PM.
-
Are you able to post a pic. before it gets too dark?
-
Surface temperature in Petersburg down to 34° and 36° at Chesterfield. Wherever it precipitates longest, the most, and hardest, is where the temperatures will make the fall downward, quicker, than in other areas where it is not precipitating at, even if it is rain, initially.
-
A look at the Chesterfield ASOS report, from 4 PM, it appears there may have been a short period of sleet, back around 345 PM, as it reported UP beginning at 345 PM and ending at 351PM. Asos will report light snow & light rain, but cannot discern when there is sleet. It didn't last long. It's probably due to the transitioning process of super-cooled sub-freezing droplets, as the drier layers moisten, cooling the boundary layer above the surface, and the freezing level lowers significantly during the next 3 hours ahead, while dewpoints in the boundary layer rise. -- cyclogenesis
-
Eaglesin2011 ~ Is this in Richmond?
-
When looking for snow flurries, at the start: During daytime, look against a dark-colored object or structure, to identify. Wearing a black-colored jacket might help, extending your arms, but if your jacket is room temperature; the flurries will melt upon contact. Will take bigger flakes to hit jacket to see. At nighttime, place your hand between your eyes and a focused street lamp light above, blocking out the direct focused light of the street lamp, and instead, look directly around the *periphery* of the side-lobe glow of the street light, just directly beneath it, and you'll see the flurries following with the light air currents.
-
2 NWS office locations currently have snow: AT 344 PM, Wakefield, VA Moderate Snow, at 1/2 mile visibility. And Blacksburg, VA, at 335 PM reporting light snow, at 1 mile visibility. I believe we'll continue to see more 20 dbz returns on radar from here on out, as the lower layers moisten and the above-freezing lower layers, (above ground level), begin to approach freezing. What was earlier virga will begin to start showing up as light snow, & moderate snow at more of the TAF sites & Asos sites, in Southern Virginia, over the period of the next 3 hours from now through 7 PM & beyond. Radar returns at 412 PM are showing higher reflectivity rates, (higher dbz), out West from Buckingham County, South to Charlotte county, heading on the inbound. This is encouraging. -- cyclogenesis
-
Feb. 20, 2020 320 PM Newest output on snowfall for Richmond: 12Z Gfs: 0.3" (3/10", with 1/10" coming between 1 AM and 4 AM) 06Z Gfs: 0.5" 12Z Nam: 0 (Recall this one had been previously forecasting between 4 inches to 5 inches) 18Z Nam: 0.4" 00Z ECMWF: 1.00" ( 1 inch) 12Z WRF: Trace (LESS than 1/10") 12Z H-Rap: 0 Just taking the last 1-2 iterations of these models, as I can't use the 16Z to 18Z H-rap as its already tainted showing snow in Richmond by early afternoon, then this averages out to be 0.3" (3/10") of snowfall for Richmond. This meshes between a compromise blend of the 2 writings I released yesterday. 1st writing for 1/10" to 2/10"; followed by a 2nd writing of between 1/2" to 1". So smoothing these 2 variations blends well, for 3/10". Notice above, that it's NOW ECMWF & CMC-RGem which is the HIGHEST-producing, lonely outliers showing the MOST snowfall for Richmond. Recall yesterday it was the NAM going way upward to 4" to 5". That all came to a screeching halt on this morning's 12Z output. It is interesting to take notice that the last 2 iterations of the ECMWF have shown 1" to 1.2" of snowfall, but it, along with CMC-Rgem are ALONE in producing amounts of 1" or over, with CMC-RGEM, at 1.6".
-
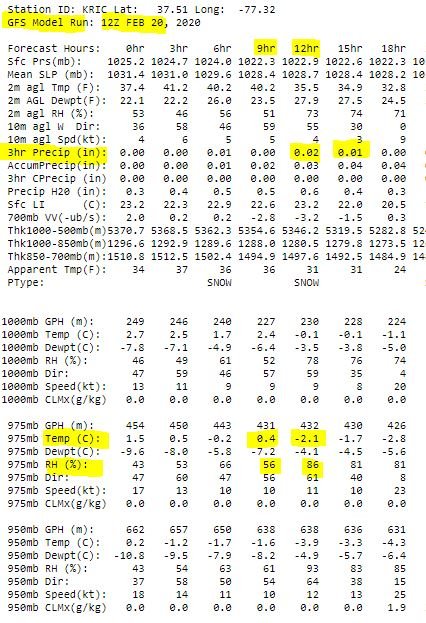
A look at ground observations to the South of Richmond tells me that Nam's thermal structure profile on Skew-T forecast soundings was overly optimistic about a shallower layer of above freezing temperatures, than has actually transpired, up to this time of 2 PM. Recall yesterday it showed an 814 ft depth about this time. However, Gfs back then, showed a much greater depth, up at 1,450 ft, which I took note of late last night, and Gfs appears to be the winner on that greater depth of above freezing temperatures. Depth needs to get *below* 1,200 ft. With this gridded data, using GFS this time, it shows the magic change-over to occur between 4 PM to 7 PM. Temperatures go from 0.4°C at that 1,450 ft layer, down to -2.1°, and the freezing level HEIGHT lowers quickly between 4 PM and 7 PM, at the same time moisture RAMPS UP from the 50%-tile UPWARDS to the 80%-tile. Not quite the saturation ideally needed, but it comes close at 80%-tile in those trouble-some, pesky lower layers that are currently ABOVE freezing and that are the DRY layers. So, based on this Skew-T sounding information, and the gridded data extracted that I highlight in yellow, should show things changing pretty quickly in those hours from 4 PM to 7 PM. By the way, the 975 mb layer that I highlight is shown as 431 M in GPH, translates to 1,450 ft (431 X 3.281) to get height in feet, for that layer. Visual included below. *** Edited to add: Also take notice in this visual below, that the RH, relative humidity, in the surrounding layers above & below the highlighted 975 mb layer go UPWARD as well in R.H. from the 52% to 61% at 1000 mb & 950 mb layers, -- at 4 PM --, going up to the 78% to 90% R.H. moisture, -- at 7 PM --, all while temperatures at those layers go to freezing, at 7 PM. The 12 hr. highlighted at the top, correlates to 7 PM, which is 12 hours away from the initialization time at 7 AM this morning. Have a see below.
-
Feb. 20, 2020 1100 AM A lot of what you're seeing on radar at this moment, at 11 AM, is Virga, for which the radar beam is hitting between altitudes of 6K to 10K ft, from Prince Edward County & Westward. But this Virga is needed in order to commence the process of saturating the tropospheric column from the TOP, downward through the lower layers. An inspection of GFS' 12Z Skew-T forecast sounding for 11 AM and 1 PM today shows a very DRY layer, below 10,000 ft at 11 AM, and below 9,000 ft at 1 PM. As the course of the late afternoon progresses, this dry layer DEPTH of 9,000 to 10,000 ft and below, will diminish GREATLY in depth, and by 4 PM this afternoon, over Richmond, that layer between 10,000 ft & 3,500 ft becomes nearly saturated, so that all that is left of the dry layer is below 3,500 ft, by 4 PM. Both models agree on this assessment. As I say, this Virga is needed to bring DOWN those temperatures by evaporative cooling, closer to the dewpoints, at those drier levels, while at the same time, the dewpoints surge way UPWARD, in order to help saturate the column of air aloft. For without this saturating of the column, there would be no snow event. I expect that by 7 PM this evening, the last remaining dry layer will only exist from the 950 mb level, (2,100 ft), and below. The thinking is that this last little bit of shrinking dry layer depth, confined to the lowest 2,000 ft, to the ground, should be a thin enough dry layer depth for at least a little bit of snow to survive in falling to the ground, before evaporating as virga, for which is happening at current moment in the 9,000 ft. dry layer depth at 11 AM. So, bottom line is there's a dry layer between ground and 8,000 ft here at 11 AM, (an 8,000 ft dry-layer depth at 11 AM over Richmond). Then, by 7 PM the dry-layer depth only becomes 2,100 ft thick, from ground to 2,100 ft. What's encouraging to me, is that look at RIC's cloud height layer at 11 AM. It shows OVC080. So, this BEATS models expectations that the dry layer which was advertised to be 10,000 ft in depth at 11 AM, is now already only 8,000 ft in depth, because of the observation at 11 AM, showing overcast deck of clouds at 8,000 ft on the 11 AM observation. The shrinking of that dry depth layer is AHEAD of schedule by being 2,000 ft LESS in depth, 8,000 ft, vs. the 10,000 ft depth that was advertised for 11 AM, by both models. It will be interesting to see at WHAT DEPTH the dry layer needs to shrink & diminish to, in order for snowflakes to survive making it all the way down to the ground level, without evaporating. -- cyclogenesis