raindancewx
-
Posts
3,757 -
Joined
-
Last visited
Content Type
Profiles
Blogs
Forums
American Weather
Media Demo
Store
Gallery
Everything posted by raindancewx
-
A lot of the years I like for the Southwest had strong systems coming through in January & February - and it's been ages since the mountains of northern New Mexico had their snowiest month in March, which is when it should happen based on history, so expecting something to break through in the next three months in a big way. The week from Jan 28 - Feb 3 has a boatload of snowy systems in the analogs for my area for what it's worth. Also, MJO, or just some other natural cycling seems to be sending major wetness to the SW every 45-days or so - Aug-->>late Sept--->Nov-->late Dec-->Feb. So if there is blocking in January, with the MJO cooperating, we may be in for some fun times. November was incredibly wet here, just wasn't cold - if we get the November pattern here with cold anomalies between now & March we get buried in snow.
-
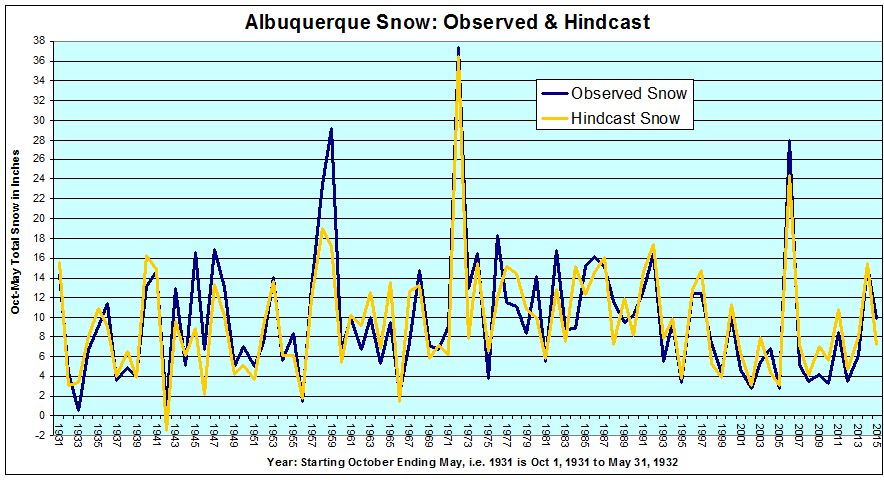
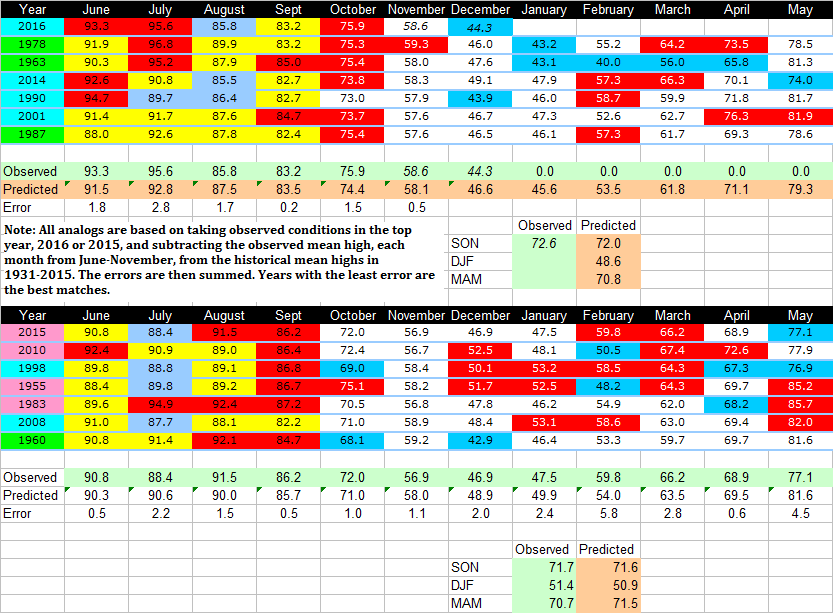
I was playing around with projecting seasonal snow totals for Albuquerque the other day, and I came up with six variables that account for ~78% (r squared = 0.78) of the variation in snow in a given Oct-May season here. They are hard to figure out, but have been asking people on Twitter, and they've done a decent job so far - quite close on first snow date. Essentially: a) ONI in DJF (I used ONI estimates from 1931-32 to 1949-50 also) Precipitation in DJF c) Mean High in DJF d) Precipitation in August + Precipitation in October (as one variable - combined) e) First measurable snow as a date (Oct 1 = 1, Oct 2 = 2, etc, measurable means >=0.1" snow in 24 hrs ending midnight) f) Snowy Day Frequency (how many days had >=0.1" snow from Oct-May, day is 24 hrs ending midnight) ONI has some effect on most of the other variables, particularly b, d, and f. Weak effect on c too. F is the strongest correlation to snow overall, but adding the other variables helps a lot, because you can have 10 days with each day averaging an inch...or two inches...or half an inch. Variable B/D have some control over frequency. Generally: A --> Strong relationship to total snow, and if the top month in the season is very snowy, i.e. El Ninos usually have one big snow month here, which leads to a big seasonal total. B --> Reinforces/contradicts the frequency variable, and also adjusts intensity of that variable, i.e 15 snows in a winter with 0.70" precipitation won't be that great. C --> Some influence on snow intensity on the days it snows, via snow ratios (15:1 more likely if cold?), and some influence on Spring snow likelihood. D --> Lots of rain, lots of snow in Jan-Apr, especially March, and overall. March snow virtual lock if rainy. Little rain, snow shuts down fast after December. In between...can go either way. E --> Literally an indicator of whether it snowed in November or not. Snow in November usually indicates a snowier than average Oct-May period. No snow by mid-Dec usually indicates average to below average snow. Roughly speaking, snow by Nov 10 - OK, first snow Nov 11 - 30 - Ideal, first snow Dec 1-14 - OK, first snow after Dec 14 - bad. F --> More is better, but how much better depends on the other factors. With more snows, odds of a big snow from one system increase too. An ideal snow season, according to the model, that is possible based on conditions that have been observed in the past 85 years for each of the six variables, would produce 47 inches of snow from October to May - would need a big El Nino, with early snow, lots of rain in August & October, lots of days with snow, a cold winter, and a wet winter. The long & the short of this is some of the factors look **better** than last year despite the La Nina. We had an earlier first snow at the airport, and more rain in August & October. Both support more snow in the shoulder months (Nov/Mar) - it did snow a tiny bit in Nov. Suspect this is a colder winter than last year too which helps, as it probably won't torch in February for a third year in a row, and January looks average to cold, with December mild/warm. This is what the hindcast v. observed discrepancies look like overall. Average error is +/-2.2", 87% shot at being within 4 inches in 85 years.
-
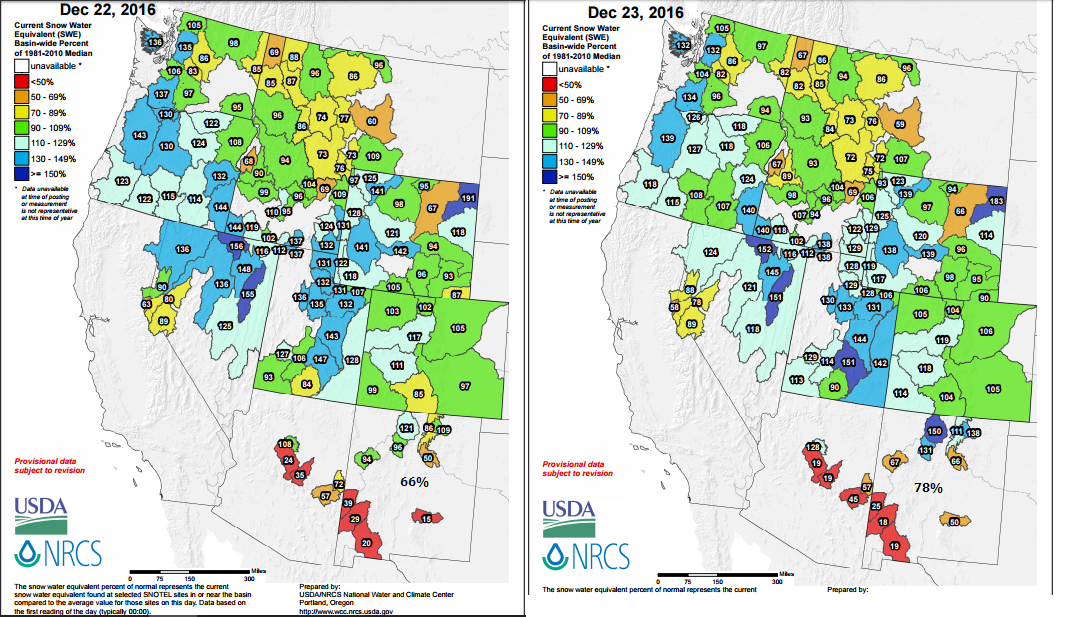
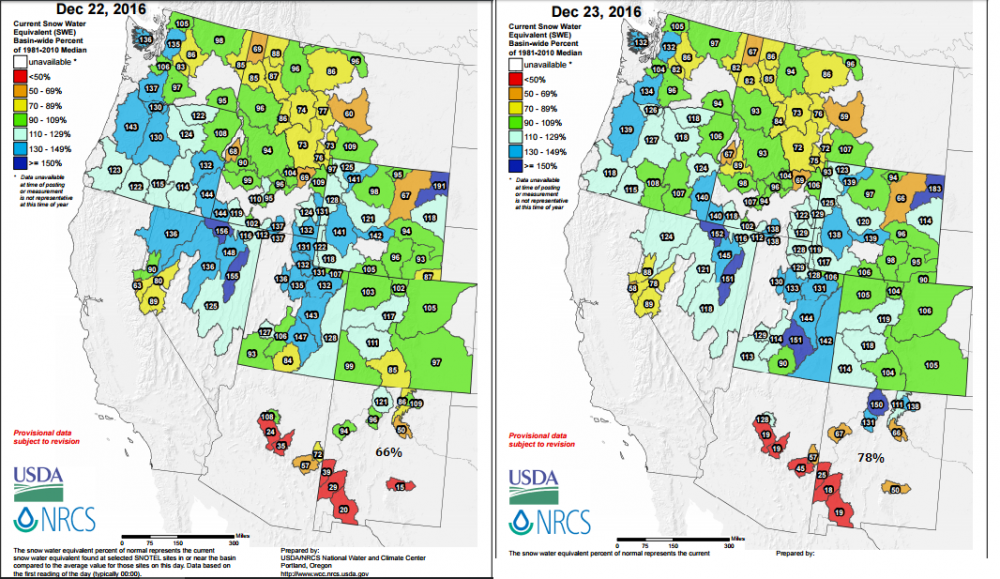
NOAA likes the middle of January for wetness in much of the West. Here is hoping it verifies, snow pack here is only ~77% of normal even with the recent storms.
-
1983 continues to look really strong as an analog in my area - we have a real shot at a white Christmas here. Since 1931 as far as I can tell the city has only had four measurable snows on Christmas, 1939, 1962, 1974, and 1983. 1974 is by far the least crappy of all La Ninas out here for snow - 16.5" snow in ABQ.
-
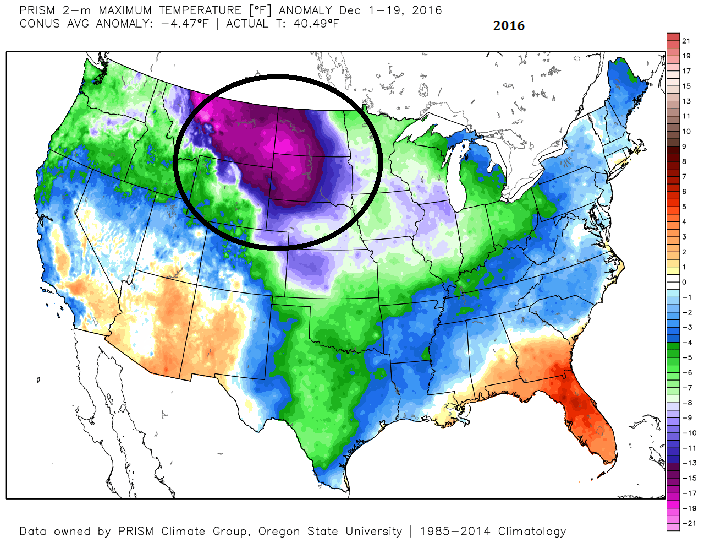
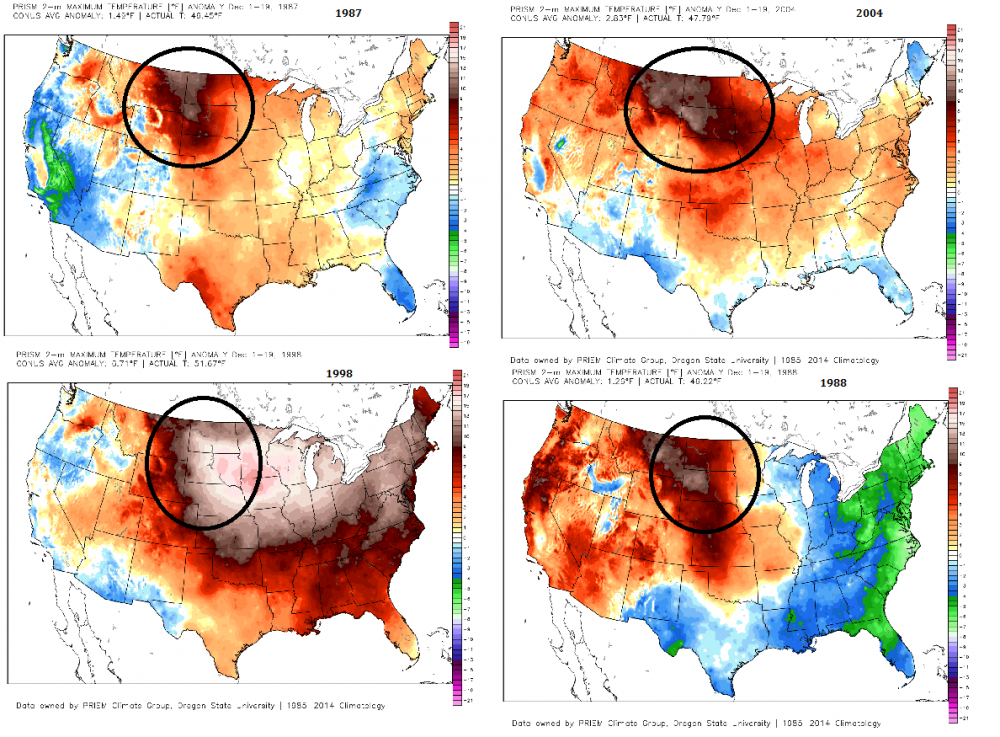
So it turns out that having intense warmth in the upper Midwest/Montana in December is a good sign for big snows in the Southwest in March...sure enough it's super cold up there this year. Not good.
-
Looks third highest to me. But 2014 wasn't behind, same for a couple others. 1936 is the most recent year with a higher PDO value in November, and 1921 is listed as the highest. I was just playing with the ONI, AMO, and PDO values for Sept-Nov, it's very hard to find any year that matches all three. The PDO/ONI split isn't even the hard one, it's the AMO, it's super warm. If you split the three indexes into quarters, only 11 years are even top 1/4 matches across two of the three indexes. Looks something like this: Fall of… AMO PDO ONI 1937 0.358 0.40 0.2 1938 0.332 0.18 -0.7 1941 0.376 1.20 1.1 1944 0.359 -0.21 -0.4 1947 -0.022 0.43 -0.6 1983 -0.168 0.96 -0.8 1984 -0.304 0.65 -0.6 1995 0.110 0.45 -0.8 2003 0.385 0.45 0.4 2014 0.242 1.43 0.5 2015 0.288 1.42 2.0 2016 0.420 0.96 -0.8 1942 may actually be the best match overall, after a double El Nino, Modoki Moderate La Nina, very warm Atlantic, positive PDO. But it seems wetter/colder than that year despite the warmth that year. If you just normalize the indexes into rankings against how close the rank was to Fall 2016, these are the best 10 matches: AMO PDO ONI AMO RK PDO RK ONI RK 2016 0.420 0.96 -0.8 0 0 0 1938 0.332 0.18 -0.7 10 31 8 1995 0.110 0.45 -0.8 33 18 5 1942 0.214 0.37 -1.2 24 22 21 1944 0.359 -0.21 -0.4 4 45 21 1983 -0.168 0.96 -0.8 68 1 5 1931 0.218 0.05 -0.5 23 35 17 2003 0.385 0.45 0.4 2 17 58 1937 0.358 0.40 0.2 5 21 55 1947 -0.022 0.43 -0.6 52 20 12
-
So...the PDO spiked to 1.88 in November, up from 0.56 in October. Not exactly a common combination with the weak La Nina conditions we are seeing. http://research.jisao.washington.edu/pdo/PDO.latest Looks like it is the second largest rise in the PDO value from Oct-->Nov since 1931. Years with big rises from Oct to Nov seem to be pretty volatile overall for the PDO. Year Oct Nov Nov - Oct NDJFMA 1933 -1.19 0.55 1.74 0.55 2016 0.56 1.88 1.32 1962 -1.55 -0.37 1.18 -0.46 2002 0.42 1.51 1.09 1.69 1953 -1.09 -0.03 1.06 -0.79 1998 -1.39 -0.52 0.87 -0.45 1986 1.00 1.77 0.77 1.91 2000 -1.30 -0.53 0.77 0.17
-
I want some pictures of any weird Blue Norther cloud phenomena/mirages this winter. Don't think this setup is going to be coming back for a few years after this winter.
-
It's interesting looking at the meteograms on Weatherbell from the EPS. Says ABQ gets 6.0" snow from Dec 13-Jan 26 (+70%), and that precip is 1.18" in the same time frame (+90%). Would be a warm/wet period, given the temps are showing as +1F to +2F in the same period. Wet anomalies get stronger in the northern/western part of the states. Cooler too the further north & west into NM you go. The 46 day period shows the warm anomalies weakening in NM but growing in the SE, so maybe TX will be perpetually stuck between the two ridges trying to take in cold shots from the north?
-
The next week to ten days will be cold east of the Rockies, and then the blow torch we have in the SW right now will follow the cold out of the Southwest. I'm assuming it cools to average or genuine cold anomalies after the 18th-20th in the SW once again.
-
The mean high for Albuquerque Dec 1-8 has been ~3.7F below the 1931-2015 normal. Will be interesting to see if it can really recover to +2F to +3F for the month as Accuweather shows now. I think the coming warmth in the next few days is real, but overdone beyond that. Been pretty impressively cold in the West so far in December if you look at the Weatherbell Satellite maps (1981-2010 anomalies) or the US Anomaly maps (NE US Regional Climate Center). My mean highs eight days into meteorological winter (DJF) are 6.3F colder than last year. Over the 90-day winter period that's already a shift of ~0.55F (8/90)(-6.3) from last year that should help against the coming and future warm ups.
-
It's been fun watching Accuweather's monthly outlook for my area. Went from 43.0F for a mean Dec high (Nov 30) all the way up to 50.0F (Dec 6). My Oct forecast had NM pretty warm/dry in Dec, which looks decent now even after the cold start. Certainly doesn't look like any major storms here through 12/16/16. My general idea for this winter is the cold is in the MW/East in Nov-Dec (was mostly the SE in Nov) and then it retrogrades pretty to the West in January, and then it kind of centers between the Mississippi and the Continental Divide in February. We've been seeing pretty different setups to last year so far, and for all the warmth in the Super El Nino, Jan 1 - Jan 22 was pretty cold in the East in 2016. Would expect mild to warm temps in that period for them, with a colder West Coast.
-
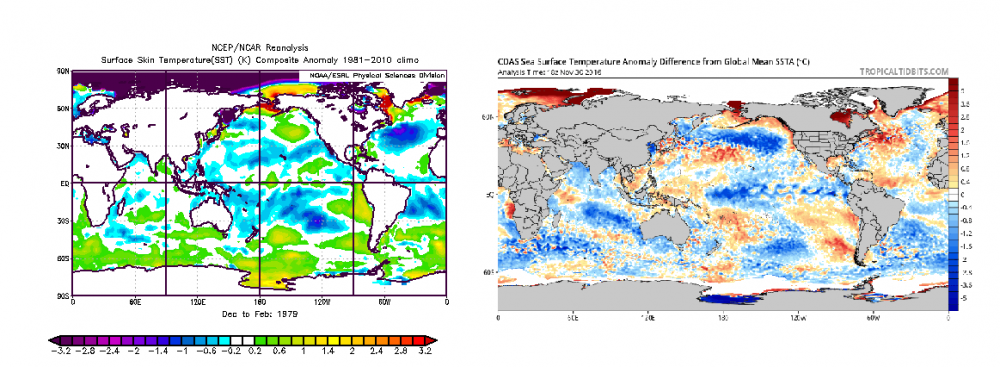
ONI value came in -0.8C for SON. So...we have a weak Modoki La Nina, with the Eastern Tropical Pacific in borderline El Nino conditions (warm), a non-cannonical, but likely warm PDO (the warm ring and tongue are a bit off the historical norms for placement), and the AMO (ESRL long) came in at maybe the warmest value ever for November since 1856 (0.400 - didn't check - just eyeballed). AMO is bad for moisture in the SW, Modoki La Nina is near average, and warm PDO is good for moisture. Not really a terrible set up for the winter, especially if the cold air spills into the east and cools the Atlantic as the La Nina weakens?
-
I gotta tell you guys, for the last week or so the La Nina has looked pretty ragged. It's too early to know, but I think it peaked in SON. Will be interesting to see the value for that period on Monday. The years with La Nina or La Nina ish conditions in SON that then weakened ("warmed") by DJF since 1930 are: 1931, 1947, 1956, 1964, 1971, 1978, 1983, 1989, 1992. Three of those years come up a fair amount in temperature/precip trends this year in my area - 1978, 1983, 1989. Also, 1931, 1956, 1964, 1971, 1978, 1983, and 1992 - all either immediately followed or preceded an El Nino, so that's kind of interesting to think about in terms of the interference to La Nina / La Nina-ish conditions. I used <=-0.2C in SON in Nino 3.4, followed by a warmer reading in Nino 3.4 in DJF as my thresholds, and I threw out the years that were <=-1.2C in SON, since this is a much weaker event. It's actually an average to pretty wet pattern for everyone but California & Maine.
-
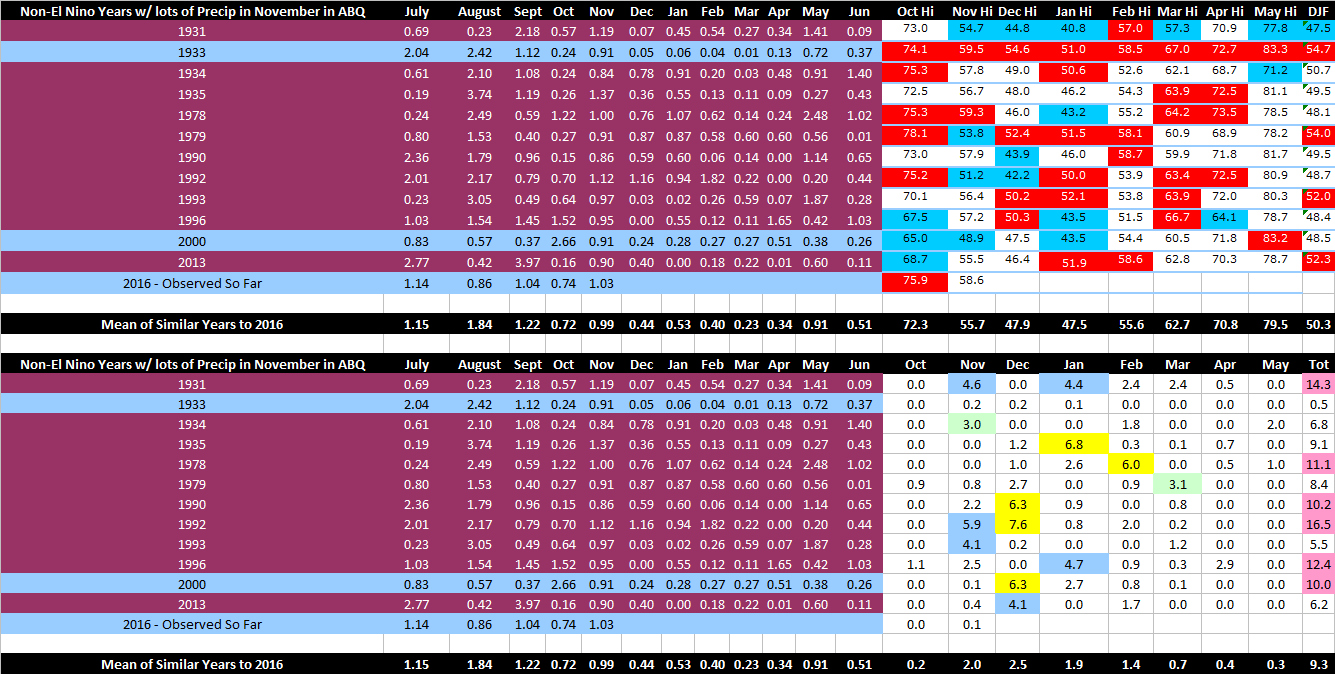
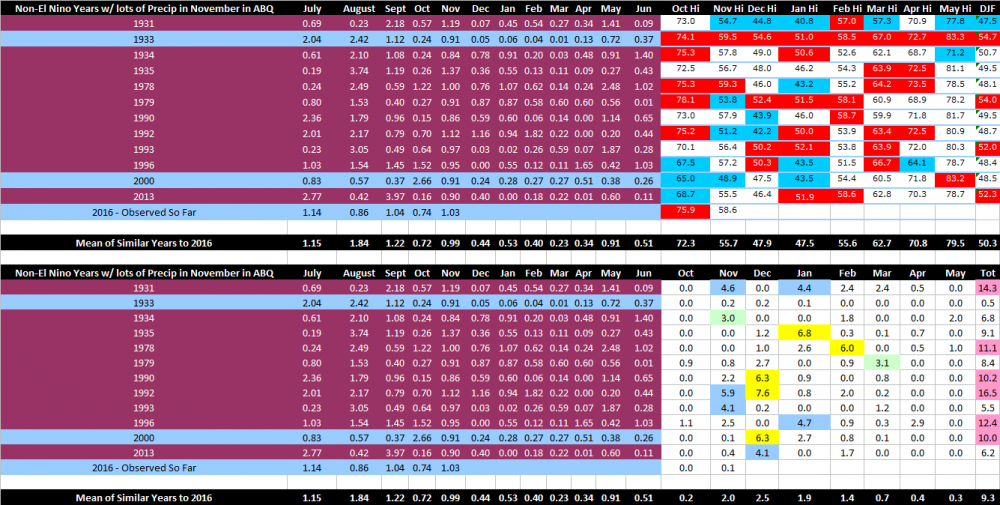
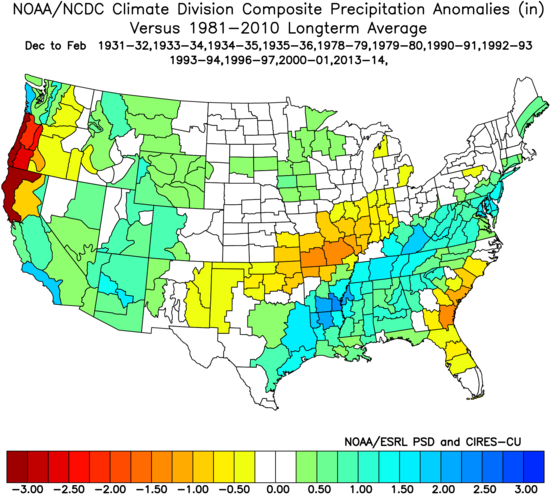
So I matched "wet" Novembers in non-El Nino years to conditions observed this year in Albuquerque. It's like dead on, every month except for August, when most of the city probably did have 1.2-1.5" rain, but the airport only had 0.86". The signal is pretty strong for an above normal January in terms of precip here, and the implied storm track is pretty interesting nationally. Jez - you should read some books and then research what you don't understand. That's what I do!
-
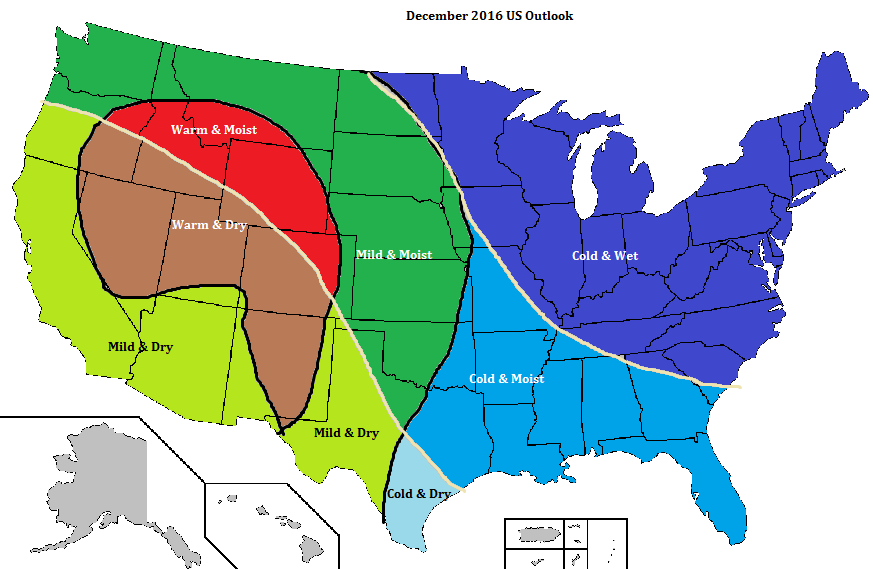
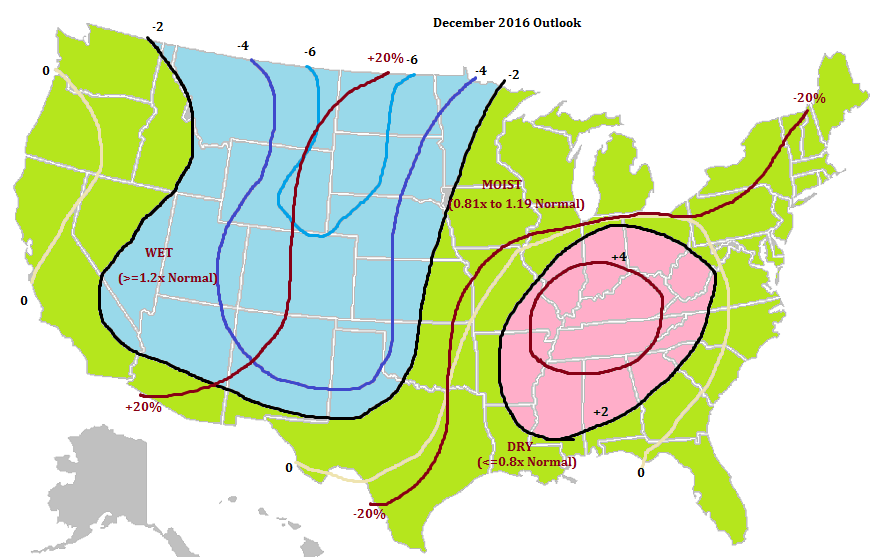
My outlook for December in October was the first image ("December 2016 US Outlook") But now I think this is on the table ("December Scenario - Worst") I'm a bit annoyed as the outlook was about spot on in Oct & Nov. The new December map is pretty close to what I expected for temperature profiles in January. Accuweather has been showing Dec temp profiles in much of the West at around 2-6F below normal for a while now. Albuquerque was shown last night at ~43F for a mean high, against the 1931-2015 average of 47.8F. Today it shows 43.8F. Denver, Cheyenne and Albuquerque all look around 3-5F below normal by their reckoning.
-
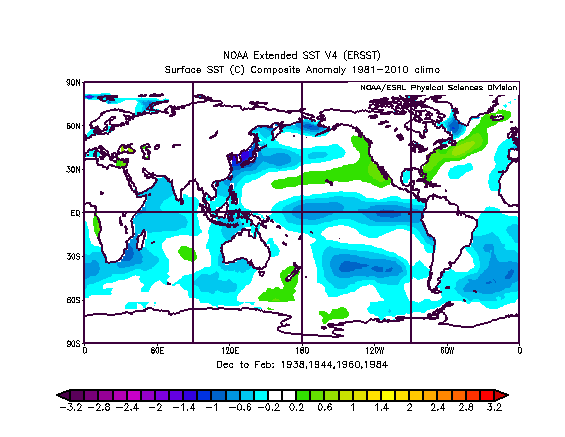
The oceans aren't a great match to 1978, but the Atlantic was closer than I expected it to be. 1983 is fairly close, but off in certain spots. I like a blend of 1937, 1943, 1959, and 1983 for the oceans as an ~80% match. It's a bit off in the Western Atlantic/Western Pacific. I formalized my "June to November" observed highs v. forecast thing - for the last 30 years, it shows a small amount of skill for forecasting seasonal temps here. It's something like 80% confidence at +/-3F for it's DJF estimate (range is 12F historically, 44F-56F, so it cuts out maybe half the uncertainty?), and it's still ~67% at 2.3F. It's about 15% better than guessing the average (49.5-49.6F) each year. Anyway, it says ABQ has a mean high of 48.6F - and thus an 80% chance we are within 3F of that. Against the 1931-32 to 2015-16 winter time frame, that's -4F to +2F - a full 2.3F colder than last year, when the hindcast came up with 50.9F +/-3F. The Spring has either less variability or this is a better tool for Spring, as it's +/-2.25F for MAM 80% of the time, and +/-1.8F 67% of the time. Warm Spring is slightly favored in my area, but likely near average. I keep harping on 1978 because it is a very strong match for my last six months of temperatures here - but in my area it wasn't a particularly cold winter. I'm somewhat partial to lumping winters after two El Ninos in a row together - it takes longer to cool the oceans down than in a normal El Nino to Neutral/La Nina transition. So I look pretty hard at the winters starting 1941, 1942, 1959, 1970, 1978, 1988. Just from that list, 1942, 1959, 1978, and 1988 are all somewhat similar to now, at least for my observable weather.
-
Do any of you like 1978-79 as an analog? It was a borderline La Nina (-0.4C) in Fall of 1978, but it weakened to Neutral in winter. It followed two El Nino winters (76-77, 77-78), and occurred after a reversal in the long standing sign of the PDO (1976/2013 - although the more recent flip seems to be a spike more than a 30-year flip). I ask because the La Nina seems to be weakening, we're following two El Ninos...and the cold experienced in the US in January 1979 (-8F to -20F over most of the US) has been occurring over Asia for the past two months. January 1979 was stupid cold in the middle of the country - including TX, OK, etc.
-
Some flurries around Albuquerque tonight. Don't think it stuck anywhere - very light, above freezing. Always amazing to watch the dry air do it's thing, went from 37F with a 27F dew point to 35F with a 29F dew point and snow in about two minutes. Fell to 33F with a 30F dew point before it stopped snowing.
-
I was hindcasting my "objective" match testing the other day by mean highs, and although it doesn't work nationally, it does seem to show some skill from roughly TX to AZ to OK to Southern UT/CO/NV, and then quite a bit of skill the closer you get to ABQ. It doesn't really show any skill for precip, just temperatures. What I wanted to show though, was that last year, the temperature profile behaved more like a blend of La Nina years from June-November, and then remained La Nina-ish/warm in Winter and to a lesser extent Spring. The temperature blend this year, despite being nominally in a La Nina, is much more of a weak El Nino / warm Neutral signal, which favors a much colder winter, maybe ~2.5-3.5F colder than last year. The six closest mean high transitions last year from June to November favored a winter (Dec-Feb) mean high of ~50.9F in Albuquerque. It was 51.4F. The average is 49.5F. So the method identified slightly warmer than normal correctly. This year, the method says 48.6F - which is colder than normal, and 2.4F colder than last year.
-
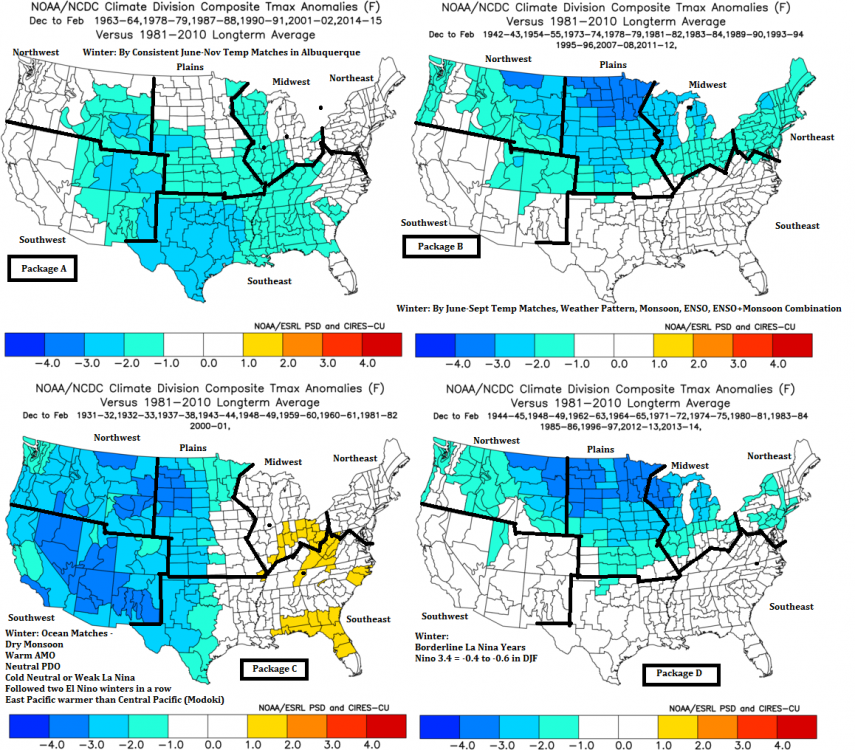
Panel A is the best match to my mean highs from June-Nov carried forward to Dec-Feb Panel B is the best match from June-Sept mean highs, the monsoon, ENSO, years since ABQ had >9.6" snow, and the monsoon+ENSO Panel C is the best match for my winter ocean expectations - Cold Neutral to Weak La Nina, Modoki, Neutral PDO, Warm AMO, after two El Ninos, Dry Monsoon Panel D is the best match for borderline La Ninas only: -0.4C to -0.6C in DJF So far, A has been pretty good for Nov, with B good for Oct. My historical testing of these methods show "C" should become most accurate later in the winter, with "B" fading after December to irrelevance. D should be relatively decent. But I lean towards a split of "A" & "C" for the winter, plus 1-2F in the SE. Essentially, A early, then C late. Anyway, best bet for the West: WA/OR: slightly cooler than normal (-0F to -2F) ID/WY/MT: pretty cold (-2F to -4F) CO/WY: cool (-1F to -3F) CA: normal (-1F to +1F) AZ/NM/NV: normal (-2F to +2F)
-
Looking back at non-El Nino years that were relatively wet in Albuquerque during Sept-Nov produces an interesting list of years: 1935, 1938, 1978, 1983, 1988, 1992, 1998. Barring more rain, or our first snow this month, those years had 2.4-3.2 inches of precipitation from Sept-Nov. We're at 2.8 inches of precip in Sept-Nov 2016. I consider 1938, 1983, 1988, 1998 to be La Ninas. 1992 & 1935 are sort of warm Neutrals that wanted to be El Ninos, with 1978 following a double El Nino as a Neutral year. This is probably the wettest November NM has ever had in a La Nina, so blending in Neutral years seems appropriate. 1978, 1983, 1988, 1992, 1998 - these years all followed an El Nino. Pretty cold winter in the US if you blend those seven years together in the winter. Most areas 1-3F below normal, 3-5F below in Montana and the Upper Midwest, +/-1F in the SE. Very wet in much of the west & the east, drier from El Paso to Detroit.
-
This is an interesting forecast idea - and consistent with what I put out in October: - Warm early - Colder late - Lots of variability for where cold/warmth is in any given moment https://riskpulse.com/blog/2016-2017-winter-weather-outlook/
-
Lots of lightning, heavy rain, mist and hail here tonight in the Land of Enchantment. Snow above ~7,000 to ~7,500 feet. Wettest November in Albuquerque since 2004 with over a week to go.
-
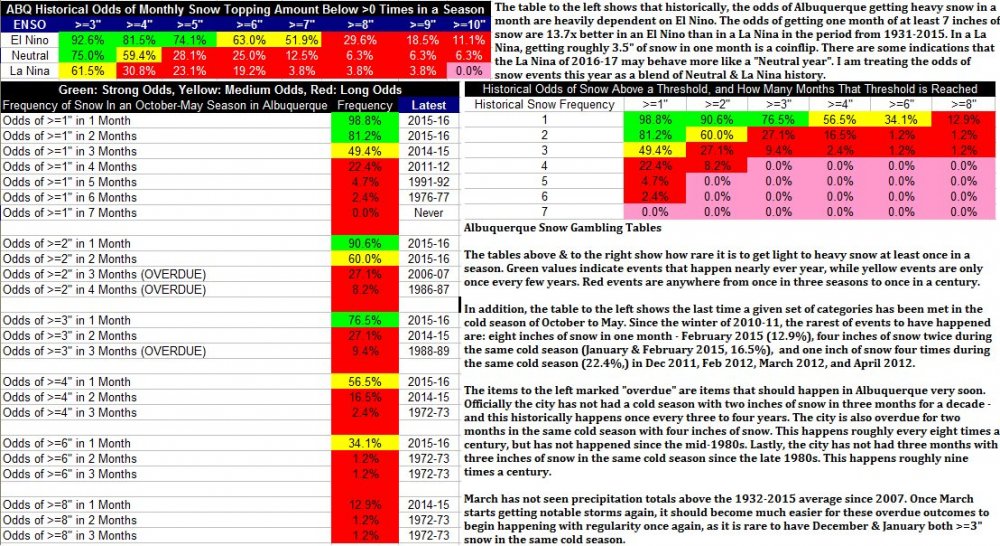
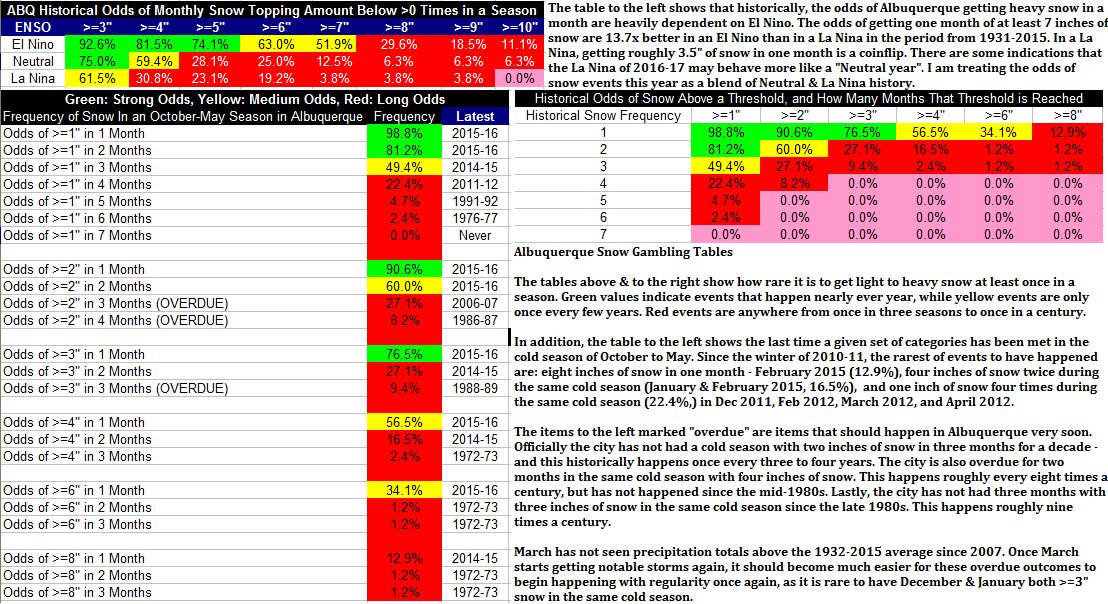
Now that its getting relatively cold - two frosts here in ABQ) - I dug out & updated my "gambler's snow tables" for Albuquerque. It's a good way later in the season to see if the computer models are spitting out bull. The table reminded me how awful most La Ninas are in the Southwest for snow. I'm 5,300 feet above sea level, but the odds of getting even 3.5" snow in a MONTH, not even a storm, a MONTH, are only a coin-flip in a La Nina based on 1931-32 to 2015-16. One of these years we're going to get actual notable precipitation in March again and the items I've marked overdue should begin to fall more readily. We haven't had a March within even 20% of the long-term average (0.5") since 2007, so it would be nice if it happened this year. One thing is for sure, given the bubkis precipitation we get last March, even as it snowed in Guadalajara - check out Nieves en Guadalajara on twitter - we can't get less precipitation in March than last year.