

The_Global_Warmer
-
Posts
9,970 -
Joined
-
Last visited
Content Type
Profiles
Blogs
Forums
American Weather
Media Demo
Store
Gallery
Posts posted by The_Global_Warmer
-
-
This thread is an alarmist disaster. Come on.
This thread is actually filled with a ton of information with tons of legit science backup. Everyone participitating has learned who chooses to learn in many ways about CH4 in this thread. Where it comes from, how strong it is, how the measuring process works, how much is there out there?, how legit the threat is, upper atmospheric charts and methane analysis, what are the wind patterns that carry CH4 as well as other GHGS throught the atmosphere, why did methane stop rising for a while, why is it rising again, how long has it been rising, how far back does the rising go, what are the implications of this, does the sea ice reduction play a role, how much of a role does solar insolation play, will we see more of this in 2012, 13, 14?
I can go on and on. This thread is loaded with incredible amounts of information so either you already know all of it which is doubtful, or your not in the thread to learn it.
-
And yet peer reviewed papers posted in this thread don't support that position at all. The source(the authors) of the article that prompted this thread reject that position also. There is no history beyond several years to even speculate on methane release. (Not even a hockey stick with cherry picked tree data as proxy to temperature. Tree data that is replaced with real data the last 50 years because real data does not match the proxy.)
There are many things we do not know about climate change. Somehow massive releases of methane have not doomed the planet in the history of the planet. Even when dinosaurs roamed the poles.
Will you show me where this is being used?
-
Until we see say 50-100 million gt of mthane break oit at once or a very short period. we won't see wide spread changes.
This is the pre-Cursor to massive releases this shows us that clathrates are breaking down from melting. These may temporarily freeze or have a slowdown also the ice around 5-1 meter has grown by now , this will block or slow the release.
Next summer this will likely seem like a minor event compared to then. What do you think 2-3 months of ice free solar insolation will do?
How about 2013?
2014?
Even if by some miracle the ice extent naturally variables its way to 5.0-5.5 km2 extent. Remember that is 15% the entire arctic could sit at 30% concentration and the I've extent would be 8.5 mil km2.
The arctic ice albedo feedback won't stop. Our buoys tell us that more heat is being trapped than any recent times.
hopefully we have better tracking up there next summer.
-
Been a way for a while. But before I left this forum had kinda agreed that posting articles about climate from Uk newspaper was stupid.
This artical was stupid. No links from peer reviewed papers. No explanation how loss of sea ice enabled Methane to be released from under the ocean. This is not a political sub forum.
The Ice reflects the Shortwave radiation back. Between the Laptev, ESB, Chuchki, and Kara the amount of extra W/M2 since say 2007 could be pretty high like in the Hundreds of Billions, or maybe Trillions by now. I am not sure. But that will definitely even heat up the arctic floor enough, expecially if it is 100M or shallower, the futher down in latitude the more deep the sun rays can reach. Some places with tons of methane are closer to shore with 30-60M deep water that might be getting 2-3 months of extra sun that it never got before or very very rare.
So without the Sea Ice retreat/loss of thickness/loss of age/lost all together this would not be happening. There is no doubt about that.
-
Where else do you believe the methane deposits came from? The earth is in a cool period right now and thats the only reason we even have ice caps.
I have no idea Thats why I am asking you. You made a claim. I have no idea I your claim is valid. I asked if you have anyway to back your claim so I can learn more about this.
-
Interesting that both Semiletov & Shakhova are on board.
As an aside, when clathrates dissolve a huge amount of fresh water is released along with the methane (tracking fresh water plumes is a method used to locate clathrate deposits at risk), the SSS daily charts show a salinity in the ESAS only matched at the southern end of James Bay, which is at best slightly brackish.

Hey Terry.
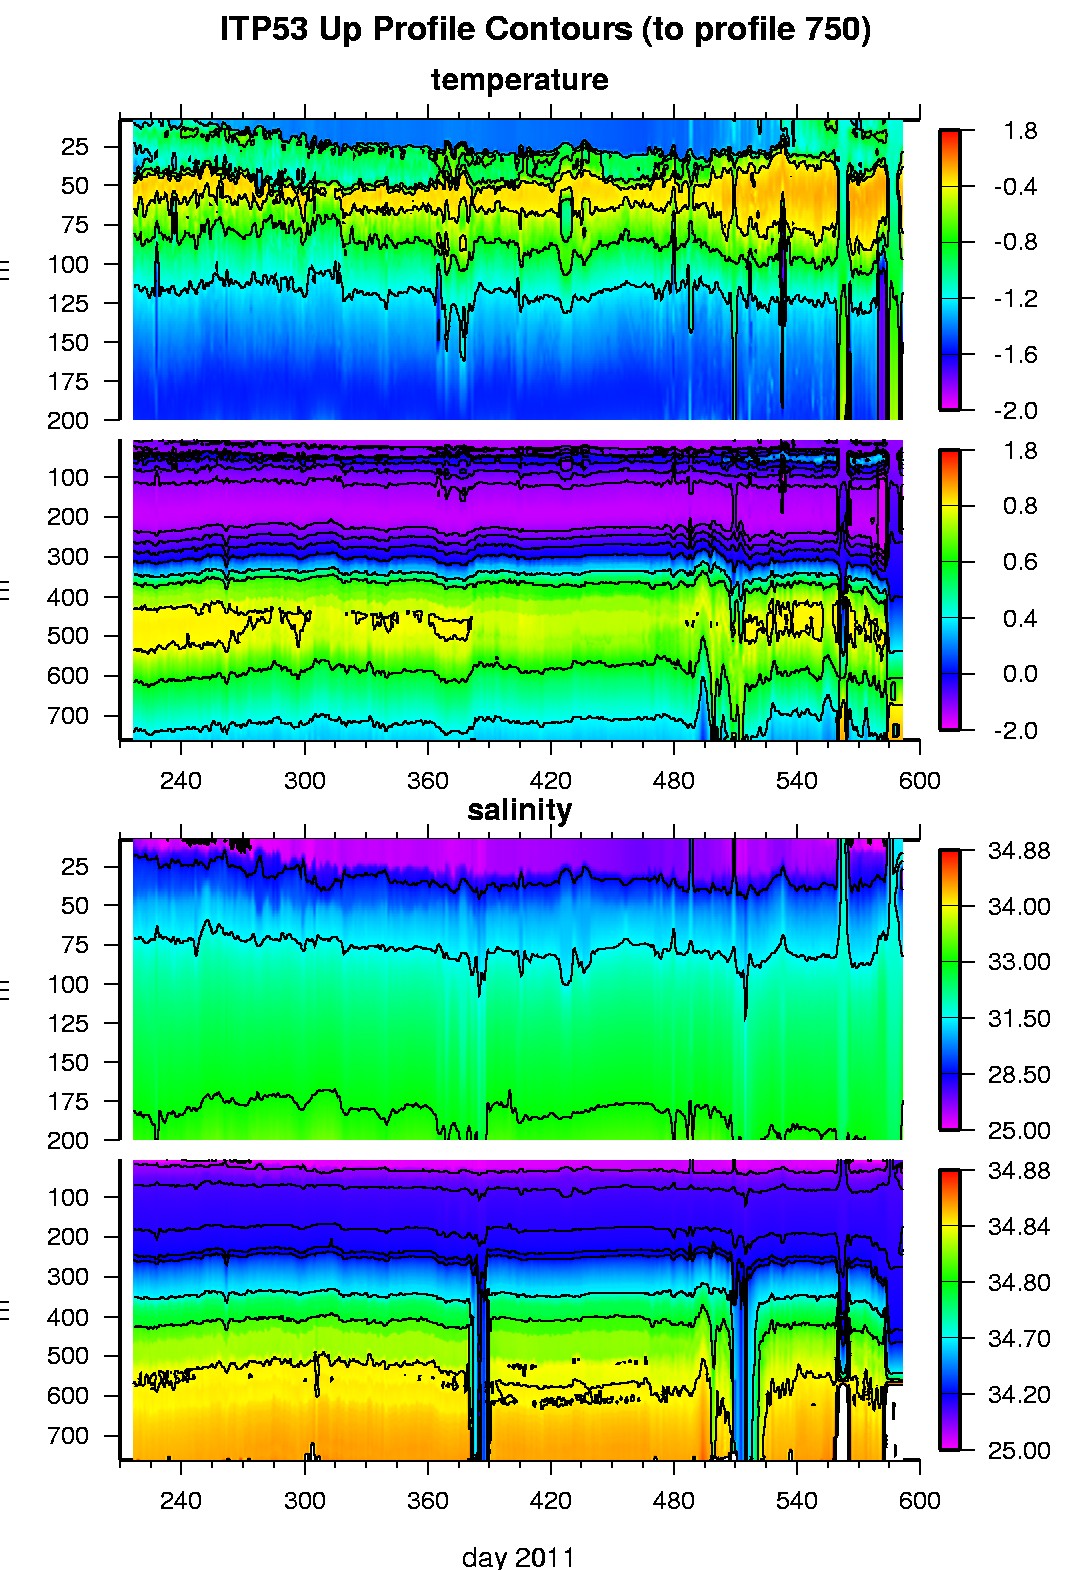
the graph you posted is from modeled data. I would be weary of using it.
http://www.whoi.edu/page.do?pid=75657
That is from a live active buoy that is working 100% correct with no hang ups.
this shows current salinity at:
Last position on 2011/12/25 230033 UTC : 75.0958° N, 138.2419° W
that is quite a bit lower than the modeled data. That looks prety high for a frozen arctic at the surface.
So I am not sure how much credence I would give that graph.
http://www.whoi.edu/page.do?pid=75676
that one is around 77N and 132W that shows closer to 25. So the graph from the Navy looks like it's way over done.
-
Unless they are lying, it is already happening.
They know that, you have to admire their courage. You also have to to believe that they are scared, more for the planet than for their jobs and reputation.
I do, they are involved in something with deep knowledge of it and that knowledge tells them the Earth is in some big trouble. This is backed by mainstream science.
This is matter of how much methane so we can figure out how screwed, if at all we are. Not a matter of if methane warms the atmosphere.
This is true, but will likely be far over-looked by to many folks. Who will cast them as kooks. If we see the ice loss increase/ROW rate of warming increase more in the arctic summers/winters coming up, it won't matter, there fears will get much more light as methane keeps pouring out, unless they are just wrong about all of this. Which I am sure many at this point are choosing to believe over reality. As I write this the MYI is getting flushed even more. We really need a pattern change before we end up going into next summer with hardly any MYI ice left in the basin. We are virtually guarenteed at this point even with a favorable pattern for less ice loss that we will reach 5.0 mil km2 or lower leaving the Russian side totally ice free again for methane clathrates to melt some more.
The Euro develops a stout Dipole Anomaly this week, adding to the already bad conditions in the arctic for the ice.
Some of that is being compacted causing ridging along the Canadian Basin. This is devoiding almost all of the Russian seas of any old ice. leaving only FYI, but maybe will help cause some thick ice to develop threw ridging in the CA Islands area. This still doesn't help the Atlantic side where ice is being slammed out the arctic with relentless 20-40KT winds week after week.
-
An Arctic methane emergency group has been formed, and has set up a web site.
http://www.arctic-me...bout/4558060537
"Letter to the worlds leaders"
"Emergency intervention to stabilize Arctic sea ice and thereby Arctic methane is today a matter of our survival."
They will be cast off as crazies. Even if what they believe happens.
-
As I learned before talking solutions are not very productive. But science in thread has been extremely productive.
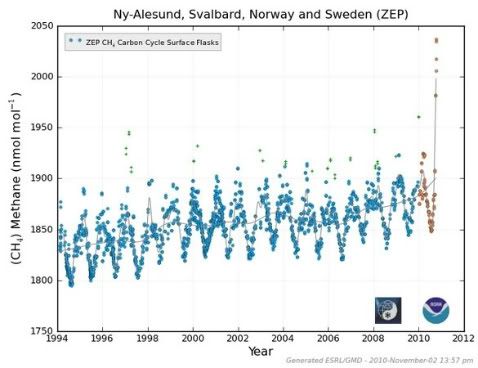
I thought someone posted the ch4 levels from svalbard?
Between the myi and perpetuall blow torch. 2012 in the arctic will see the russian side melt out again. likely assuring more and more clathrates to repeat and do more.
If we get an pattern like now look out.
Remember in middle sept when I said the Ice was very thin and we saw Ice retreat 100 miles in 3 days with good winds, not great.
The Ice along the kara, esb, laptev, and barents will be .50 to 2m thick at best.
Solar insolation starts back up around 78N in late Feb.
Gonna be an interesting spring.
-
Thats pretty sweet science.
But this is reality. You don't have methane plumes at that level and no atmospheric changes.
With The Hippo data now out there.
We are about to see new papers with better models predicting things so we can continue to refine projections
-
There has been independent widespread measurement of elevated methane in the arctic.
"Something too new to fully understand (although a report on it is being prepared for publication), Wofsy says, is a finding of notable concentrations of methane in the Arctic’s atmosphere that trace back to the sea.
“Oceanographers have known for some time that there is production of methane in surface waters of the Arctic,” he says, but “it’s never been observed in the atmosphere.” Those oceanographic data, he says, suggest a source for this methane other than sediments or the melting of icy gas hydrates.
The phenomenon also appears very widespread. “We observed that the ocean surface releases methane to the atmosphere all over the whole of the Arctic Ocean,” Wofsy says."
http://www.sciencene...imate_surprises
This is not good.
Thank you so much for posting this. I am glad to see oxy production was up in the southern hemisphere. But the rest sucks.
-
So this is a mostly a laptev and ESB event or kara and chuchki to barents and bearing.
Also, my cpu is broken. I am getting it fixed this week. Will someone please post any real time obs of ch4 in the arctic region, thank you.
-
Well done phillip.
-
How much methane was released when the last iceage ended and a size of ice several times larger melted then we have today. The ice we have at the poles today is a fraction of the original sheet.
The ice albedo feedback would also be many times less potent.
this isn't bunk science. The methane is there abd its enough to cause major changes over a short period.
How much ice a have is irrelevent. This is happening because ladt summer and the last few recent ones are ice free ove
-
That methane thats under the ice was probably the remains of plant/organic material that was left behind when there were actual plants growing in those spots.
The methane is in the sea floor. I am not sure what you meant there.
It is traped there.
Under pressure and lowertemps.
Unless the the sea ice regenerates the clathrates will break down and methane will continue to pour out at an accelerated rate with likely major releases that will have larger impacts on our climate.
As far as the billions of gigatons of methane being from plants that used to be there. Do you hace any thing to back this?
-
Barrows CO2 levels also jumped to the 402-404 range from the 390-393 range.
This could be in error. This also couldbe from methane converting to CO2. It could also Be that some carbon was trapped along with methane that was released.
The Molecular Hydrogen also saw a big dive lower the last two weeks.
I don't know what this means but I would assume density of gases would stay pretty balanced.
-
I dont know. The laptev is iced over. There had been perpetual SLPs over the N ATL and Barents. This has pumped some warm air into the arctic.
Physically speaking the methane would add to this. but it cant be very much
-
I dont know. The laptev is iced over. There had been perpetual SLPs over the N ATL and Barents. This has pumped some warm air into the arctic.
Physically speaking the methane would add to this. but it cant be very much
-
Is there a similar CO2 map ?
So Barrowand svalbard have both seen spikes in methane.
It will be something to pay close attention too as this goes forward.
-
Probably the break up of the Soviet Union - not the most environmentally conscious of regimes.
BTW here's a graph from a little closer to the impacted area.
The milks gone bad.
Lol, that sucks..luckily as that flows around the planet we won't see such a sharp rises. but that is pretty ridiculous. I wonder how long it will take to reach Hawaii.
It will be interesting to see how much has been released.
What is worse is the MYI has been pushed away from the Russian side. Basically it's almost guaranteed the same places melt out next summer barring a volcano.
-
Phillip-
Thanks for that post. I saw that there was a lot of replys. I have a 45 min train ride to work. So I was pretty excited to have so much quality info to read.
That turned out to be a major let down.
The fact that no one could answer my questions tells me that both sides need a reality check.
We have seen no measurements on what impact this will have.
we dont know how much methane was released. We should wait to see how much was released and observe this region very closely the next few years to see if this kind of release continues to grow stronger or weaker.
Observations and information gathering are our best tools for future assesments. We know the Earth is going to warm more regardless of this. So we can't stop it any ways. If avrupt action is needed we will know soon enough.
Nothing I say about the childish behavior I this thread will be received and will promote more childish behavior. I just hope it stops.
So lets and have a discussion on what this means scientifically anything else should be deleted, the thread derailing is old.
I know Barrow and Hawaii have methane obs.
I am not on a cpu so I would apreciate it if someone else would find the latest for us.
-
Phillip-
Thanks for that post. I saw that there was a lot of replys. I have a 45 min train ride to work. So I was pretty excited to have so much quality info to read.
That turned out to be a major let down.
The fact that no one could answer my questions tells me that both sides need a reality check.
We have seen no measurements on what impact this will have.
we don
-
I get called an alarmist. And whatever BS, but this report is sickening.
I guess some of the folks reading this want to deny it. But this isn't good. Let's hope this is a seasonal event. And was in response to high end in situ warming and not a long term thaw. But that is not the likely reality.
Can we tell how long this particular methane has been there?
Is there any studies out with their actual measurements?
How long before the Methane shows up on obs like Barrow or Hawaii?
What is the methane forcing formula? Like w/m2 per how much?
-
This might sound like a dumb question but how much will actually stay in the atmosphere?
Compared to say being absorbed by the oceans or plants and other things?
This is not good.
in Climate Change
Posted
Peter Wadhams spends a lot of time in the arctic and is well repsected. I was suprised to see him on the list even though he does think the ice will possibly melt out between 2015-2020. But he didn't believe that until he went back to the arctic recently during the summer and saw the state of the ice himself.