
blizzardof96
-
Posts
1,565 -
Joined
-
Last visited
Content Type
Profiles
Blogs
Forums
American Weather
Media Demo
Store
Gallery
Posts posted by blizzardof96
-
-
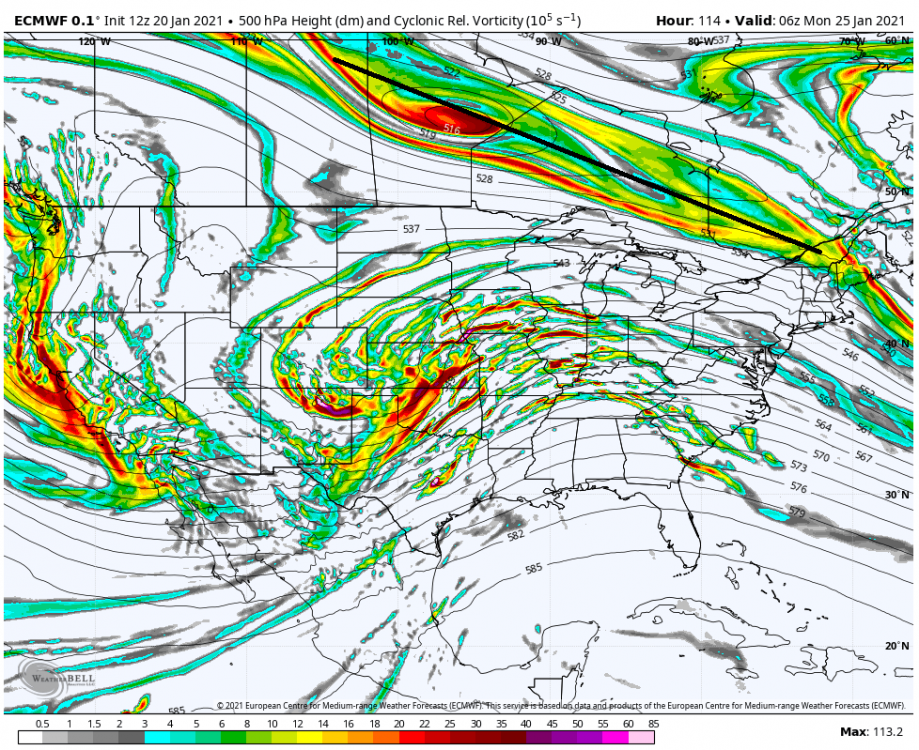
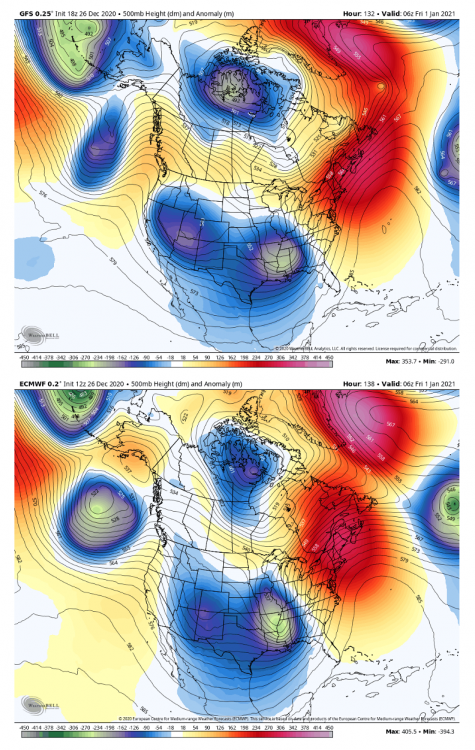
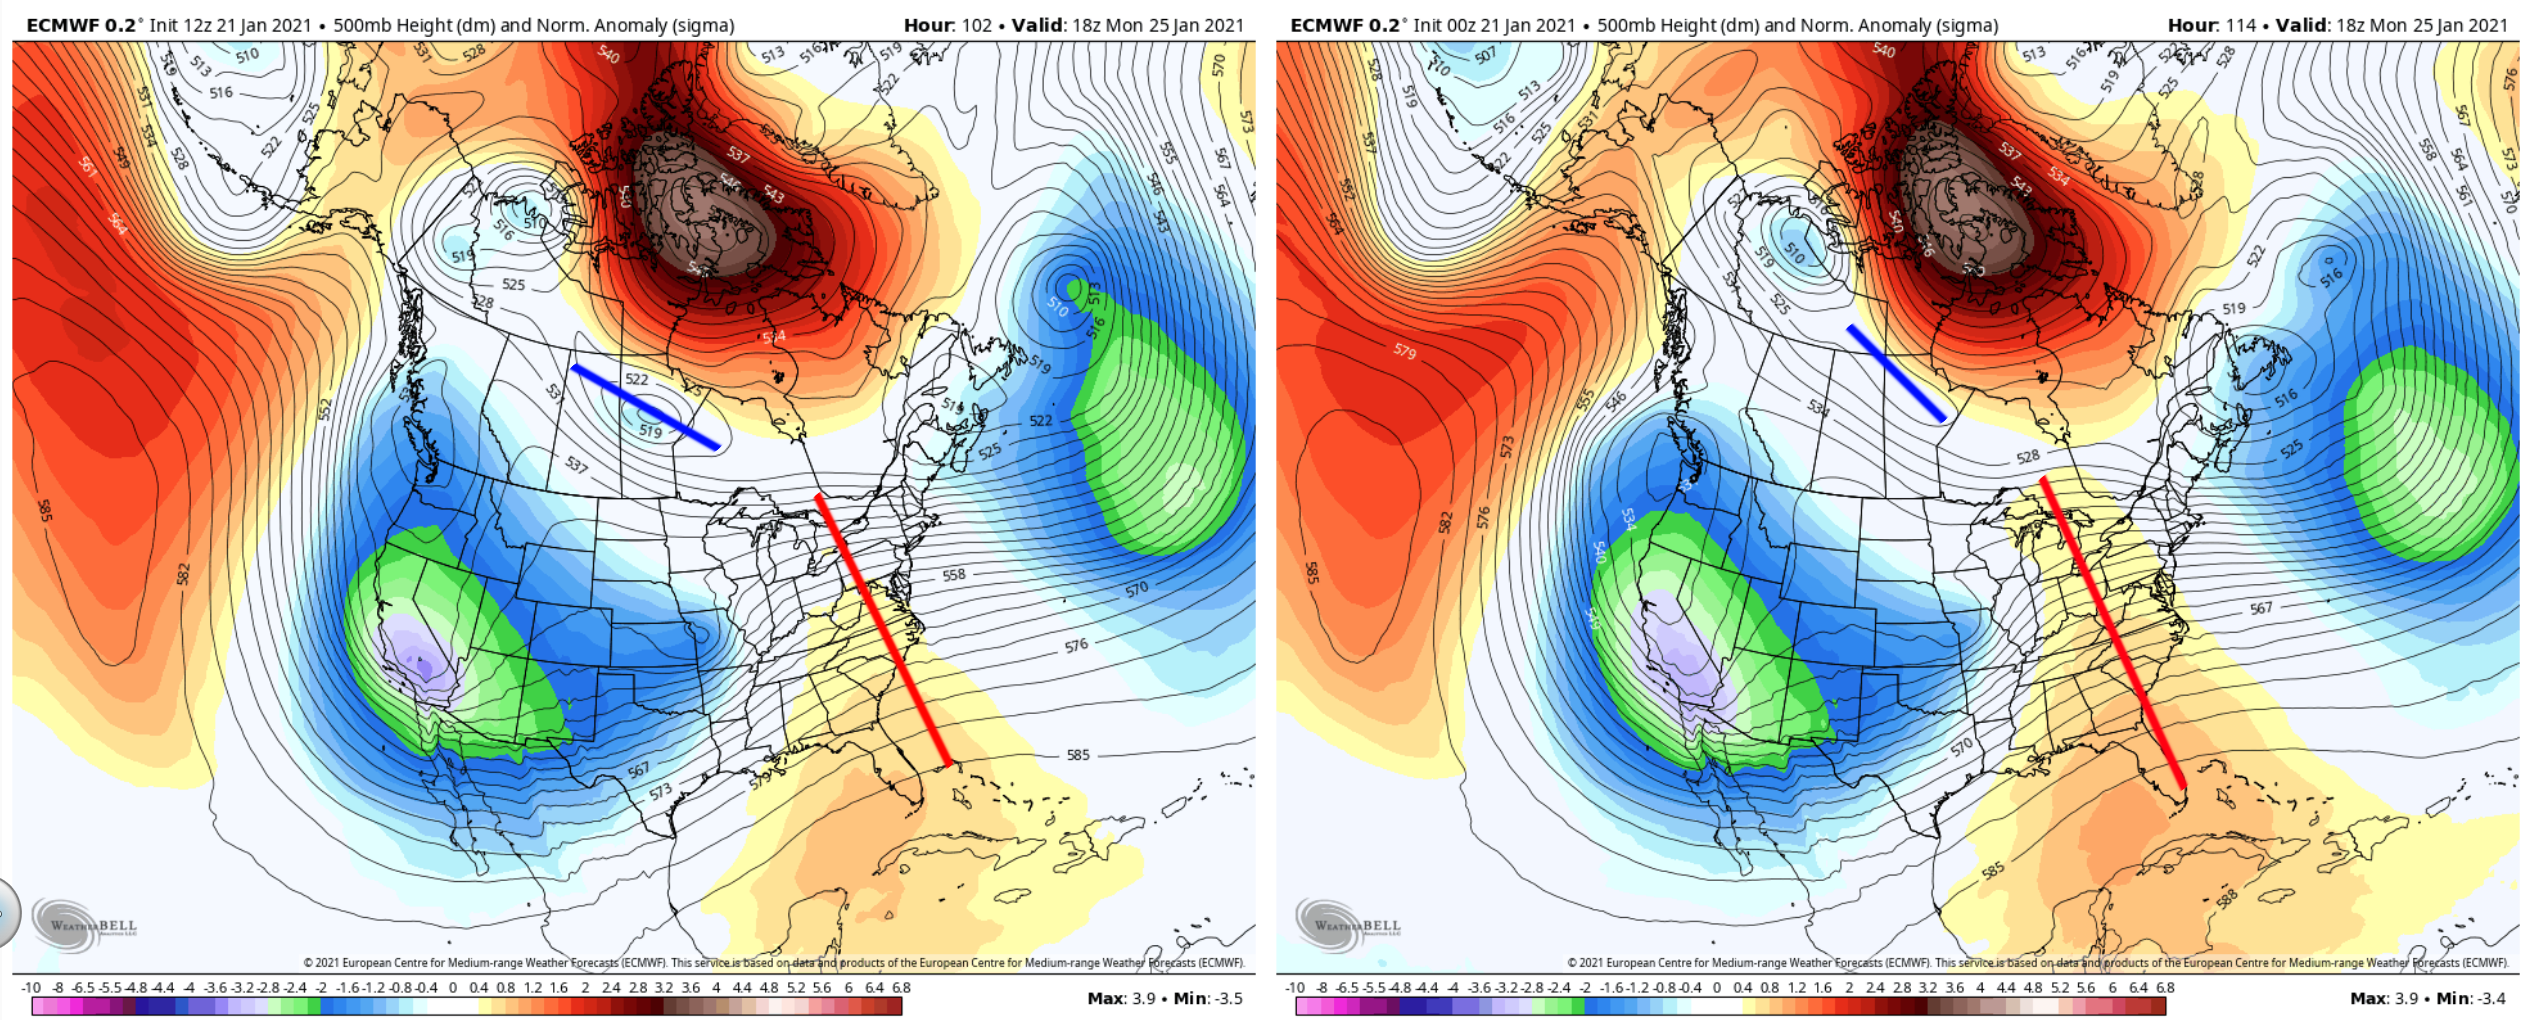
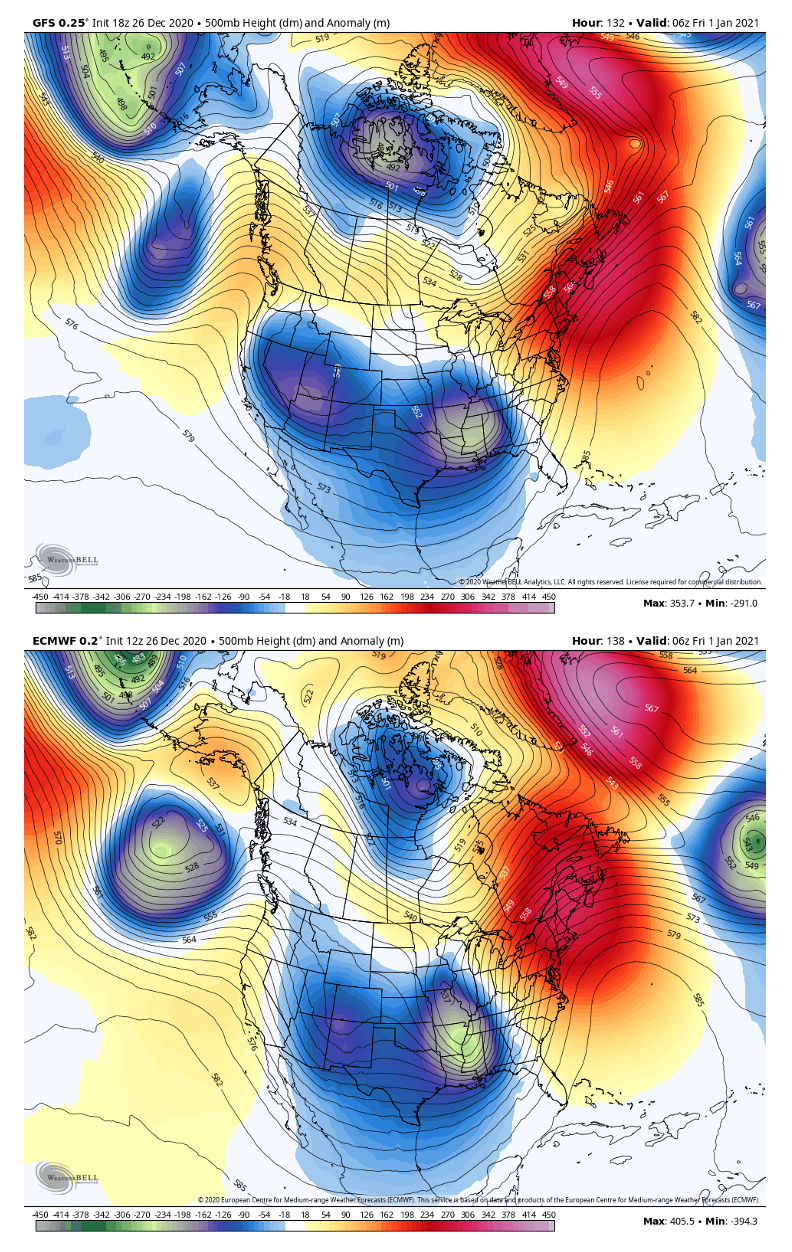
Quick 12z/0z ECMWF comparison

-
 1
1
-
 1
1
-
-
Can see the differences between UKMET & ECMWF handling of the confluence zone -- Manitoba vortex


-
2
-
1
-
-
Here’s the 500mb field from the 12z UKMET

-
1
-
-
Very impressive looking UKMET run
-
5
-
-
2 minutes ago, Chicago Storm said:
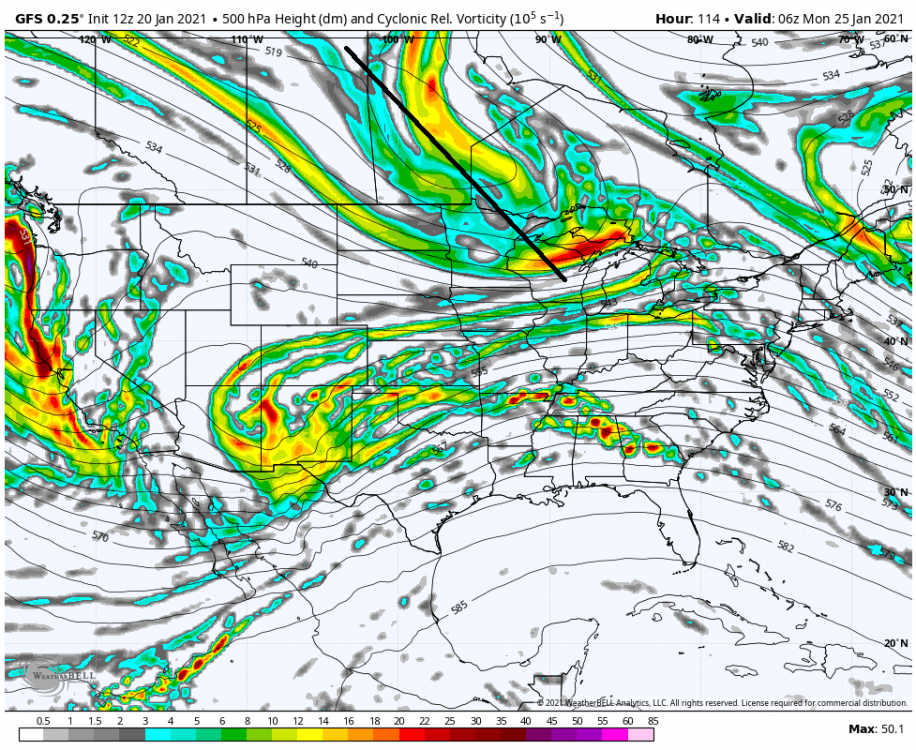
0z GFS caving significantly.
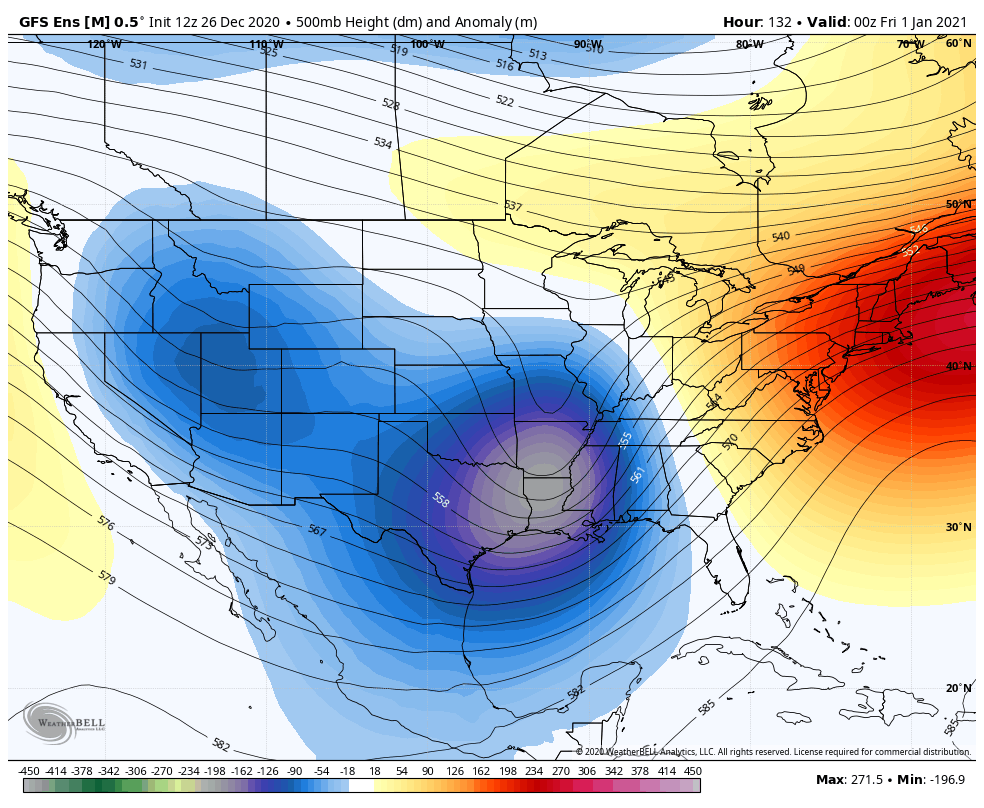
.Positive trends at H5 with the northern vort further north.
-
2
-
-
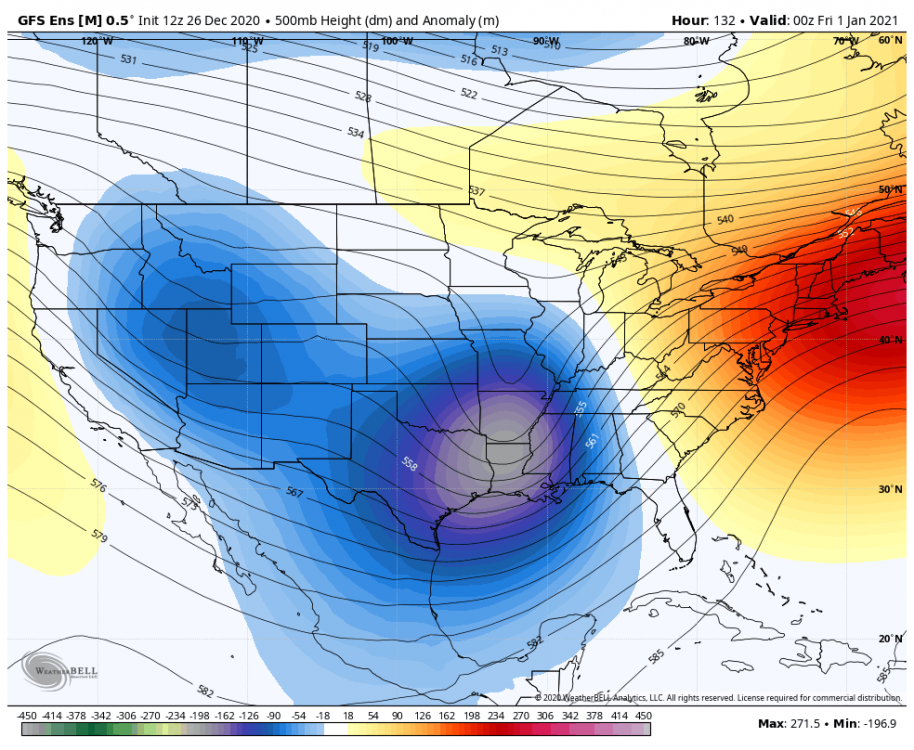
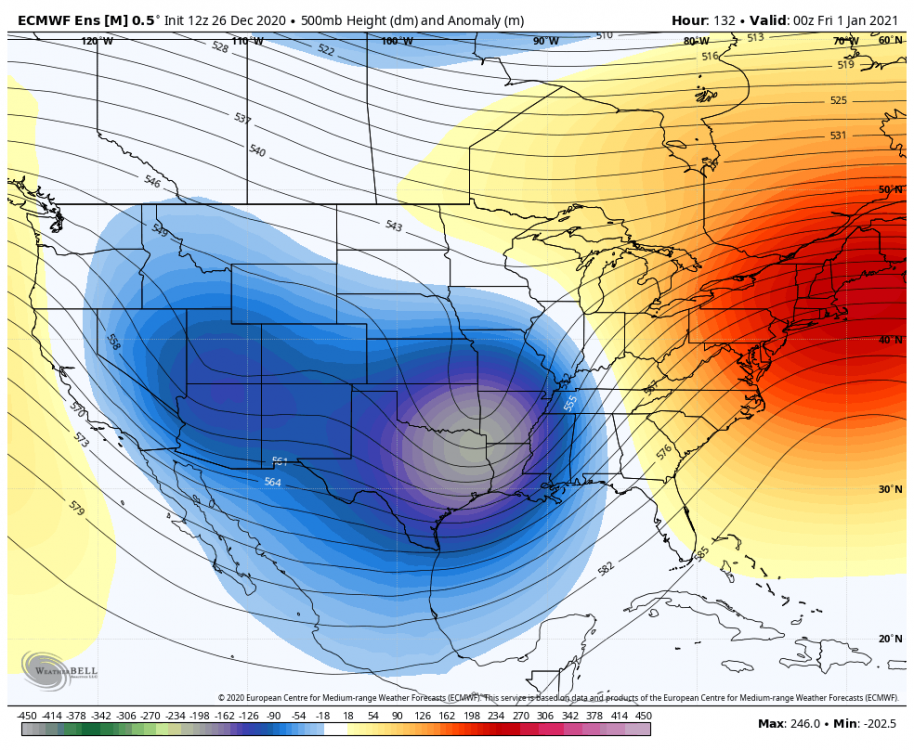
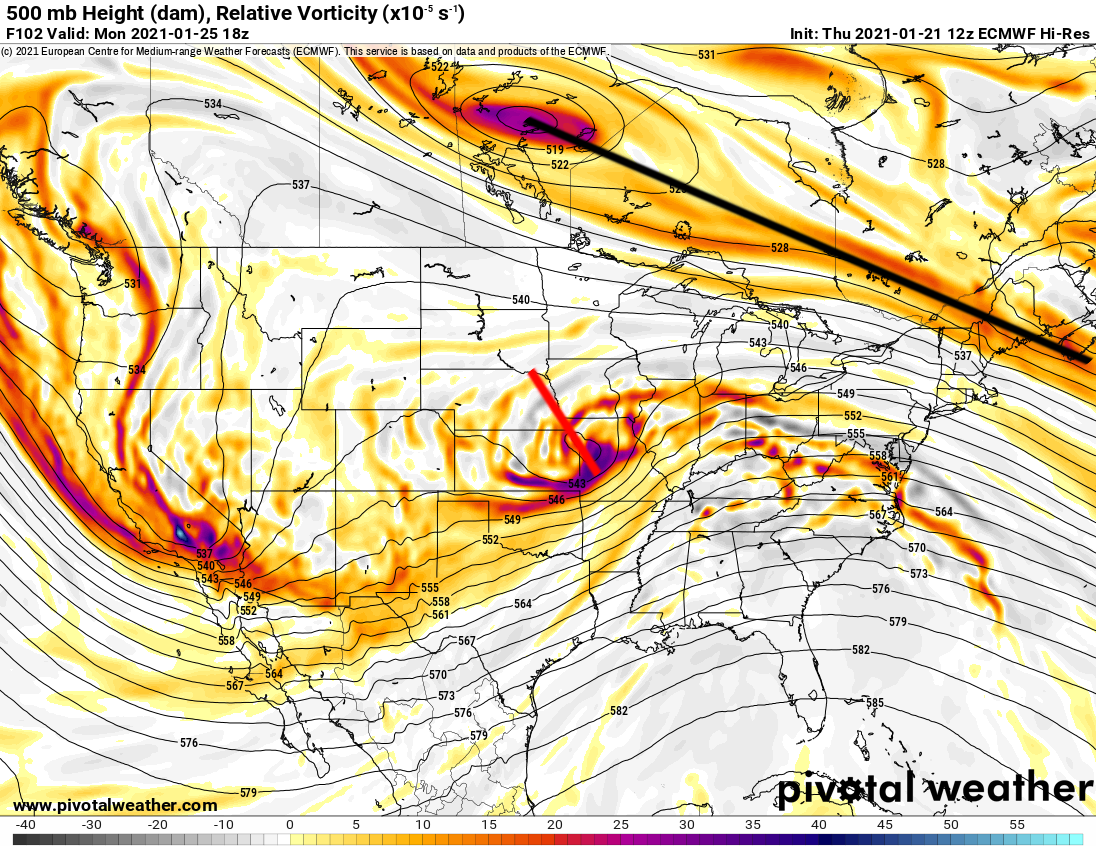
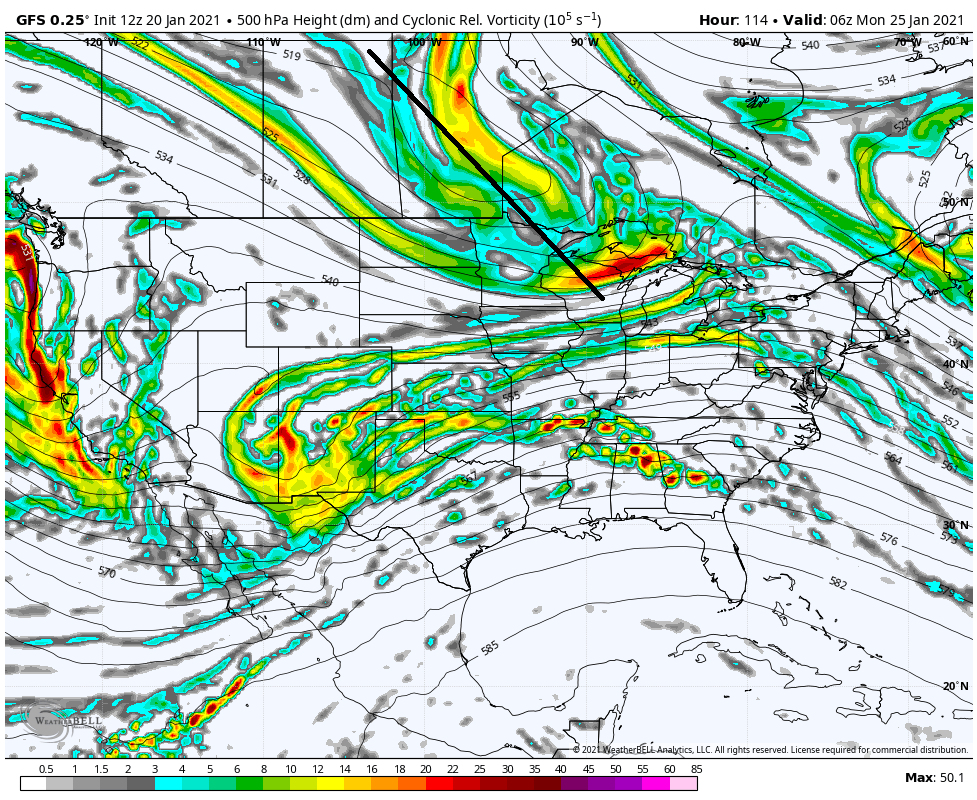
Can clearly see why the 12z ECMWF and GFS tracks are so wildly different.
GFS has the northern vort max much further south, which prevents the southern piece of energy from propagating northeast and picking up gulf moisture. Instead, the southern vort gets sheared out upon ejection from the four corners region. This is not the case on the ECMWF.
-
5
-
2
-
-
2 minutes ago, andyhb said:
IIRC didn't some of this get fixed in the most recent update of the GEFS? Or is that still associated with the v16 testing?
The recent GEFS update involved an increase in resolution (35 to 25 km) and in number of ensemble members (20 to 30). It also included the expansion into subseasonal (35 days) and better stochastic/other physics.
-
4
-
-
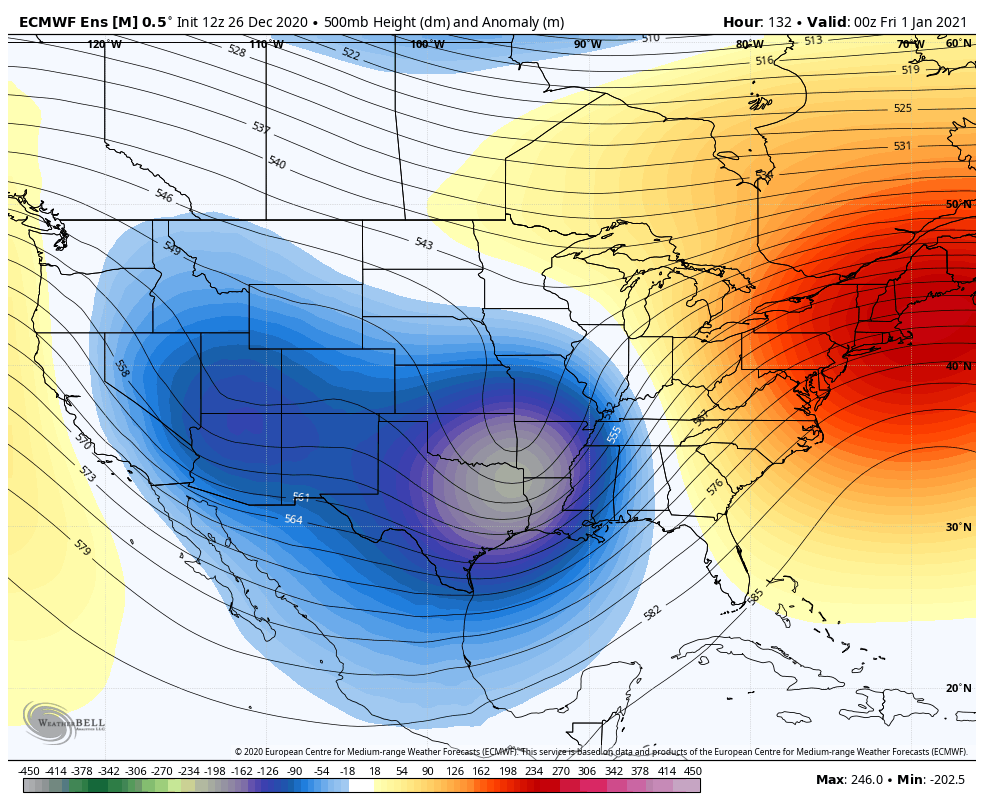
12z EPS low tracks

-
12z ECMWF came as a big surprise. Gonna need to analyze this system a bit deeper.
-
1
-
-
The northward propagation of the plains vort ejection is really being limited by the vortex over Northern Ontario which is being held in place by the west based -NAO.

-
1
-
-
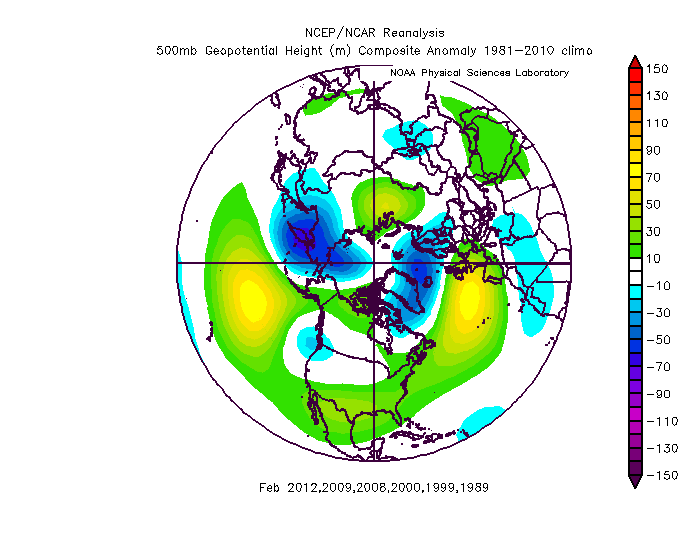
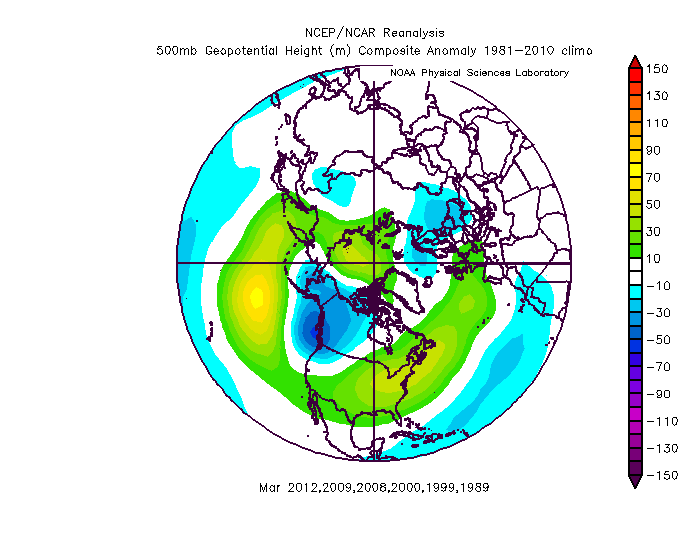
This years Nov-Dec MEIv2 came in at -1.2C. Oct-Dec ONI came in at -1.3C.
Below are February & March composites from the 6 years since 1979 with Nov-Dec MEIv2 between -1.0C & -1.5C. This gives a good idea of our current "base state" from ENSO... not accounting for any SSW impacts. Because the SSW has been impacting the polar height field (i.e via -AO/NAO) and will continue to do so, I don't think these are a perfect representation of what the overall pattern will look like. However... this 500mb look could certainly show up through the Feb-March period.
-
2
-
-
Impressive system. Snow has now started here in Toronto.

-
12z UKMET continues its trend of adjusting the vort max southeast
12z run (valid friday night)

0z run (same timeframe)
.thumb.png.f84b816b810104755151ed0dfe583a98.png)
-
1
-
-
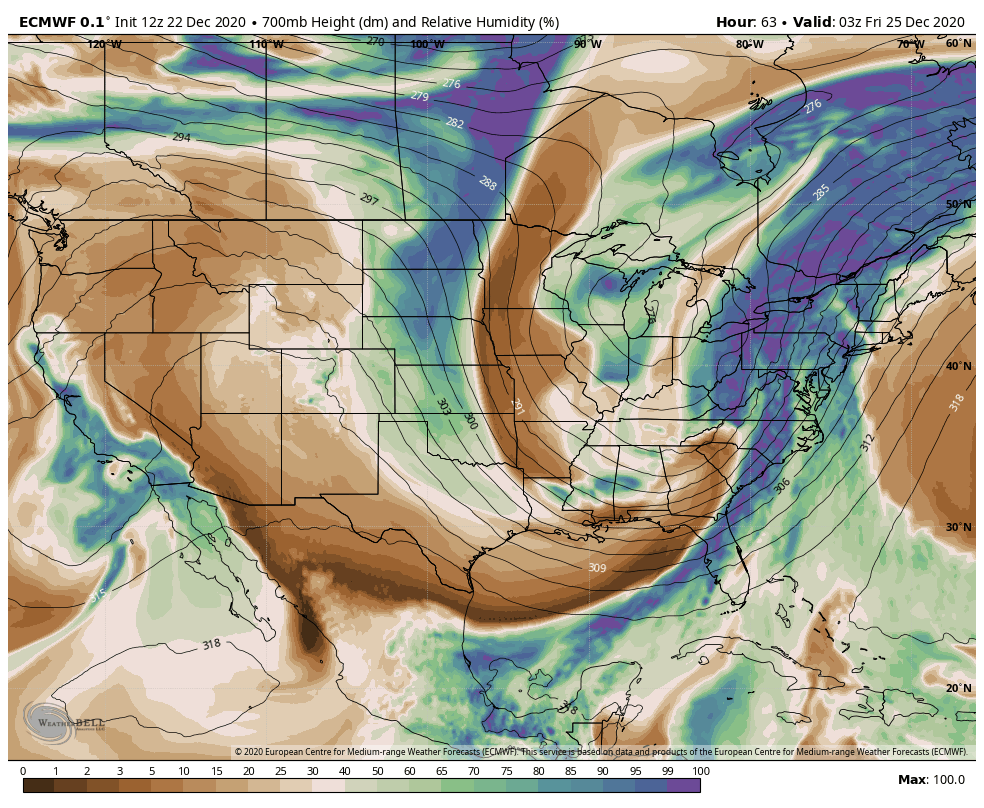
21 minutes ago, Chicago Storm said:
It’s not going to mean too much, given ample advection from the southwest.
Virga and top down saturation has already started into DVN and ILX CWA’s.Can see the elevated 700mb RH and frontogenesis moving ENE on mesoanalysis:


-
GEFS 8 run trend

-
6z EPS has a large cluster of tracks with a hard turn north out of the Gulf

-
1
-
-
6z GEFS
-
1
-
-
One of the main differences between the GFS & ECMWF relates to the confluence zone across Quebec. The ECMWF has a much stronger eastern ridge while the GFS has a weaker ridge and a confluence zone further south which keeps the GFS low track further southeast.
-
1
-
-
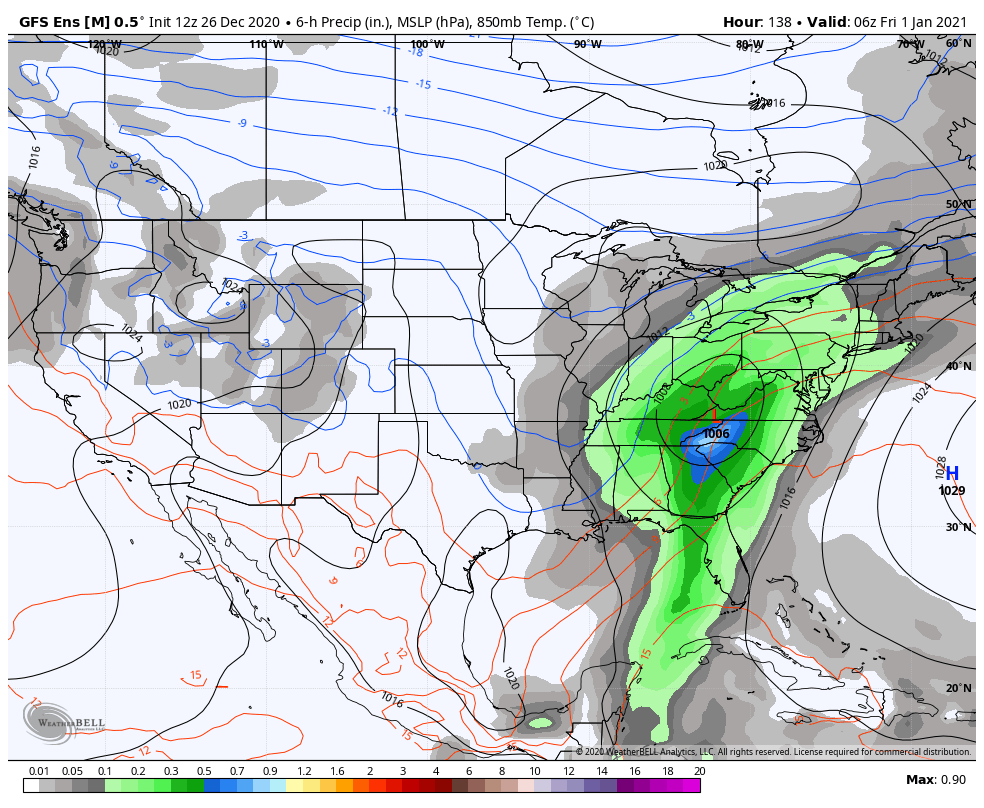
Can see the wide spread in GFS ensemble low tracks for the secondary low propagating out of the Gulf of Mexico. Spread is high in both track location and MSLP intensity.
-
1
-
-
Seeing a strong secondary low signal emerging out of the GOMEX on both the 12z GEFS and EPS. The GEFS has the trough axis and subsequent ejection further east relative to the EPS.
12z GEFS

12z EPS

-
2
-
1
-
-
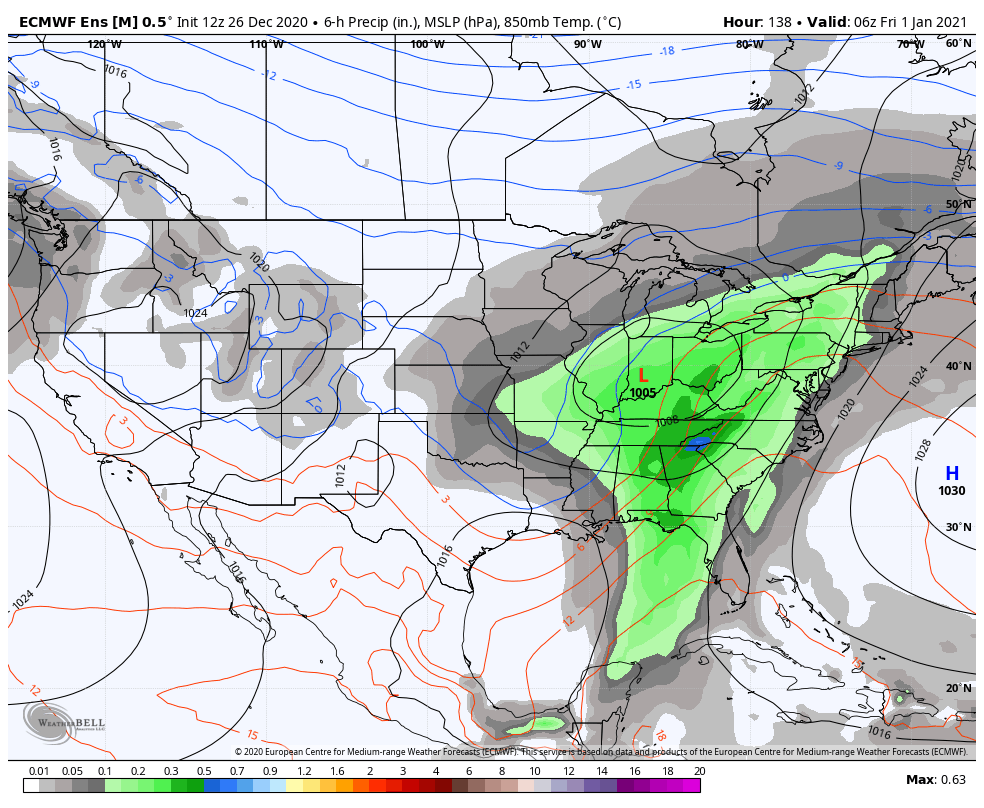
12z EPS MSLP tracks

-
Models have been consistent in showing good moisture transport from both the GOMEX and SE coast. Exact low track will be important for the GTA.

-
1
-
-
12z Canadian Ensemble Mean remains east of RGEM and GEM-GLB low tracks

-
1
-
-
ECMWF comparison (12z left vs. 0z right). Valid christmas eve.
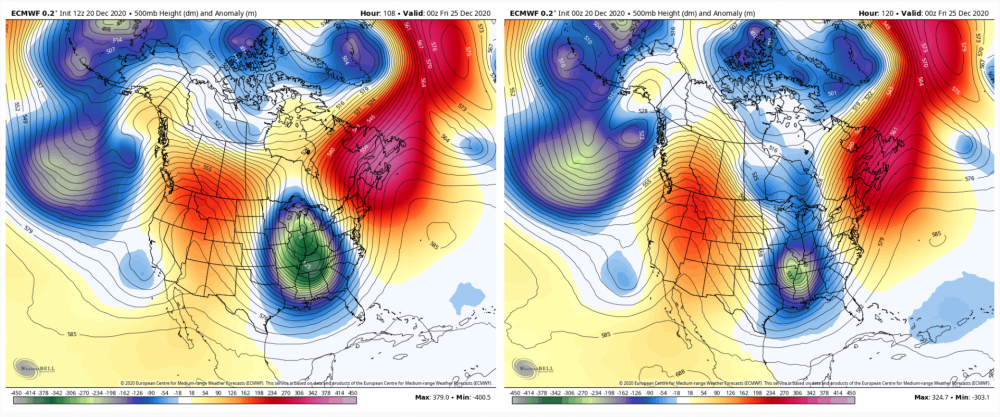


.png.29d5c1df2604a3bb694c401e499e3055.png)


Jan 24-26th Something Potential
in Lakes/Ohio Valley
Posted
The MSLP spread remains large