
Vergent
-
Posts
981 -
Joined
-
Last visited
Content Type
Profiles
Blogs
Forums
American Weather
Media Demo
Store
Gallery
Posts posted by Vergent
-
-
Vergent.....Reading through all this......could you please explain what your point on Methane is? In your own words.

Siberian Seas Seethe Swamp Smell
THIS IS NOT GOOD.
-
Vergent we agree to disagree on this subject, anymore arguing by either of us is futile. Do you agree?
agree
I will not respond to you on this and you will not respond to me.
-
The plume also expands wider as it moves farther away from the source.
Would this not dilute the methane? This is a 10,000 mile trip.
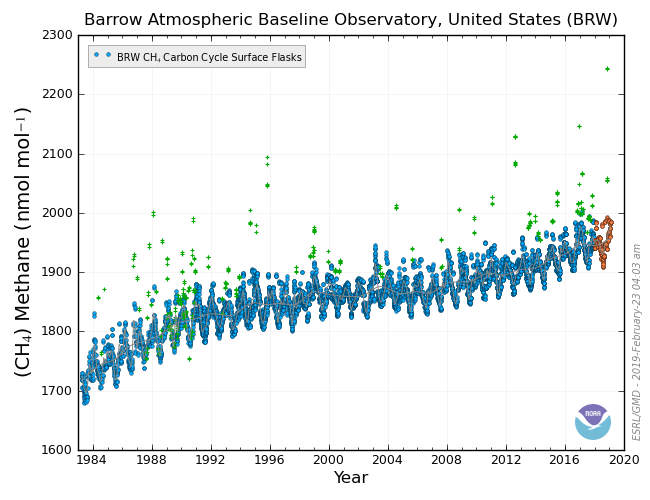
Wow, where to start? Why do you continue to use Barrow's false readings as an argument? The wind trajectories you posted don't even have the air moving over the arctic at all. California's rise in methane if accurate is no where near the extreme levels I objected to wrt Barrow's readings. I said show me another station with methane levels rising as sharply as Barrow's. The California one you posted is not even close and Barrows have not spiked at all recently. I think I'm done arguing with you. If you want to keep posting an erroneous graph from Barrow to prove your point, go ahead. Everyone who has read the thread knows they are inaccurate, all it does is cause you to lose credibility every time you post garbage. Methane levels are rising worldwide, to see a slightly higher than normal reading from a few months ago is not strange. The trend is up and we have set new methane records over and over again this is not a new development.
If methane were to spike as high as the Barrow one did before the correction then I would agree we have a serious issue. Right now we have a group of scientists with some data that has not even been written into a paper or peer reviewed yet. You are jumping the gun.
NOAA ESRL uses a 3-column quality control flag where each column
is defined as follows:
column 1 REJECTION flag. An alphanumeric other
than a period (.) in the FIRST column indicates
a sample with obvious problems during collection
or analysis. This measurement should not be interpreted.
column 2 SELECTION flag. An alphanumeric other than a
period (.) in the SECOND column indicates a sample
that is likely valid but does not meet selection
criteria determined by the goals of a particular
investigation.
column 3 COMMENT flag. An alphanumeric other than a period (.)
in the THIRD column provides additional information
about the collection or analysis of the sample.
ftp://ftp.cmdl.noaa.gov/ccg/ch4/flask/README_surface_flask_ch4.html
Judging from the data set
ftp://ftp.cmdl.noaa.gov/ccg/ch4/flask/event/ch4_brw_surface-flask_1_ccgg_event.txt
a single or a double high reading is flagged in column 1; bad data
A string of four or more high readings is usually flagged in column 2; valid but does not meet the selection criteria.
This data set they are trying to show the atmospheric baseline, short-term elevated values are tossed out of the graph, not the data set. I can guarantee that they are there, and they are probably flagged in the second column. This years data will be added to this data soon I hope.
But to call it bad data without knowing how the displayed data is selected is self imposed ignorance. So all the high readings we are seeing will probably be flagged, and furthermore there are probably many valid high readings that never get displayed at all.
-
Why do you keep asking for something you do not want?
Right now we have virtually no data about this new development and the study is not even complete and some folks are jumping off the deep end.
I'd like to see much more data
Those ridiculous C4 anomalies are not showing up on any other locations.
That's all fine and dandy, but you never answered my question. Why is Barrow the ONLY location reporting a major spike in CO2 and Methane? You just quoted this :
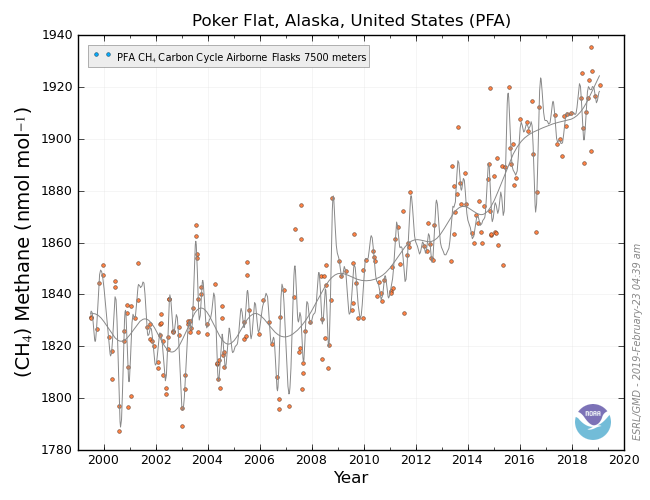
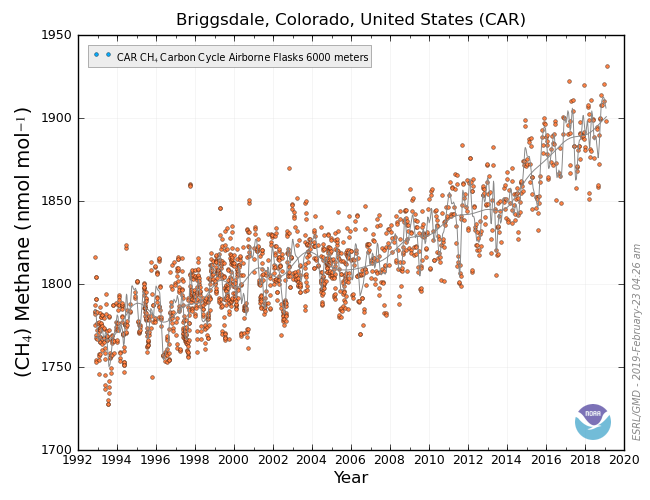
At the VERY least everyone should be very skeptical that the Barrow reading are accurate. There is no other station that shows even remotely the same reading. Give me even one more station reporting a rise in Methane like Barrow and then I'll believe.
If you can find another measurement that supports the readings in Barrow get back to me then.
It should not be that hard for other stations to be picking up on an extreme methane spike.
with the sheer scale and high density with thousands of plumes you would think another station would pick up on this.
if there are 1000's of plumes why is barrow the only station reporting a spike in methane. It just did not apply to my post and someone decided to post it thinking they were proving something which hey were not. I'm disengaging TerryM and Vergent over this subject, it's really stupid and until another station shows something like this I remain skeptical.
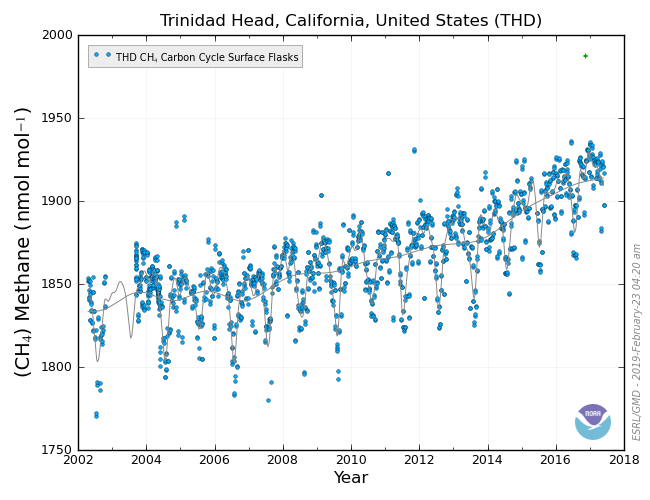

Then you ignore this, a methane spike in California that tracks back to the East Siberian upper atmosphere. Which suggests that the bulk of the methane is in the upper atmosphere. Something I and others suspected.
It is also detected at other stations, just whiffs, but highest on record.
Siberian Seas Seethe Swamp Smell
Here is the ESS boiling methane, above is the trajectory map that carries it to California where we get the highest methane measurement on record. Is the reality of the situation sinking in yet?
"Give me even one more station reporting a rise in Methane like Barrow and then I'll believe."
-
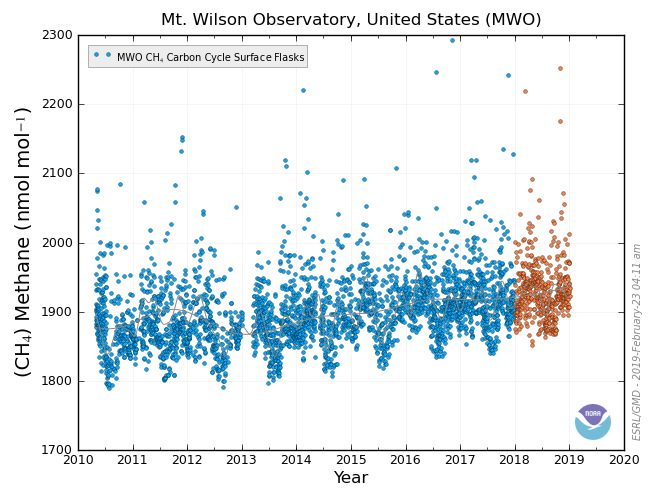
Multiple stations have had recent, all time high readings consistant with methane whiffs pulled south by the jet stream. The Trinidad Head trajectory suggests that the methane vented to the stratosphere.
-
Why did you decide that a topic about methane venting in the arctic was about you? Or your guru?
Are you saying " Roy Spencer invented an imaginary paper to decieve the public, thats on him, not me."
To the general public this process is called deprogramming.
-
I don't know where it is because I haven't looked. I quoted Spencer's reference to the paper, thats all, and he is not going to blatantly make up a paper with his colleague as the Author.
I don't even know why you even want the paper given it is not relavent to my thread, let alone me finding it for you.
If Roy Spencer invented an imaginary paper to decieve the public, thats on him, not me.
Why did you decide that a topic about methane venting in the arctic was about you? Or your guru?
Are you saying " Roy Spencer invented an imaginary paper to decieve the public, thats on him, not me."
-
???
You said I made up Christy et al 2011, I just proved you wrong, in showing you that Roy Spencer referenced it.
How is that a fail on my part?
Where is the link? You, as a scientist must always check your references. Even if it is your guru.
"Of course I never defy science"
Please, the subject is arctic methane venting. the 5049 people who have viewed this topic, are interested in this topic. Not what tin foil to wear as a hat
-
Another link to "fundanomics the free market simplified"
This is spam
-
You claimed that there is new peer-reviewed literature - none of the papers Dr Spencer referenced are new. So you still haven't backed up your assertion. Another FAIL on your part. And failing to produce data to back up an assertion is certainly defying the scientific method.
Thank you for your support.
-
Please, the subject is arctic methane venting. the 5049 people who have viewed this topic, are interested in this topic. Not what tin foil to wear as a hat.
-
You know what here you go since you're having trouble:
So, the model vs. observational issue was not presented accurately in the post. This has been addressed in the peer reviewed literature by us and others (Christy et al. 2007, 2010, 2011, McKitrick et al. 2010, Klotzbach et al. 2009, 2010.)
It kind of looks like a link, but you click on it, and nothing happens.
-
You took it off topic, not me (accused me of making up a paper) So you did cannot find Spencer's reference on his blog? I'll post it here for all to see if you can't find it.
can you find methane in this post?
"Of course I never defy science, you're the one who has breached the scientific method, not me.
I think you'll find very shortly that your side is wrong. We'll see. "
This post is about you is it not? So, posting about you is the new topic. Is it not? So, now You making up fake references is fair game. You made the topic you. "I never defy science" is a statement of fact or falsehood.
"New peer reviewed literature by John Christy and Roy Spencer completely address the ongoing incorrect assertions regarding the UAH dataset, latest in Christy et al 2011"
This is a post you made. Back it up with a link.
-
I don't know what he thinks about methane leaking. I don't think much of it.
Then quit blowing methane on my topic.
By the way the "copy-paste and link it here for you." did not work.
More methane.
-
Which I didn't, and niether did Roy Spencer in his reference. More BS as usual.
Can it for your sake.
all I get when I google "Christy et al 2011" is:
FUNDANOMICS: The Free Market, Simplified
Is this the Spencer you are talking about? Is this your guru?
What does he have to say about methane venting in the arctic?
-
Of course I never defy science
Except when you make it up.
"New peer reviewed literature by John Christy and Roy Spencer completely address the ongoing incorrect assertions regarding the UAH dataset, latest in Christy et al 2011"
-
Siberian Seas Seethe
(Alliteration Always Advances An Agenda)
okay,
"Siberian Seas Seethe Swamp Smell", it is
But, what about;
"Arctic Ass Airing Ardently"
-
Someone, please help BB with his socks.
-
The jet stream may be bring down whiffs
-
Both articles quoted
Tim Minshall saying that "T
he last time, when methane was raised in huge quantities on the surface planet Earth is just coming out of the last ice age about 15,000 years ago."
Would he be referring to the end of the Younger Dryas, when IIRC Greenland experienced a 10C raise in a 10 year period?
I suppose so.
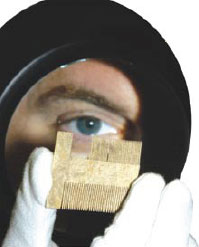
By the way, does "vast area of ocean boiling with methane" sound like an appropriate caption for that picture?
-
I found this picture by searching in Russian.
Siberian Seas Seethe Swamp Smell
-
Here is a reassuring article. It quotes some very respectable climatologists that say basically that since the clathrate gun hasn't gone off in the last 800.000 years it must be impossible. There is one problem with this reasoning. Which year in the past 800,000 years is comparable to the present?
http://dotearth.blogs.nytimes.com/2011/12/28/more-views-on-global-warmin-and-arctic-methane/

The GHG forcing in the present is significantly stronger than anytime in the past 800,000 years. The the important thing with methane release is the rate of release, because of the short half life in the atmosphere.
On the one hand the theoretical scientists are saying "its impossible", on the other hand the field scientists are saying "its happening"
-
Why do you keep posting that map? It makes no sense to the discussion. What determines the starting point? do you really think that the wind stream is only as wide as the lines? Why is elevation changing with the days? What does this map prove in terms of how wide a plume is or how many there are or well anything related to this discussion? Explain your map other than just saying wind trajectories, because that simply does not make sense at all.
As was posted above by Terym this map is the backtrack of the air that was sampled on that day. It is where the air came from.
He also gave this link
http://www.esrl.noaa.gov/gmd/ozwv/traj.html
Please read the thread before posting.
-
The plume also expands wider as it moves farther away from the source. Also according to an article you quoted there should be thousands of those plumes in the arctic. It should not be that hard for other stations to be picking up on an extreme methane spike.
A 10,000 km^2 area is only 100 km wide.

Even if it 150 km wide, after it crosses the arctic ocean, it still takes some luck to hit one of the three arctic stations.
This is not good.
in Climate Change
Posted
This question deserves a more thorough answer than I gave above. There are peer reviewed papers both showing that a massive methane release is possible and not. But observation trumps theory, and the reported increase suggests that the arguments that is impossible are false. This is probably because they had the wrong thawing point for the sediments. The reports are from credible sources, people that have been studding these deposits for decades, they have many highly cited papers to their credit.
The question of why we are not detecting the methane is a red herring. Methane spikes are weeded out of the displayed data(flagged in the data set) even when they are believed to be accurate, because the purpose of this data set is to track global methane and they do not want their figures inflated by transient local releases. We will have to wait for this years data to be published to analyse the flagged data. Eventually this methane will become well mixed and we can then quantify it.
The are ways to stop this process. 1/3 of the arctic ice melt each summer is caused by the warm Pacific water that enters through the Bering Strait. Russia has green lighted a RR tunnel across the strait. If instead we built a bridge with flood gates to modulate the flow, this alone would be enough to reverse the ice loss in the western arctic.
http://psc.apl.washington.edu/HLD/Bstrait/BS2007Heat.html
Its not so deep, so large spans could be landfill with gated gaps.
Further it would pay for itself as a railroad link between the Asian manufacturers and the west.
Building the railroad and the bridge/dam would probably get the world economy out of the doldrums.