
Vergent
-
Posts
981 -
Joined
-
Last visited
Content Type
Profiles
Blogs
Forums
American Weather
Media Demo
Store
Gallery
Posts posted by Vergent
-
-
Oh I know the arctic deep hasn't warmed ever. And it still hasn't. 300-400m is not the arctic deep.
What's with all the apples to oranges comparisons today?
Do you have any evidence that large warming influxes have not occurred at 300-400m before? I highly doubt AGW is responsible for a 6-7C anomaly at 300m deep. Sounds more like an ocean current thing. But if you have any evidence to the contrary that would be much appreciated.
And I would still like the link to the lovely images you have been providing us, if you don't mind.
http://data.ncof.co....MS/godiva2.html
I have given the link several times now.
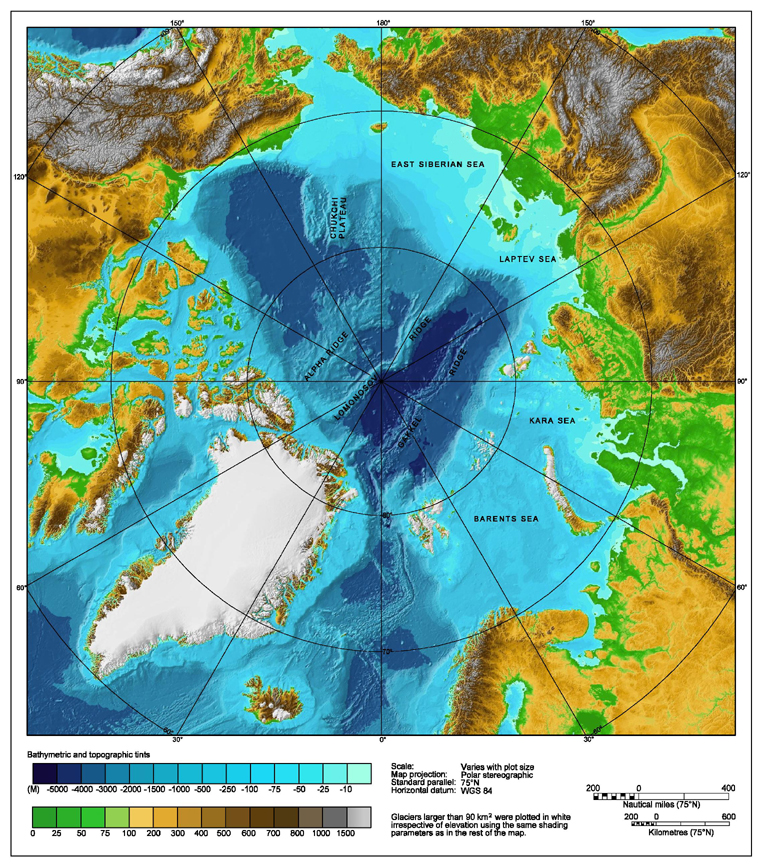
Unlike tropical oceans, which are temperature-stratified (i.e. there is a thermocline), the Arctic Ocean is salinity-stratified, although at high latitudes the ocean is much less stable. The temperature profile is nearly uniform at 0 to 1C in the Arctic Ocean,
http://www-das.uwyo....p17/arctic.html
If you can find anything from the past that says anything different, show me. The anomaly is because the ice melted back to the Arctic basin allowing the gulf stream to flow in(the ice and meltwaters cause it to sink and underturn and go south)
Negative feedback would be nice but the winds are blowing N Atlantic water into the arctic ocean. This will increase the Fram outflow....Also, we would be trading new ice for old....
You see that back in early August I was expecting an inrush of Atlantic water into the arctic. This was because of the arctic storm and the melt back of the ice. Because I was expecting it, I was looking at the temperatures at depth in the arctic. It does not seem that anyone else has discovered this yet.
-
Also the fact that we're talking about anomalies of 5C+ suggests to me that we're talking more about a naturally occurring event than AGW. The globe hasn't warmed 5C in the last 4 years. Even the arctic hasn't warmed anywhere near 5C in the last 4 years.
Skier,
the arctic deep has not changed 1C in the last 60 years. Until now. Now when things are changing rapidly +7C, you want to cling to past stability? Really? Well I guess you are just going to make up your own reality.

Tis is the now reality.
-
Correct me if I'm wrong but aren't the plumes of methane coming from the ESB and Laptev from depths of less than 300m.
Again all your maths show pretty cool water along the edges where the water would actually be in reasonably close proximity to the sea floor.
Yes those plumes are from deep in the sediment of shallower water. From 300m down they can form at the surface, in direct contact with the water. In shallower water, they require enough sediment to create the same pressure.

At 300m methane hydrates have a melting point of 0C, while the water 2-3C that has reached the continental shelf is "cool" it is a destabilizing temperature. I showed the 2010 maps to show that the temps in the past were much more stable. this graph is not representing the arctic, the thermal gradient is wrong.
-
The maps you posted don't cover any of the continental shelves. Maybe a little bit of the CA, but the waters off the CA are 500m+ deep and the warming at 300 and 400m is fairly moderate.
How about posting some 200m maps that include the continental shelves or providing us the link so we can check ourselves?
(Third time I've asked!)
The white area is the continental shelf at this depth. The shallower depths cant have hydrates except deep under sediments.
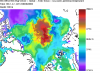
There are no surface hydrates, so rapid destabilization is improbable, unless there is a landslide that uncovers them.
-
Lol somebody gets it! Too bad Vergent is too busy insulting me and pretending to be smart to use his brain and read.

Skier,
Are you blind, while the warmest is in the middle, the warming reaches vast expanses of the continental shelves. Go back to the stability graph. 2C will destablize hydrates at this depth.
-
You posted images of warming at 300m-400m when in reality your warming area is some of the deepest areas in the arctic that is his point.
It accumulates in the middle, then it spreads out. It has made significant advances in just 3 months. When will it get there? This winter, maybe. Next year when it gets another gush of Gulf Stream water, probably. But at this rate of advance we are not talking decades.
edit;
Significantly warmed 2-3C water has already reaches the continental shelves of Greenland, Siberia, the CA, and there is a patch on the Scandinavian CS. While the worst of it is still a ways off, the warming has already begun.
-
Your point was that warming was going to cause methane release. The area of warming you showed was at 300m and 400m but the depth of the ocean in that same area is 3000m. That means that the warming is 2600-2700m from the bottom of the ocean. How can warming 2700m above the ocean floor causing methane release on the ocean floor?
http://scitechdaily....ound-in-arctic/
http://marine.usgs.g...ates/title.html
There are significant methane hydrates in the 300-400m depths of the arctic, on the slopes of the continental shelves.
edit;
Every time I post you make up numbers and contradict me.
Just how long did it take me to find references for the depths of the hydrates? About 30 seconds. Try using google and google scholar. Stop making up numbers to suit your purpose.
-
That's very interesting. So are global methane levels expected to rise dramatically soon? I saw a talk on climate change recently by Dr. Dressler and he stated that methane levels have risen sharply over the past 100 years or so but have stabilized (for now) and we don't quite understand all the processes that govern its atmospheric concentrations. He did not focus on this much. It was more of a sidebar in his talk.
I don't know if anyone else has factored in this huge influx of heat into the arctic basin. I have not read anything about it anywhere. I found it only because I was expecting it. In the past these depths did nothing year round, so I guess no one else bothers to look.
-
Fortunately the area of the ocean that shows warming is 3000m deep so there are another 2700m to go.
The warmed area is between 400m to 0m depth so I don't know what you are talking about.
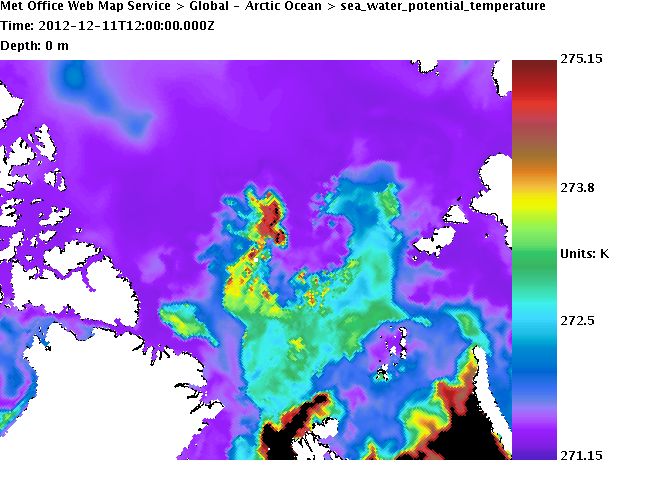
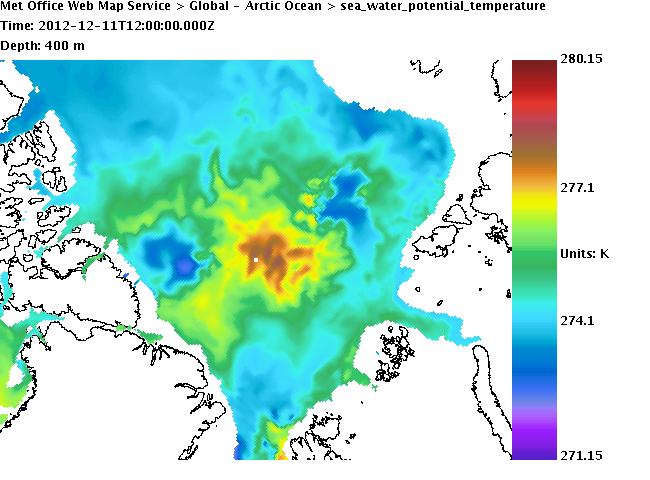
New scale -2C - +2C
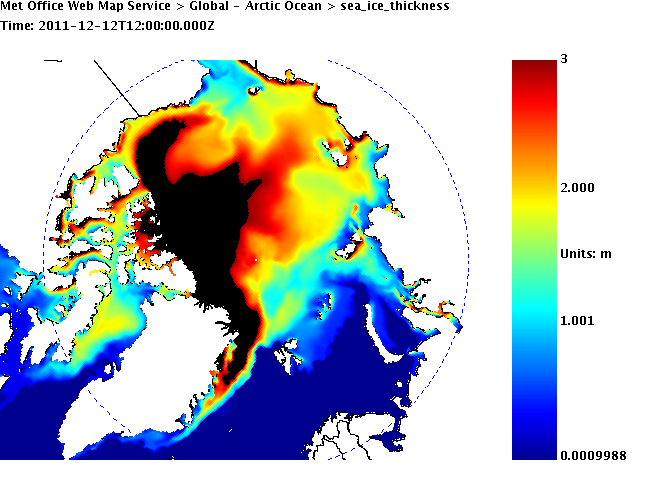
This is the new mechanism for ice loss convection of warm water from depth. Here is thickness a year ago:

This convection is torching a huge area and thinned it by 0.5m - 2m or more at N.E. Greenland. Its quit alarming 0.47m at 88.7N. It has lost at least 500 km3 on the Atlantic side through a combination of melting and failure to thicken.
-

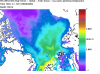
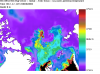
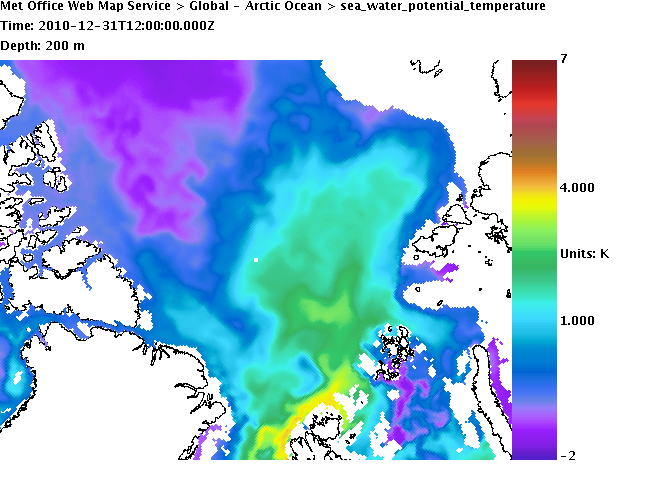
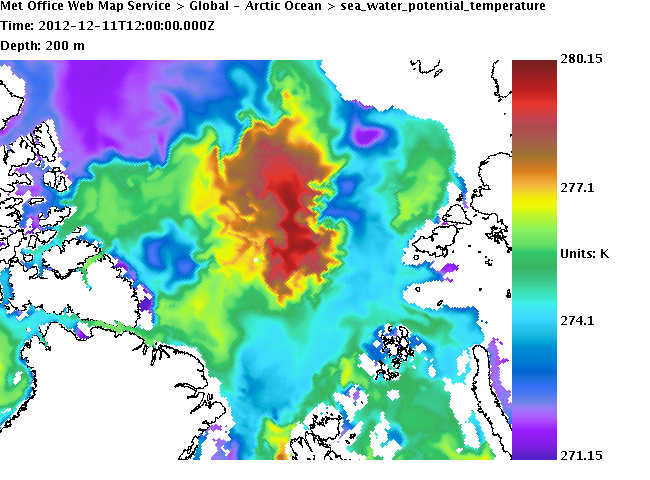
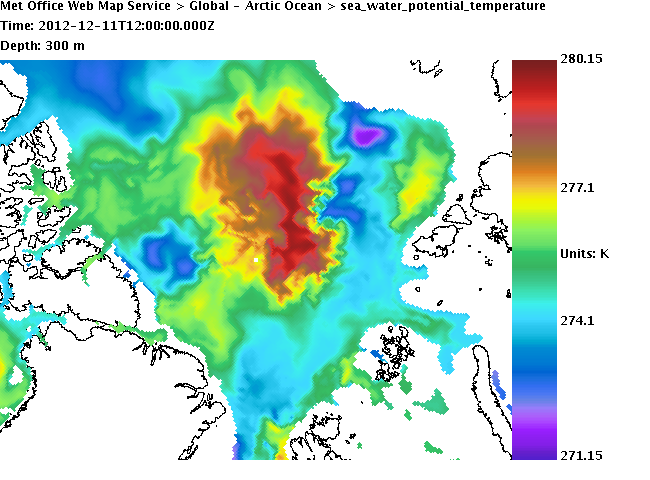
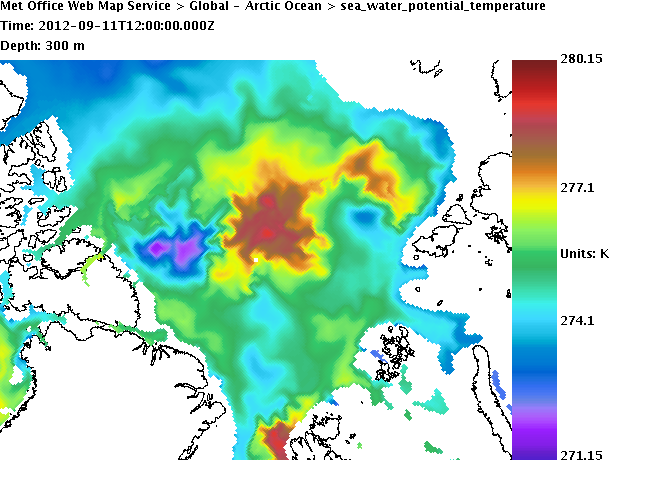
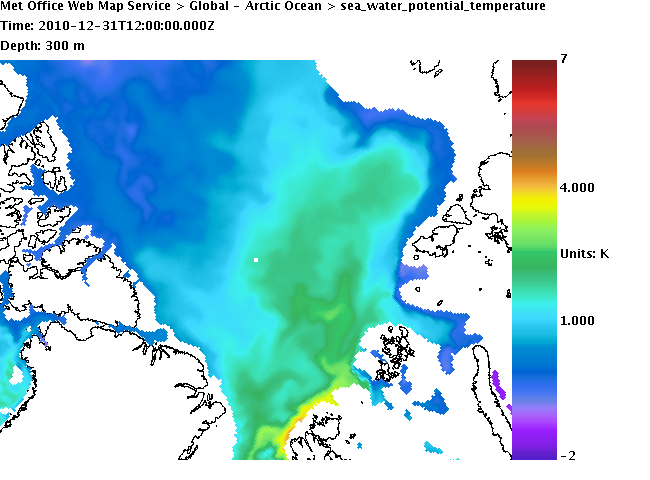
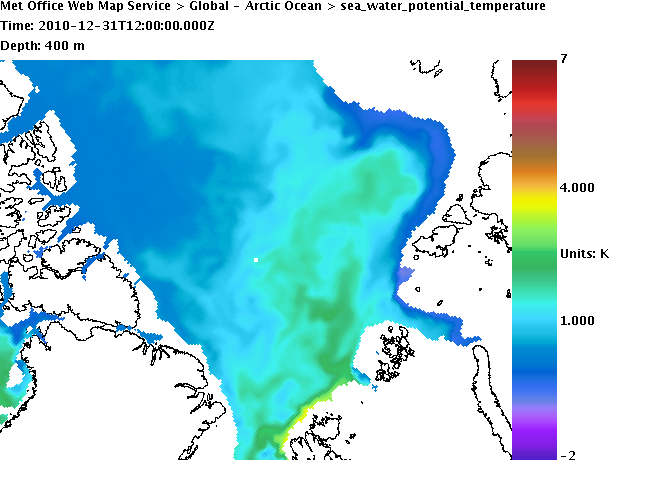
This is the Arctic ocean temperature at hydrate depth two years ago.

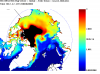
Here is the same depth today(the scale is the same the data for today is kelvin two years ago, centigrade).
In the arctic the hydrates should start just below the 300 meter level due to the 1-2C temperatures.
The heat influx is getting down to the 400 meter level, where there are definitely hydrates.
-
Maybe I am sticking my head in where it does not belong(yeah...probably) as I am NOT an expert on methane and this subject matter. So I am all ears here. My question is: weren't summers warmer in the Arctic during the Holocene Climatic Optimum 6-8 thousand YBP? This is what was in my climo course in 2008 so if it has been refuted over the past 4-5 years then fine. Please give me the reference. But if it still holds, is there evidence of excessive methane leaks in any kind of paleo data from this time period? That would be interesting because the climate did not warm much more and in fact cooled after this, as orbital parameters began to look more like what we have today. Also it was postulated during this time period that summer sea ice probably melted away and was seasonal. Polar bears still survived. The orbital variations (I believe precessional tilt) were favoring higher summer temperatures in the Arctic and NH 6-8K YBP. My point is that we may be looking at natural variations from a warming climate which are always exaggerated in the NH polar regions. That is a paleoclimatology fact. So any warming trend will be much higher in the NH polar regions and there is some breaking mechanism (unknown) that slow or negates the trend in methane releases. The earth has warmed rapidly in the past and the methane "death spiral" did not occur.
6-8k years ago the oceans were still rising, and had been for 5k years(at a much faster rate). This gives little time for shallow hydrate formation, and the rising ocean stabilizes the deeper hydrates.
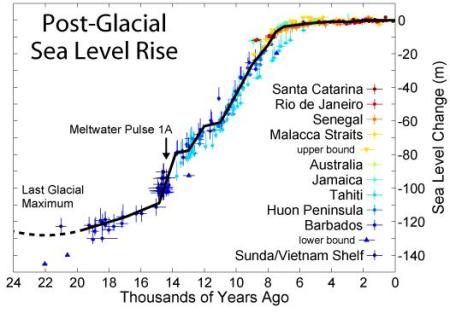
edit: That is to say the top of the hydrate stability zone(where it is relatively easy to destabilize), would have hardly any hydrates to destabilize.
-
Scientists Close in on the Cause of Arctic Methane Leaks
http://www.climatecentral.org/news/scientists-close-in-on-the-cause-of-arctic-methane-leaks-15090/
-
Doesn't methane break down in 10yrs in the atmosphere?
Yes, but its lifetime is concentration dependent, the more there is, the longer it lasts. Methane in the upper atmosphere protects the methane below.
There is an online model available here.
http://forecast.uchi...ts/methane.html
Edit: graphs were not showing up
-
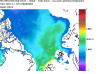
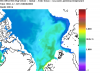
This is today
This is a year ago. You can see there was already activity a year ago. You have to like the trend.
-
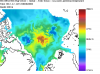
Giovanni CH4 these are uncalibrated so the raw numbers are invalid, but hot spots should show up.
No hotspot in the ESAS.
-

The high insolation bleaches it out at a faster rate that the emission rate so far. which is not bad.
-
Look at this article that appeared in Der Spiegel in May 2007. It makes many of the same claims that I did. I was aware of this article back in 2007, but I dismissed it at the time. Granted, there are a few erroneous claims in the article; for instance, the claim that Antarctica is gaining mass is now known to be incorrect, but there were a couple of studies in 2006 that said the same. But looking back at the paleoclimatic reconstructions and computer model projections, it's spot on. Why are we always told that the Sahel is becoming drier and the poor Africans are dying when, in reality, it's America that will become hotter & drier due to climate change?
That's a question for Rush, Rupert, or the Koch brothers.
-
Well stated opinion, but here is another well stated opinion:
#3 It's not bad
-
I suppose it was..........but telling us collectively that stopping AGW is not worth redirecting economic activity (especially when such redirection is an economic PLUS) is outrageously counter to the facts (in a rather Rush - ite way) - and did rather invite derision.
Mea culpa then........I maintain that your opinion as stated is factually without support and logically flawed, but I take back implications that you are unfit to discuss the point.
BTW - its "futile", not "feudal"
Freudian slip?
-
Maybe I'll get some insight on this at some point. Off hand I'd suggest that before going too far with the conspiracy theories there have been lots of issues with budget cuts in our lab. It would be interesting though to find out the rationale for the details of these cuts. Additional email inquiries might be useful potentially as well.
They already have the equipment. The system is automated. It only takes minutes to calibrate and do quality control. What are they saving on? The electric bill?
-
When governments chose to hide the data, it's hard not to assume the worst.
Terry
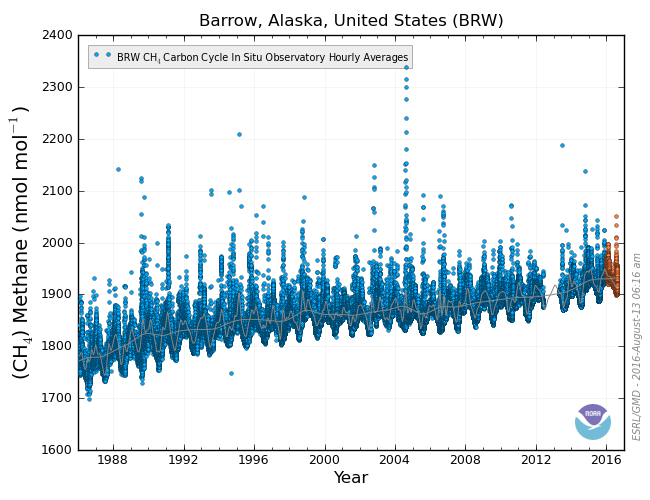
This is particularly true when they shut it down just after getting the highest readings in twenty years.
-
-
Scientists Defending Against The Methane Bomb
http://www.climatecentral.org/news/scientists-defending-against-the-methane-bomb//
-
Yurganov is working on a paper on arctic methane that concludes:
The main conclusion of this paper is a detection of high and growing with years methane mixing ratios
in areas coinciding with predicted locations of methane hydrates. According to the satellite data this
emission was small before 2008.
It can be found here.
ftp://asl.umbc.edu/pub/yurganov/methane/draft/paperArcticV2.pdf
Warning this site can be slow it took me many tries.
edit= typo


This is not good.
in Climate Change
Posted
No, it hasn't been above 2C in quite some time. AMO haha