
Snow_Miser
-
Posts
4,653 -
Joined
-
Last visited
Content Type
Profiles
Blogs
Forums
American Weather
Media Demo
Store
Gallery
Posts posted by Snow_Miser
-
-
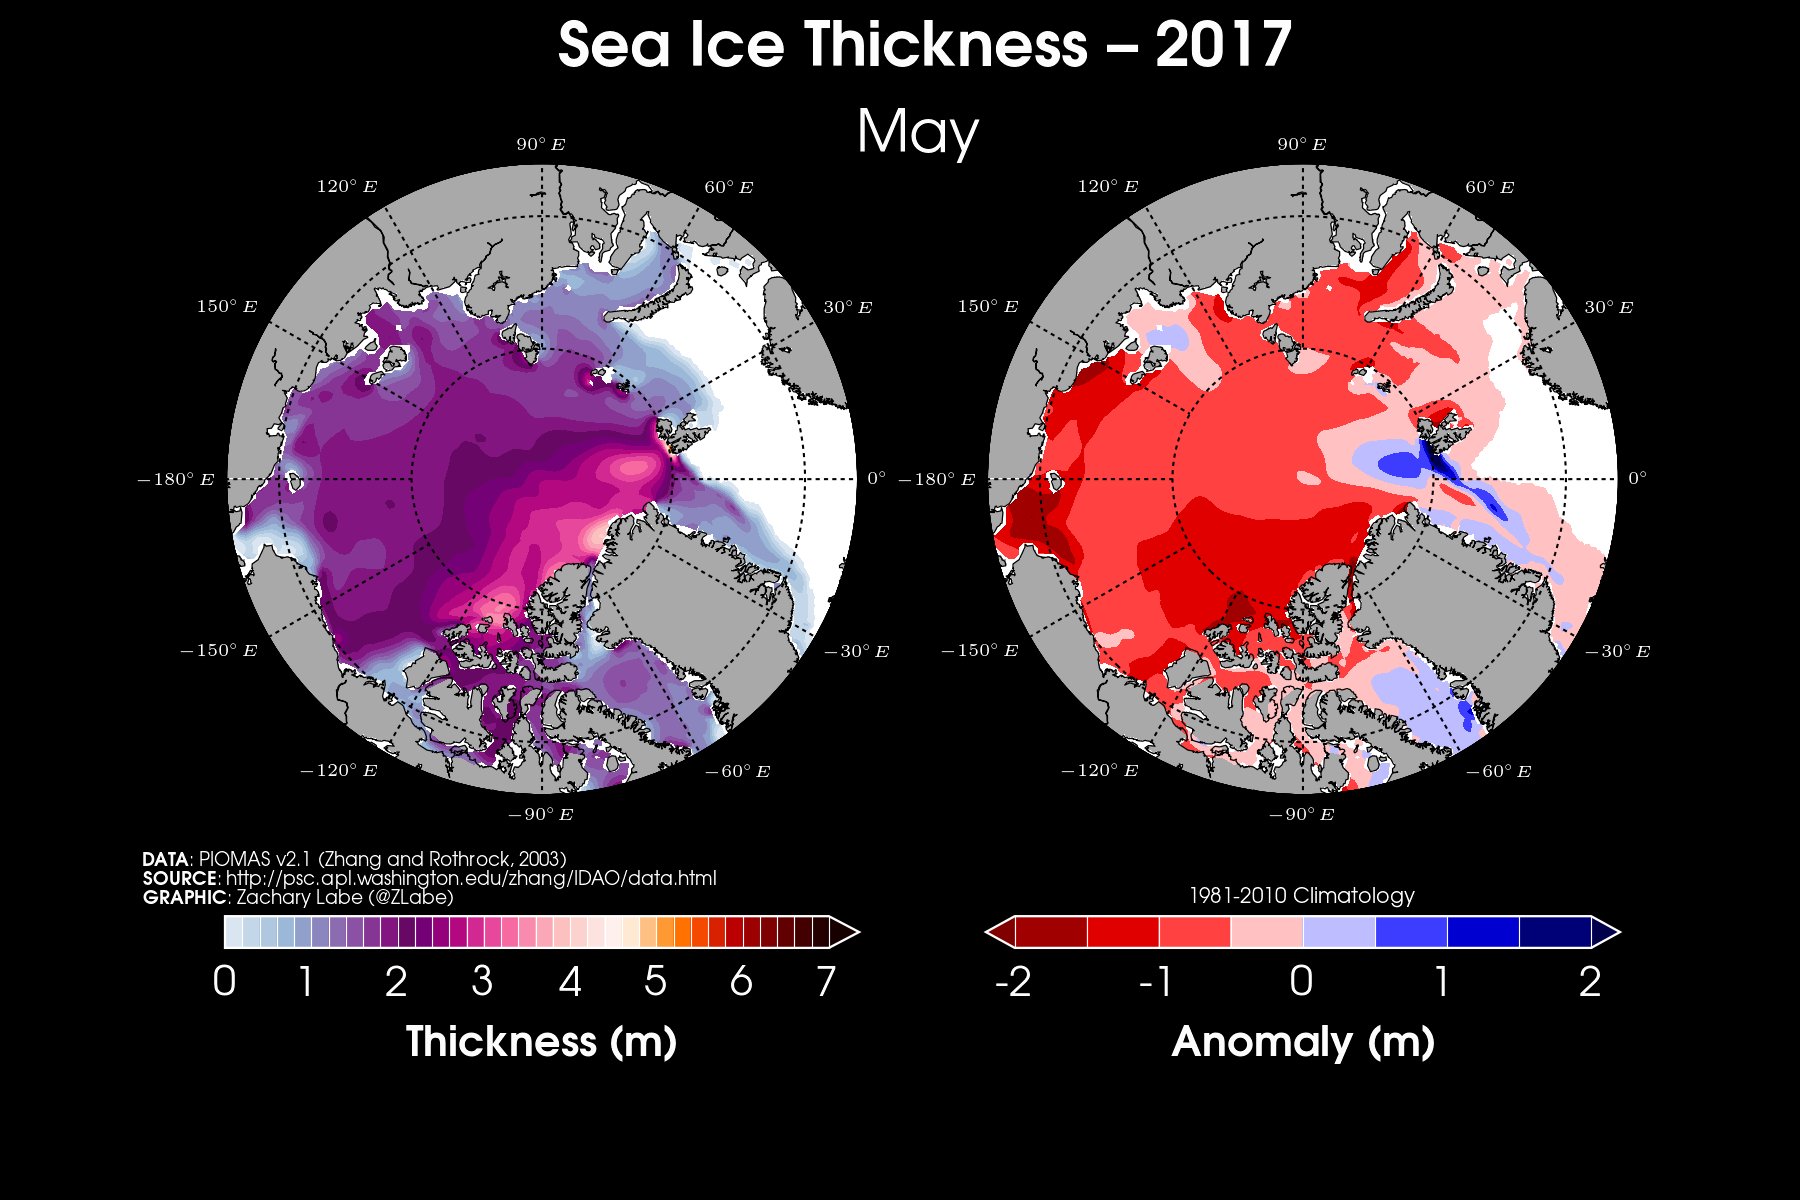
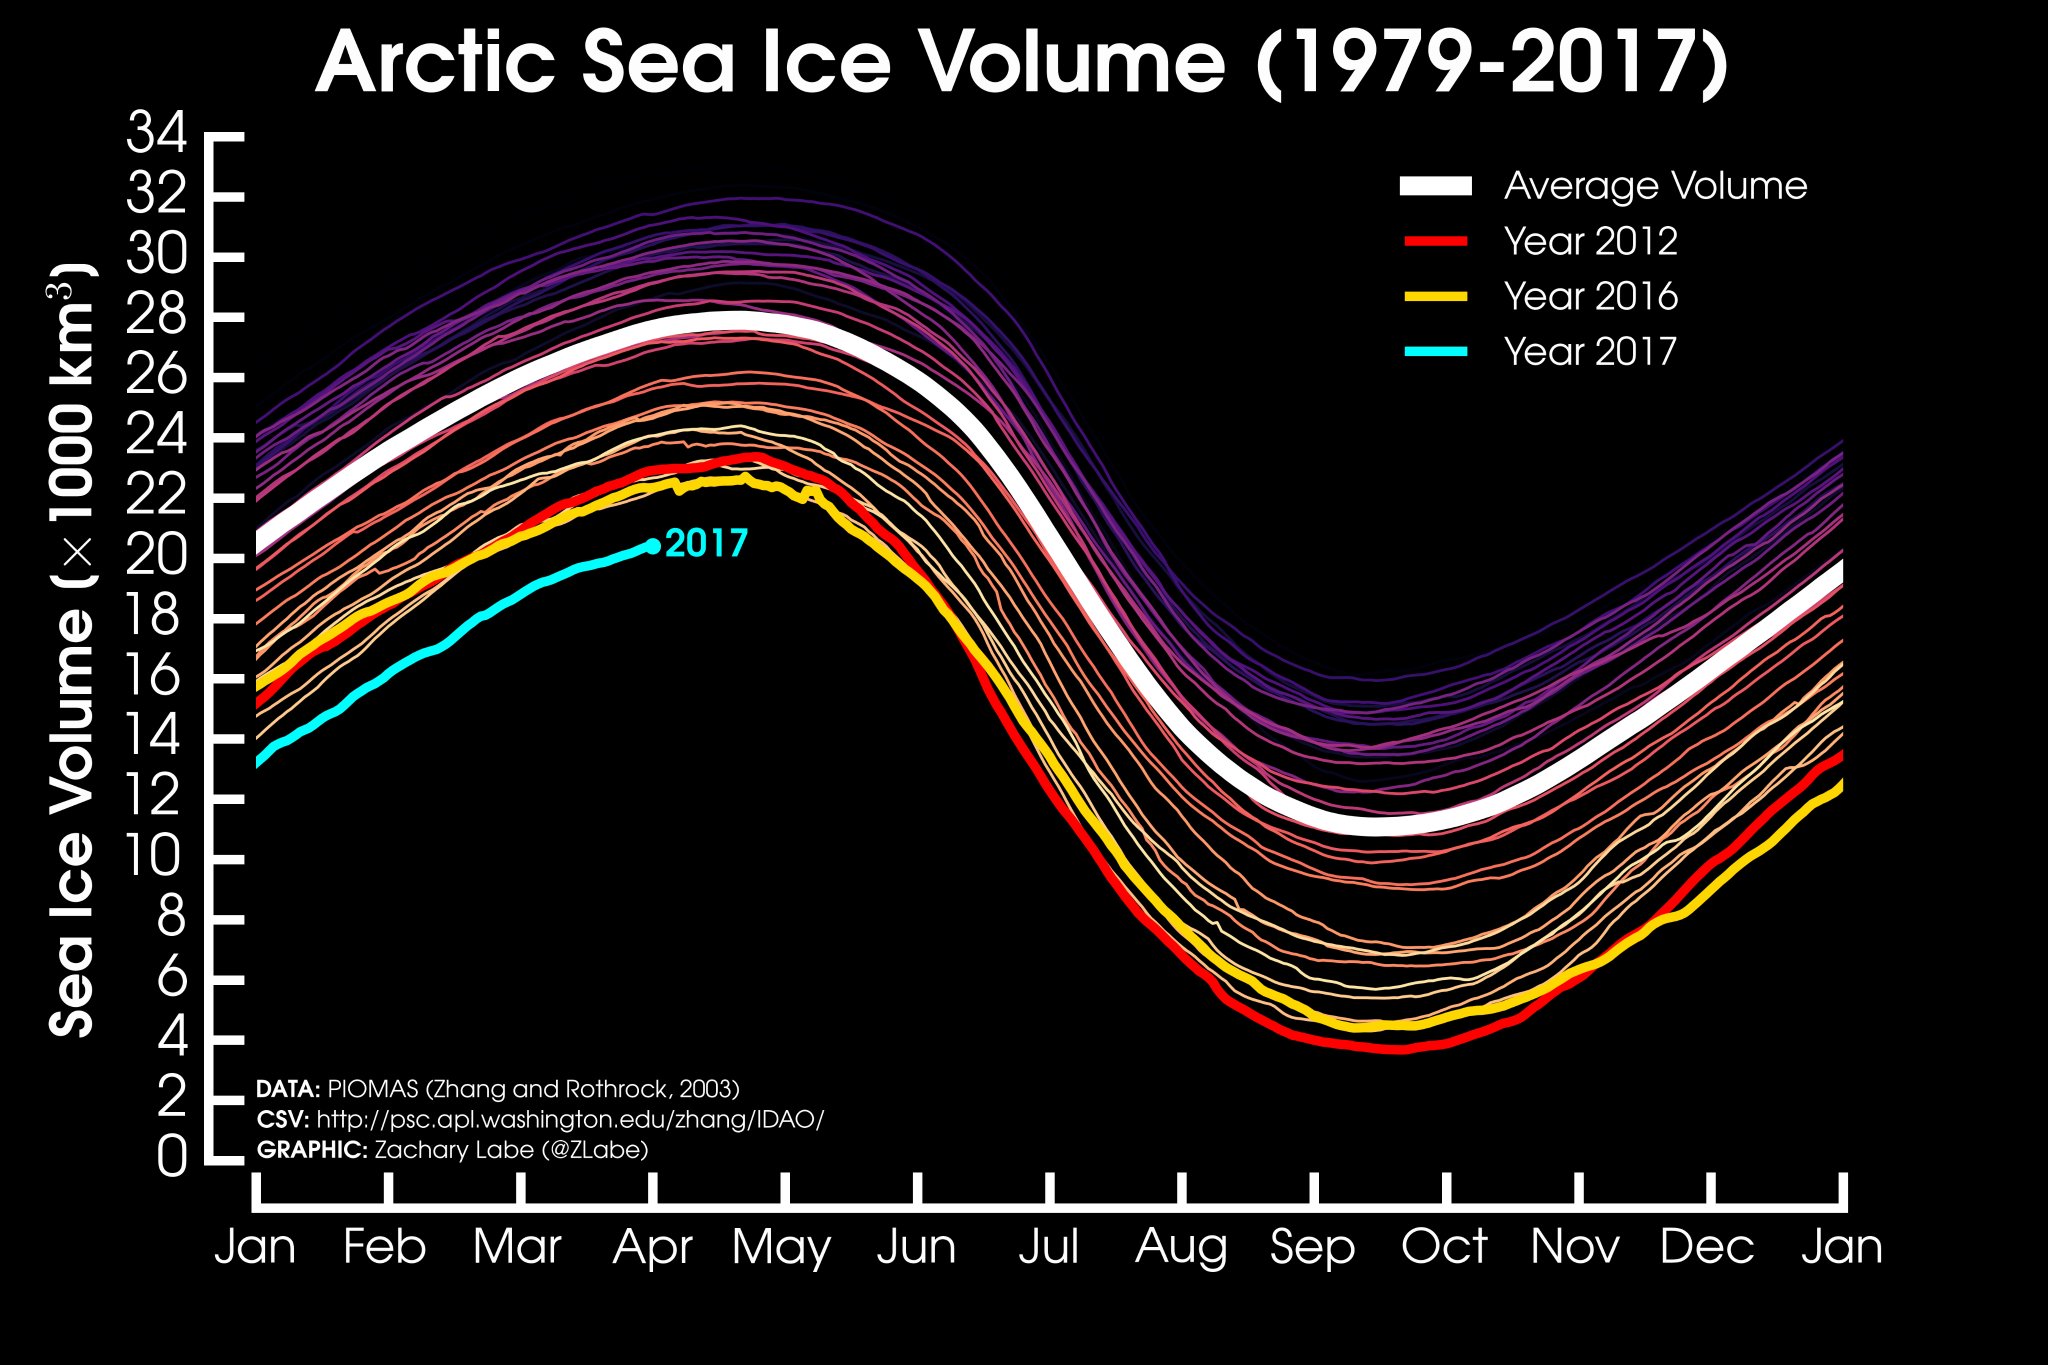
The higher thicknesses relative to normal are getting exported in the Fram, according to the May PIOMAS update. Across the Arctic Basin, lots of thinner than normal ice.

From Zack Labe.
-
-
5 hours ago, The_Global_Warmer said:
Compare to other years.
The Pacific side is a joke.
Going to take 2013 or 1996 weather to prevent a top 3.
And that's not guaranteed.
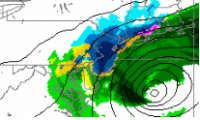
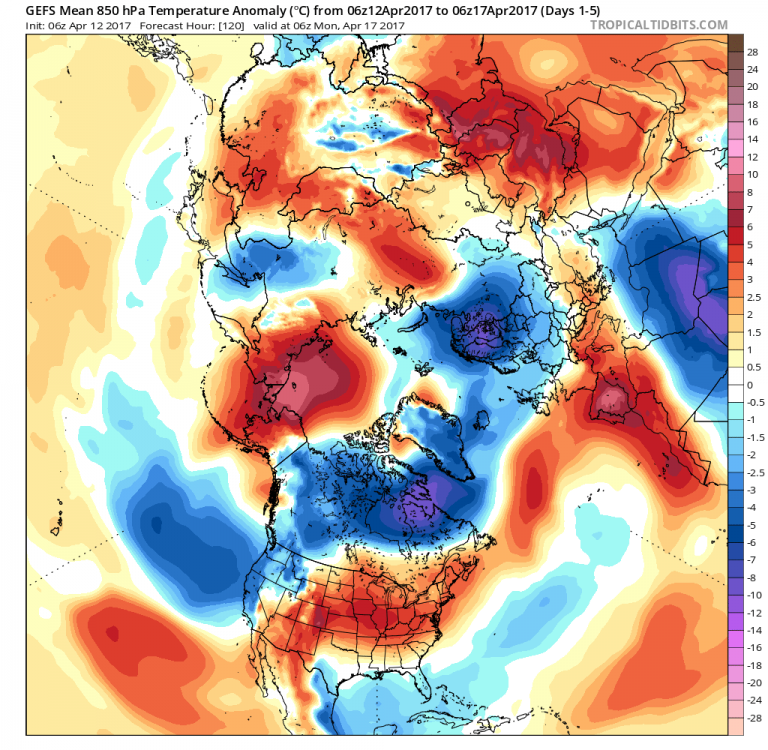
Nice dipole underway with ridiculous heights this week as well.
Welcome back Friv.
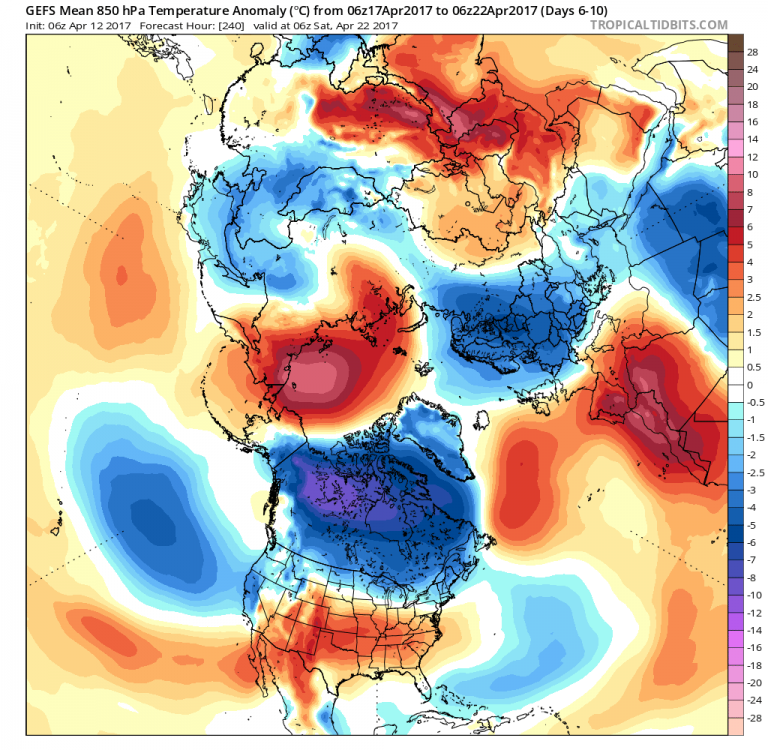
Not a pretty depiction by ensemble forecasts over the next 10 days for the Pacific side.
-
Record low volume continued into March. It would be impressive at this point if September also did not see record low volume.

-
Loss of -12K yesterday on NSIDC. With an unfavorable pattern for ice growth persisting, I don't expect significant ice growth for at least another couple days.
-
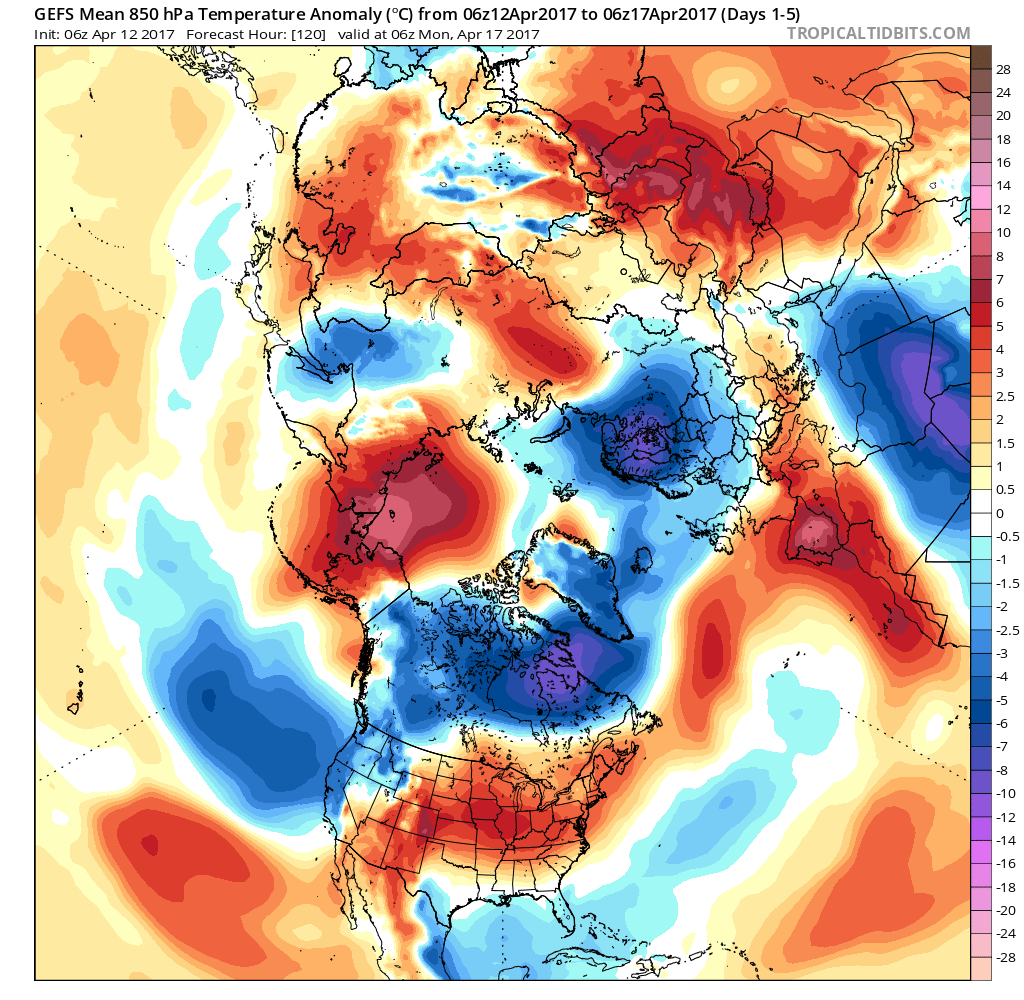
As was mentioned by csnavywx, anomalous warmth looks to return to the Kara Sea (and much of the Arctic), alongside a low approaching ~960 hPa. Not only is this a favorable pattern for Fram export of whatever multiyear ice remains, but temperatures will run close to 30 degrees Celsius above normal once again for portions of the Arctic.


-
-
NSIDC has now dipped below 2007's minimum, making this year the 2nd lowest minimum on record.
-
This is not good.

-
Awesome talk by Dr. Richard Alley at the annual 2015 Penn State Chi Epsilon Pi spring buffet. Talked about how the geologic record showed Carbon Dioxide as a significant causal agent of warming and the non significant aspect of cosmic rays on the climate.
-
Well some people can rest easy now, "Steve Goddard" has given his real identity. He is also making waves in the media with his current claim that 40% of NCDC is manufactured and this manipulation leads to a warm bias.
It's comments like this that deter people from a skeptical position on this issue.
-
I know it's a very weak cycle, but aren't we at solar max right now?
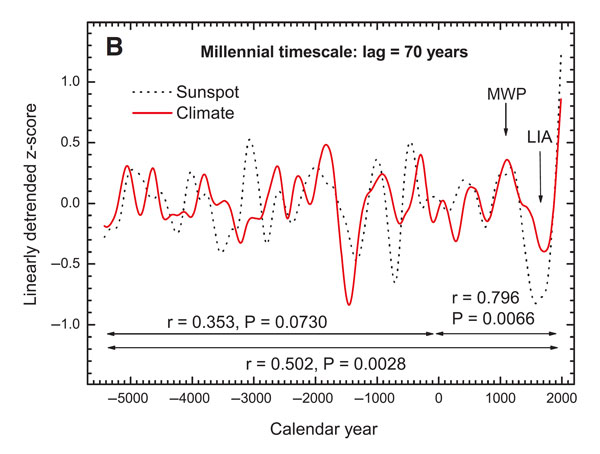
The climate isn't as sensitive to small solar variations like the 11 year cycle as it is to long term solar variations, like the De Vries cycle. Longer term solar variations on a decadal to centennial scale have about a 50-70 year temperature response lag, and have more noticeable impacts on the climate. The reasoning, according to Zanchettin et al. is:
"Although most of the Sun-climate mechanisms are not
well understood yet, a host of empirical evidence suggests
that solar energy changes alter the Earth’s climate significantly
[Eddy, 1976; Haigh, 1996; Shindell et al., 1999; Marsh
and Svensmark, 2003; Lambert et al., 2004; Georgieva et al.,
2005] and that climate sensitivity to solar variations obeys a
frequency-dependent transfer function of solar energy, so that
the damping effect of the oceanic and atmospheric thermal
inertia make the climate more sensitive to slower solar
variations [Wigley, 1988; Foukal et al., 2004; Scafetta and
West, 2006]."
From Helama et al. 2010.
-
You can see some pretty unscientific comments on both sides in this video.
-
One month? It's not one month. It's 6 months. And it's not just 2013. 2012 had the record and 2011 before that for the year.
The first 3 months of this spiked to 14.1 and the most recent 3 months is at 12.5. That is way above the previous record year of 2012. Soon in terms of a year means 2014 or 2015 to me. but I expect Sept-Dec on GISS to be record setting.
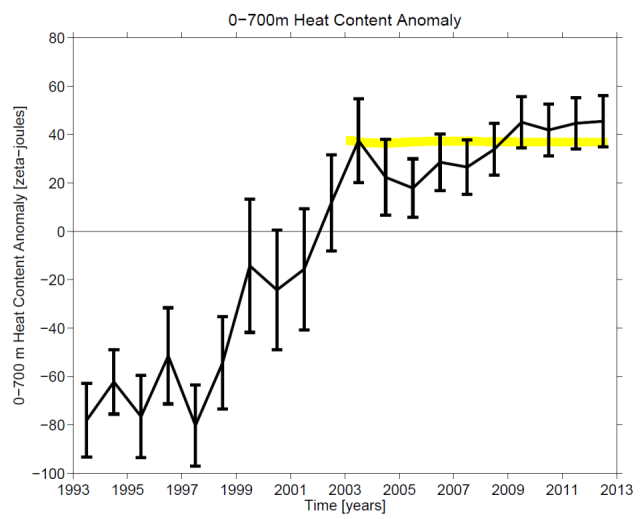
2000 5.856500 2001 4.117000 2002 6.788750 2003 9.951750 2004 10.24050 2005 8.411750 2006 10.43025 2007 9.478500 2008 10.05225 2009 10.12600 2010 10.36725 2011 10.86900 2012 10.94075
Pretty sure the differences between a lot of those years are not even close to being statistically significant.

The yellow line isn't a linear trend, but it's a reference point.
-
To be fair, your placement of "stupid" could be argued for #1....if you wanted to be unbiased.
There's stupid for #6 and #1. I've discussed with people that believed the anthropogenic forcing was a hoax or that CO2 actually cooled the atmosphere. Or that Global Warming was an evil plot to get more regulation. There's also people who want to attribute everything to Global Warming, who look equally ridiculous.
-
The debate over whether global warming is occurring - yes.
I haven't seen any scientists claim we know everything about everything. Come on now.
Making statements like the "science is settled" implies that we know everything about an issue. That's obviously not true, as you yourself have stated.
Yes, Global Warming has occurred, but what extent of it is anthropogenic? How much will we warm in the future? How much has this warming impacted weather? These are all viable questions.
-
I keep seeing this brought up as some sort of talking point, but who has stated that we "know all"? Seriously.
You can find dozens of examples of scientists and non-scientists claiming the science is settled and that the debate is over. It's a ridiculous attempt at suppressing the skeptical view.
-
Oh and the response by the reviewer that I read points out that numerous other surface and satellite sources which have been considered fairly reliable disagree with the findings of major global brightening.
Pinker et al. found a 0.16 w/m^2/year increase in incoming insolation during the late-20th Century though.. that would be equivalent to 1.6 w/m^2/decade and that would also be comparable to the value found in the Herman et al. study. Again.. this doesn't represent a forcing.. because the longwave cooling still needs to be taken into consideration.
-
Your first study claims a 2.7W/m2 increase in solar radiation reaching earth's surface. This is an incredible finding. If this were the case, there should have been a massive amount of warming. Incredible findings require incredible evidence. This paper was just published and nobody has cited or responded to it, although I did find one very critical response by a reviewer.
Keep in mind that this doesn't represent a radiative forcing, since as the paper notes, this value is partially offset by increased longwave radiation being allowed to radiate to the TOA, due to the decreased Cloud Cover. Even if we assume that 50% of the net SW absorbed (2.3 w/m^2) is cancelled out by the longwave cooling, then that is still fairly substantial, and represents a 1.2 w/m^2 forcing. Again, this is just hypothetical.
I'm not sure how much the increased longwave cooling associated with decreased Cloud Cover would offset the increased shortwave radiation being absorbed at the surface, and the paper's abstract did not specify. I remember seeing that the IPCC estimated the net anthropogenic radiative forcing during the late-20th Century to be somewhere around 0.9 w/m^2, so thus, assuming that all of the late-20th Century warming was forced, and natural variability didn't play any role (which is unlikely) you can get a sensitivity that is pretty low.. around 1 Degree C. This is all assuming that the study's findings are correct. There are other studies like Pinker et al. that show Global Brightening over the late-20th Century.. though I'm not sure what the magnitude of the increase is compared to this study's.
-
1. Lifespan of aerosols is short so effect must be small.
False. Surface and satellite based measurements show solar dimming due to aerosols. Aerosols are short-lived, but emissions are high enough that they accumulate in significant concentrations before the end of their lifespan. If we stopped all aerosol emissions, aerosol concentration would plummet (unlike long-lived GHGs).
2. Faster warming in the northern hemisphere is evidence that aerosols have smaller RF than most scientific studies say.
False. The NH is projected to warm faster for numerous reasons which may not be cancelled by aerosol forcing roughly 25% the strength of GHG forcing. In addition, you can observe that within the NH, the areas of highest aerosol concentration have warmed the slowest. In fact, the SE U.S. is one of the slowest warming regions on earth. While warming in Europe has generally been .5-1C, warming in adjacent North Africa, Scandanavia, and eastern Europe has been 1-2C.
Again, recent satellite measurements indicate that the trend has reversed and an increase in SW Radiation has been absorbed at Earth's surface over the last 30-35 years. This would suggest less "masking" of the warming since there is more SW Radiation being absorbed at the end of the late-20th Century than in the mid-20th Century, representing a radiative forcing.
Other studies found that the decrease in Cloudiness is unrelated to anthropogenic aerosols.
http://www.ann-geophys.net/30/573/2012/angeo-30-573-2012.pdf
"Frequencies of clear sky (cloud cover <20%) and overcast days (cloud cover >80%) were observed to increase by ~2.2 days and decrease by ~3.3 days per decade, respectively, which accounts for ~80% of cloud cover reduction. Larger decreasing trends in cloud cover due to larger increase in clear sky frequency and larger decreases in overcast frequency were observed at stations with lower aerosol optical depth. There is no significant difference in trends regarding cloud cover, clear sky frequency, and overcast frequency between mountain and plain stations. These results are inconsistent with our expectation that larger decreasing trends in cloud cover should have been observed in regions with higher aerosol loading where more aerosols could lead to stronger obscuring effect on ground observation of cloud cover and stronger radiative effect as compared with the mildly polluted regions. Aerosol effect on decreasing cloud cover in China appear not to be supported by this analysis and therefore, further study on this issue is required."
Regional warming also correlates to multidecadal variations in the amount of SW radiation being absorbed, as well as to TSI changes, suggesting that some of the variability in the SW changes is due to natural factors, as well as human factors.
http://www.sciencedirect.com/science/article/pii/S1364682611002161
-
Actually the largest regions that lack warming are the already-industrialized regions...and the lack of warming is almost exclusively coming from a cooling trend in winter in these regions.
http://web.mit.edu/jlcohen/www/papers/Cohenetal_GRL2012.pdf
Essentially the opposite of what you'd expect.
To back up your point:
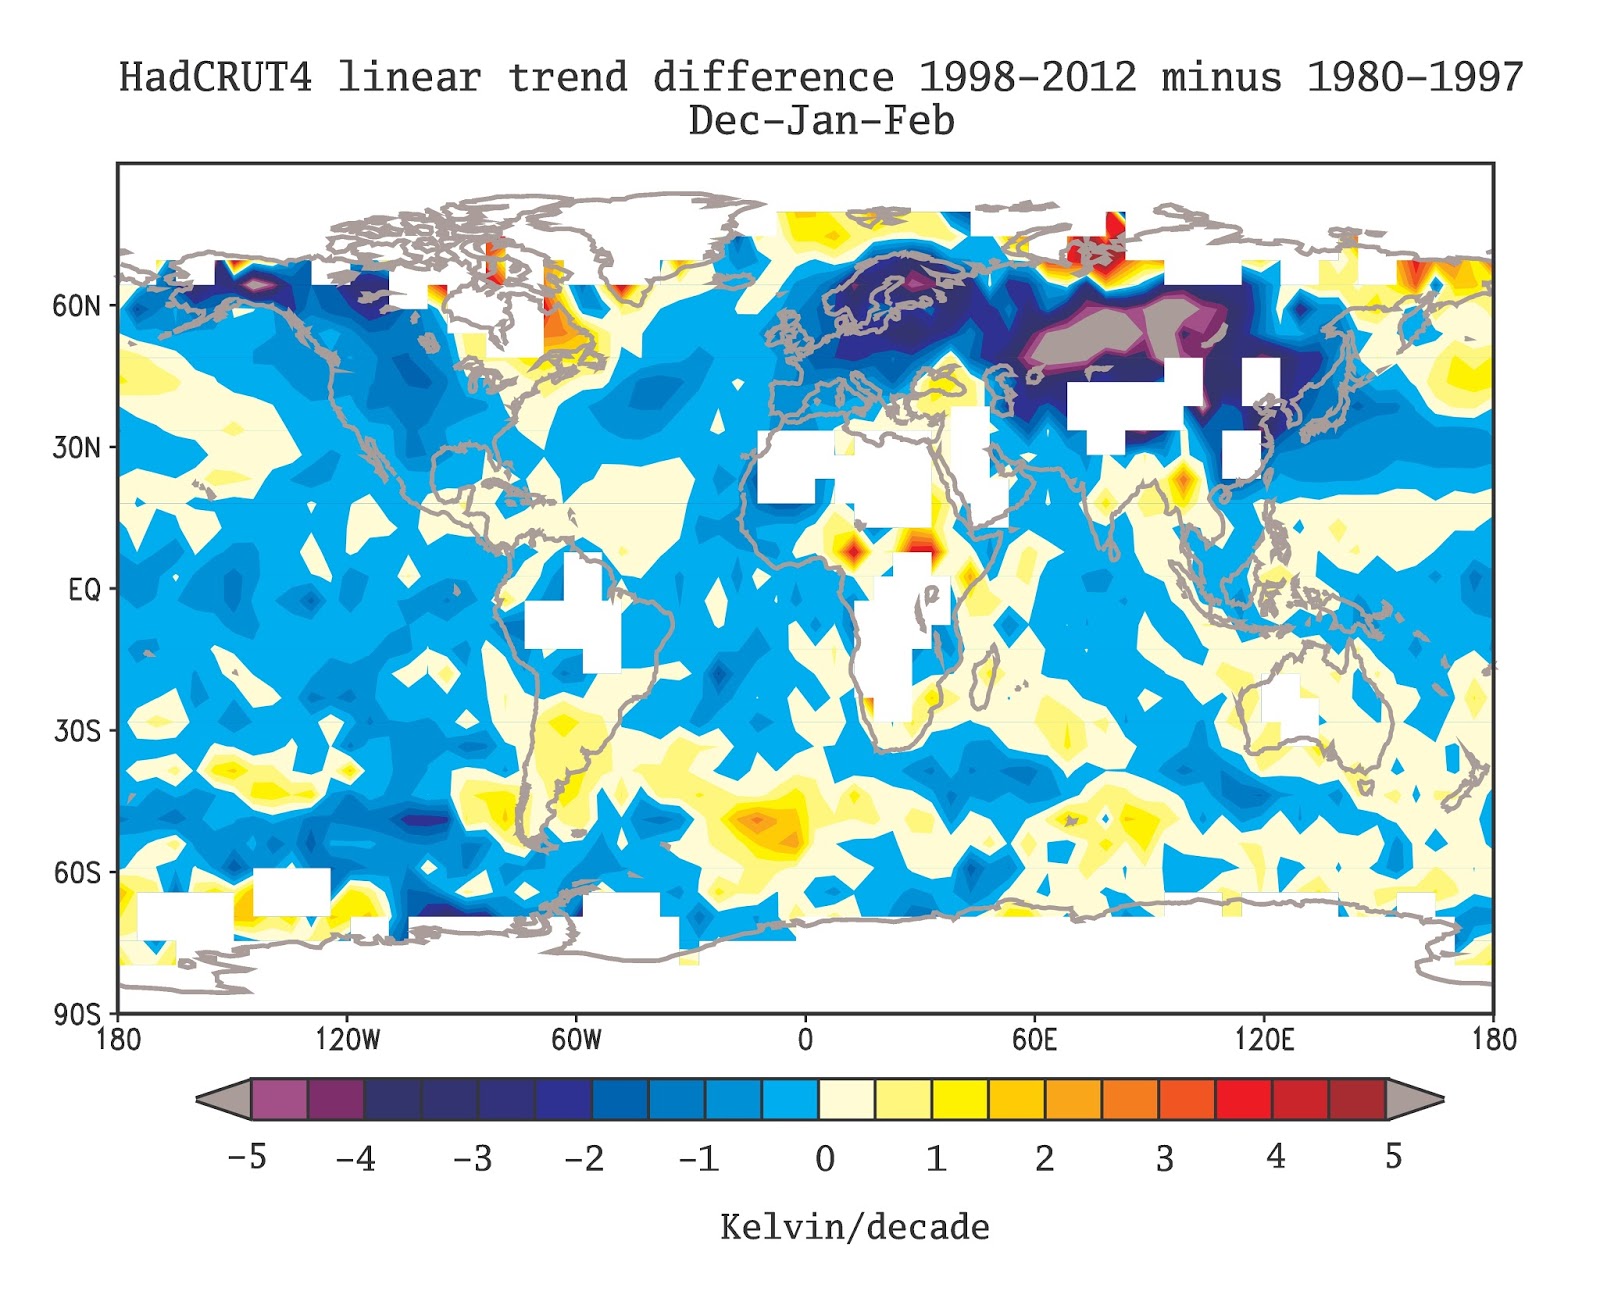
You can see how far off the models simulated the observed trends in Dec-Feb especially in recent years.
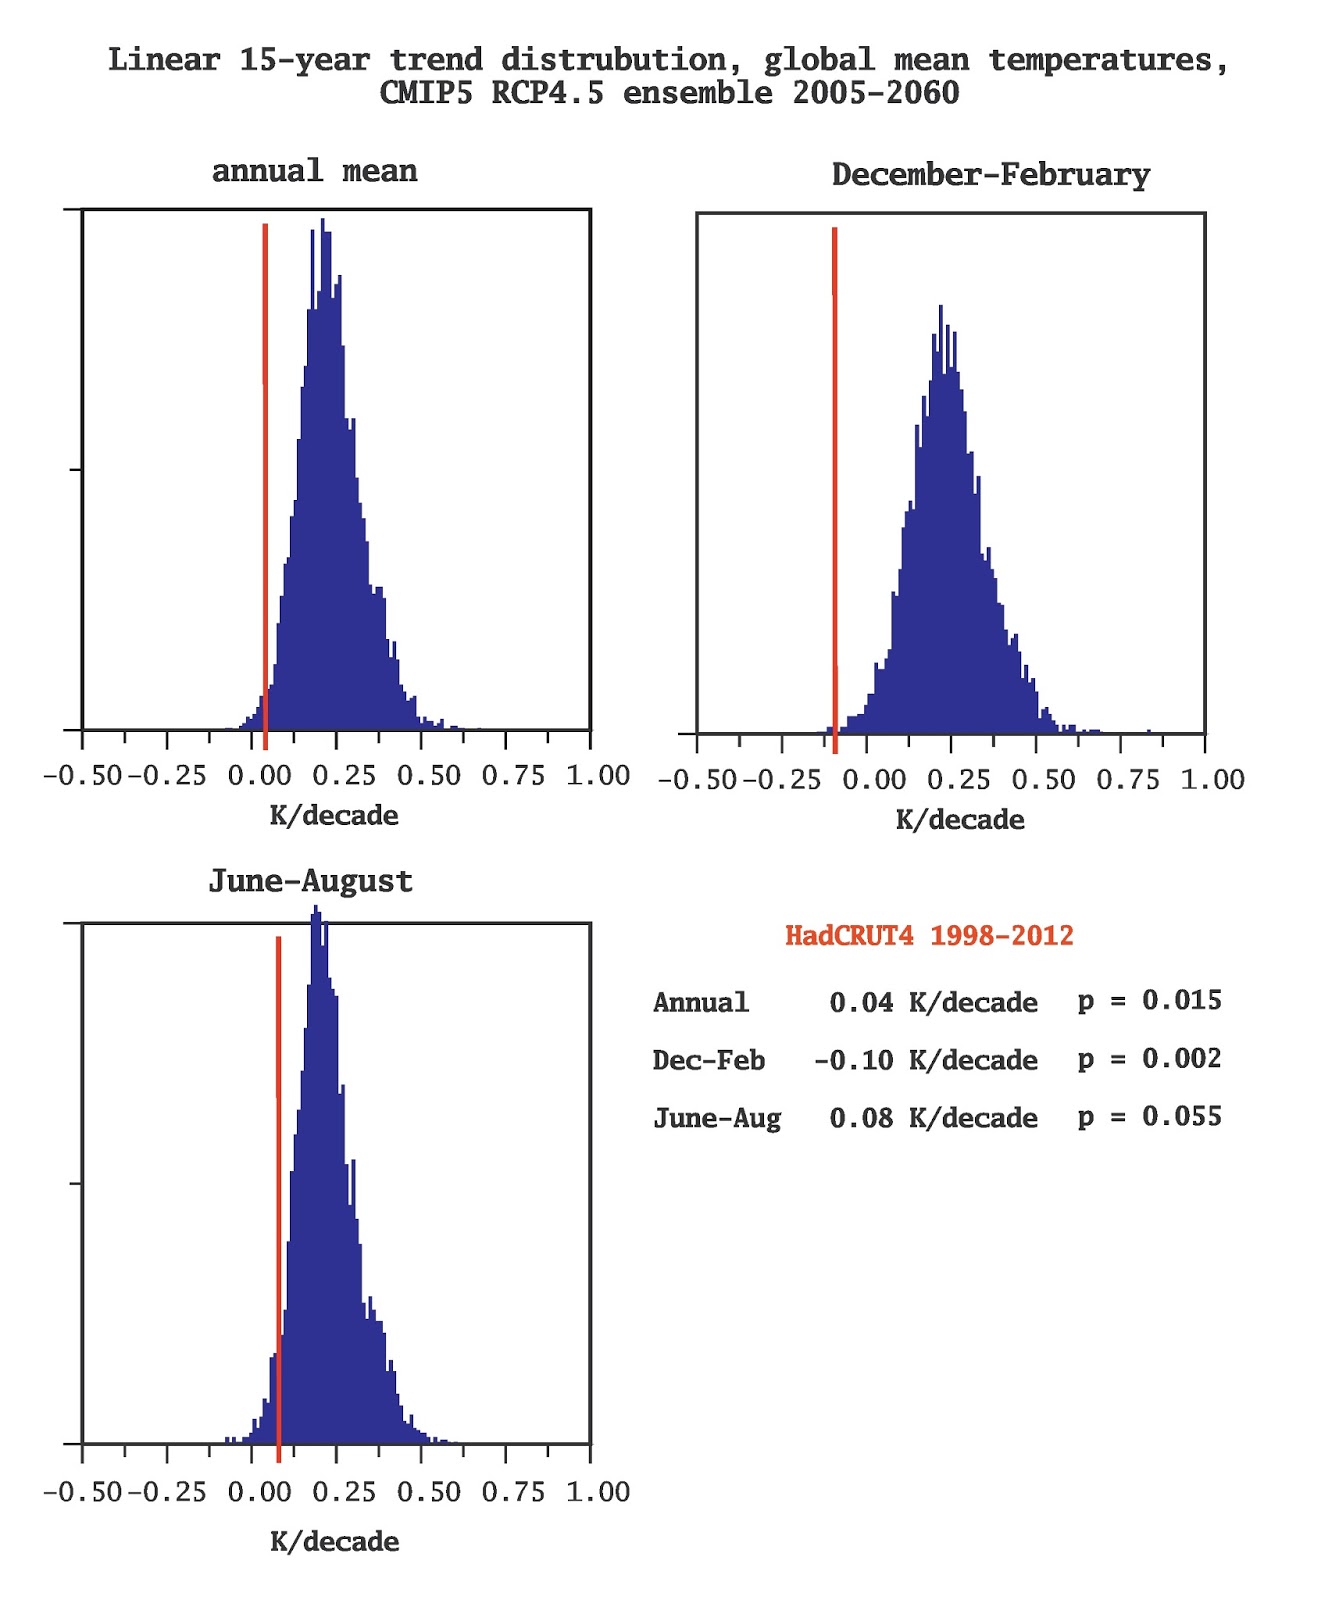
http://klimazwiebel.blogspot.com/2013/09/the-intriguing-stagnation.html
-
Please show these posts. I've been aware of these studies for quite some time, and have been suggesting that there is some possibility for an ECS <2C for quite some time.
I have said, and still would say, that anybody saying that climate sensitivity is probably <2C is probably biased and not looking at the full body of evidence.
I linked you to one of your previous posts suggesting the accepted sensitivity to be 3 Degrees C with a lower bound of 2 Degrees C. The models, which have a ECS of 3.2 Degrees C do generally simulate too much cooling when compared to observations during cooling events like Mt. Pinatubo. In addition, the models underestimate the early-20th Century temperature trend, which suggests they are too sensitive to changes in radiative forcing. In addition, in the GCMs, with just changes in Water Vapor, Lapse Rate, and Surface Albedo only produce an ECS of 1.9 Degrees C. This means that if the Cloud Feedback is negative, ECS can easily be lower than 2 Degrees C.
A lot of recent studies, as I've said have gradually been shifting away from the 2-4.5 Degree C figure. Quite a few have high probability densities between 1-2 Degrees C, with some even lower than that.
-
Most warming from 1970 to 1995 was almost completely as a result of the Clean Air Act. If CO2 is the main culprit, its warming would have been spread more evenly without the aerosols, instead it was seen after the fog cleared.
I wouldn't be surprised if we get a second warming bounce due to particulate filters being mainstream since 2007 in many of the worlds diesel burning engines, a huge source of aerosol production.
Part of the Global Brightening trend since 1979 may also have to with the +PDO. There was some rough speculation by Roy Spencer that the mechanism for which the PDO can cause warming on multidecadal timeframes is through a decrease in Cloud Cover.
-
3. Scientifically grounded: acknowledges the full range of scientifically accepted climate sensitivity (1.5-4.5C). May lean slightly one direction or another within that range based on a good-faith effort to objectively interpret the evidence with assistance of peer-reviewed literature, but acknowledges all of the uncertainty and the lack of concrete evidence. Has a balanced understanding and acceptance of the various consequences and benefits and the evidence that on net the consequences will be negative. A moderate to high level of mitigation is warranted, and adaptation cannot be relied upon solely.
That's interesting. Only a few months ago, you were saying that the accepted climate sensitivity was 2-4.5 Degrees C, and that anyone who would dare put out sensitivity values lower than 2 Degrees C were, according to your definition, a biased ignoramus. Unfortunately for your definition, there are actually a lot of recent peer reviewed studies focusing on sensitivity values between 1-2 Degrees C. Skeie et al. is one of the most recent examples. Ring et al. and Asten are also recent examples as well, finding sensitivities of 1.77 Degrees C and 1.1 Degrees C respectively. Now you say that the accepted values is now 1.5-4.5 Degrees C, which I guess had to do with the latest IPCC report lowering the lower bound of the sensitivity from 2 to 1.5 Degrees C, which is a nod to the with many recent studies finding an ECS of 1-2 Degrees C.


Arctic Sea Ice Extent, Area, and Volume
in Climate Change
Posted
Didn't know you were a skeptic too at one point. I accepted the mainstream conclusions of the science, when it became abundantly clear that we were still warming, and there was no sign of any prospective cooling. Learning more about the subject didn't hurt either. It's been over 3 years since I recognized this.
There are no energy accumulation lags. Zero. It is like saying that a pot on a stove will continue to gain energy, even after the burner has been turned off. It makes no physical sense. So the continued upper ocean heat accumulation is totally inconsistent with reduced solar activity. It is just not causing current climate change.
Getting back on topic, a pretty poor pattern for the Pacific side of the ice is on the way. The 12z ECMWF is advertising well above normal 850 hPa temperatures in the medium range and beyond for that region. Kind of surprised we still saw sizable losses over the last few days, despite cooler than normal 850 hPa temperatures. Unless recent losses have all come from the Hudson Bay. I think persistence type predictions of the sea ice minimum, like June melt ponding have the potential to be more inaccurate than usual this year. With the ice being so thin, it won't take as much to see sizable losses in the coming couple of months.