

snowlover91
-
Posts
1,277 -
Joined
-
Last visited
Content Type
Profiles
Blogs
Forums
American Weather
Media Demo
Store
Gallery
Posts posted by snowlover91
-
-
1 minute ago, Orangeburgwx said:
I believe it is the ensembles of the CMC
RGEM is a high resolution version of the CMC, similar to how you have the 32km NAM, 12km and 3km versions. The RGEM ensembles go out to 72 hours and can be useful for trends in track but that's about it. Inside 48 they are excellent.
-
Just now, forkyfork said:
i'm not reading that
Of course you wouldn’t. Here’s the summary. Views that are contrary to AGW were intentionally suppressed and AGW is a means to redistribute wealth.
-
12 minutes ago, forkyfork said:
science doesn't care about your opinion
Certainly not but science is a field where theories and our understanding of things is constantly evolving. There is plenty of scientific research which supports the opinion I have and there is scientific research supportive of other views as well. Scientific consensus is a great thing but can also be a big problem that holds back scientific advancement as well. For example, there have been cases where the scientific community held a consensus view and peer reviewed literature rejected other theories because they didn't agree with the consensus and yet the "minority" view ended up finally having a breakthrough that completely upset the "consensus" view. Do some research on this and you'll see what I mean. Skepticism and asking tough questions is a part of the process and differing views based upon scientific research should not automatically be discredited or rejected simply because they don't fit the "consensus" view; they are to be evaluated and examined. You would do well to study the agenda behind AGW btw, it's quite interesting to note and is worth keeping in mind.
Here's a quote to get you started by Stephen Schneider “On the one hand, as scientists we are ethically bound to the scientific method, on the other hand, we are not just scientists, but human beings as well. And like most people, we’d like to see the world a better place, which in this context translates into our working to reduce the risk of potentially disastrous climatic change. To do that, we need to get some broad-based support, to capture the public’s imagination. That, of course, entails getting loads of media coverage. So we have to offer up scary scenarios, make simplified, dramatic statements, and make little mention of the doubts we might have. Each of us has to decide what the right balance is between being effective and being honest.”
Or how about this one?
“If you think that [Yale professor James] Saiers is in the greenhouse skeptics camp, then, if we can find documentary evidence of this, we could go through official [American Geophysical Union] channels to get him ousted [as editor-in-chief of the Geophysical Research Letters journal].”
How about this?
“I can’t see either of these papers being in the next IPCC report. Kevin [Trenberth] and I will keep them out somehow---even if we have to redefine what the peer review literature is."
Or this?
"I got a paper to review (submitted to the Journal of Agricultural, Biological and Environmental Sciences), written by a Korean guy and someone from Berkeley, that claims that the method of reconstruction that we use in dendroclimatology (reverse regression) is wrong, biased, lousy, horrible, etc…If published as is, this paper could really do some damage…It won’t be easy to dismiss out of hand as the math appears to be correct theoretically… I am really sorry but I have to nag about that review—Confidentially, I now need a hard and if required extensive case for rejecting.”
" IPCC official Ottmar Edenhofer, speaking in November 2010, advised that: “…one has to free oneself from the illusion that international climate policy is environmental policy. Instead, climate change policy is about how we redistribute de facto the world’s wealth..." More info here. https://www.forbes.com/sites/larrybell/2013/02/05/in-their-own-words-climate-alarmists-debunk-their-science/#4cecd56f68a3
-
 1
1
-
-
1 hour ago, bdgwx said:
That is not what bluewave or anyone has claimed. The claim is that Sun (like any main sequence star) is relatively stable in regards to it's luminosity. The variability in the radiative forcing is relatively small despite the magnitude of the radiative forcing being large. The change in radiative forcing of CO2 dominates over the change in radiative forcing of the Sun. Again, it's the change in the effects that are crucial in understanding the change in radiative forcing and thus the change in the heat uptake by the geosphere. Note that I have underlined change to drive home the point that it is the change in the system that puts pressure on the climate and ultimately the Arctic sea ice extents to also change.
For example, if the Sun were to experience a change of 0.25% in it's integrated luminosity then this is equivalent to 1360 W/m2 * 0.0025 / 4 = 0.85 W/m2 of forcing. But, a doubling of CO2 results in 5.35 * ln(560/280) = 3.7 W/m2 of forcing. That's more than 4x the effect. Plus, solar grand minimums are relatively short term compared to the long term impacts of CO2 which take 100s or even 1000s of years to die off to preindustrial levels. Note that a -0.25% change in TSI is considered to be on the high end of the forcing change for a hypothetical grand minimum.
The only problem with this assumption is that it assumes there are absolutely no other feedback created by this warming which may offset it in a positive/negative way as well. There have been various papers written dealing with just this and it's not quite as cut and dry as it would seem. Water vapor, cloud cover, changes in ocean currents, etc. all create complex interactions that can lower or increase the effect of CO2 doubling.
-
2 hours ago, bluewave said:
A solar minimum is no match for the CO2 forcing. There was a good paper out on this several years ago. As for the AMO, the sea ice was in decline during the last cold phase during the 80's into the mid-90's. Natural oscillations like the PDO and AMO can impact shorter term rates of decline. But the long term decline is a result of rising global and Arctic temperatures.
We simply have a difference of opinion here on what is causing the decline based on the research and info out there. As I've presented in other posts and threads there are various papers that have been written on alternative explanations for the ice decline that assert CO2 has had a minimal role and other factors or combinations of them are at play. We also need to consider what is "normal" for ice extent and coverage as well since throughout history there have been some significant changes to the ice extent, temperature distribution, etc. as the earth's climate has changed. That's quite obvious from the areas where glaciers are melting and revealing tree stumps and human civilization artifacts that quite clearly indicate much warmer temperatures in those regions in times past.
-
1
-
-
3 hours ago, bluewave said:
Quick gains in Hudson Bay won't do anything for the long term volume downward trend. It's a peripheral region outside the main Arctic basin that completely melts out in the summer. So you can't retain any ice there since it's all first year.
If we are going to see a reversal in the ice extent and volume it will be a long term change that will take place over a few decades just like the downward trend has. The key is for things to stabilize and then see the volume starting to consistently increase on a 5-15 year scale. With solar min and a possible start to a cold phase of the AMO, the next 10+ years will be interesting to see what happens.
-
4 hours ago, bluewave said:
It was quite high in the Hudson Bay, but not the Arctic. That's why the regional sea ice figures tell the bigger story.
Right, the Hudson Bay was well above normal and has now stalled in freezing over. However, the Arctic as a whole was making good progress compared with recent years. It was the 2nd highest level since 2005 but has now leveled off some. With the cold returning to the Hudson and also the Okhtosk area I expect gains will accelerate again in a few days. It certainly should be interesting to follow as well as the volume which IMO is even more important for summer melt and how well it holds up.
-
23 hours ago, bluewave said:
There's nothing particularly rapid about the sea ice growth in the Arctic this month. But the record cold to the south of the Arctic in Hudson Bay area is responsible for the fast increase above average there. It looks like it could be a result of the Warm Arctic, Cold Continents pattern.
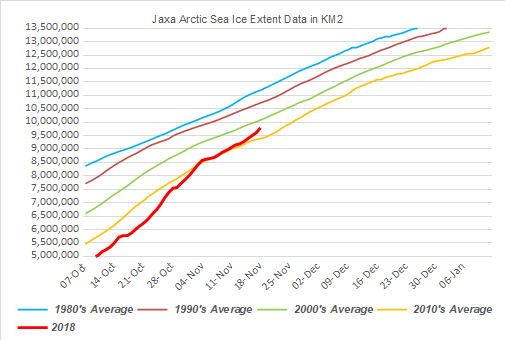
I’d have to disagree with the bold part. While things have slowed down in recent days, the growth for about 3-4 weeks was quite high and we went from 3rd lowest to 13th lowest extent in the Arctic. Here’s some charts that showed how quickly we passed other years and the spikes in rapid gains. This link here has people who catalog things on a daily basis, we are now in the 9th lowest range. https://forum.arctic-sea-ice.net/index.php/topic,2223.2200.html
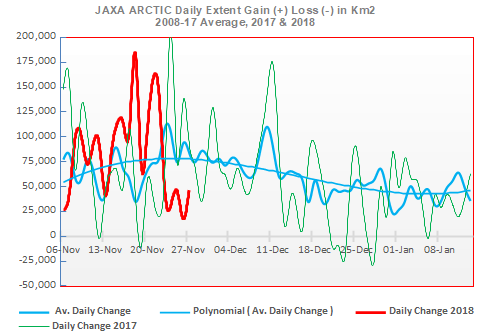
The early gains were likely due to Hudson Bay freezing over faster than normal. It has since leveled off hence the slowdown in gains. The key this winter will be what happens in the Barents and Chukchi Sea since blocking and winter storms can erode ice in these areas.
-
11 hours ago, bdgwx said:
Assuming extent gains increase by the 1981-2010 rate November will end with a mean of about 9.9e6 km^2. Then if we assume extents jump up and exactly match the 1981-2010 average (unlikely IMHO) then December will end with a mean of 12.8e6 km^2. This puts the final tally for 2018 at at mean 10.41e6 km^2. It would still be the 5th lowest annual mean just barely behind 2012 at 10.406e6 and 2017 at 10.393e6. Note that the top 5 would all be 2012 and later. So although the fast refreeze is interesting in it's own right it needs to be considered in context here. Unless someone has a convincing argument it's premature to think this is the start of a new era where sea ice extents begin a long term secular increase especially considering that we have a mountain of evidence that suggests sea ice extents will stagnate at best through the 2030's or just continue to decline.
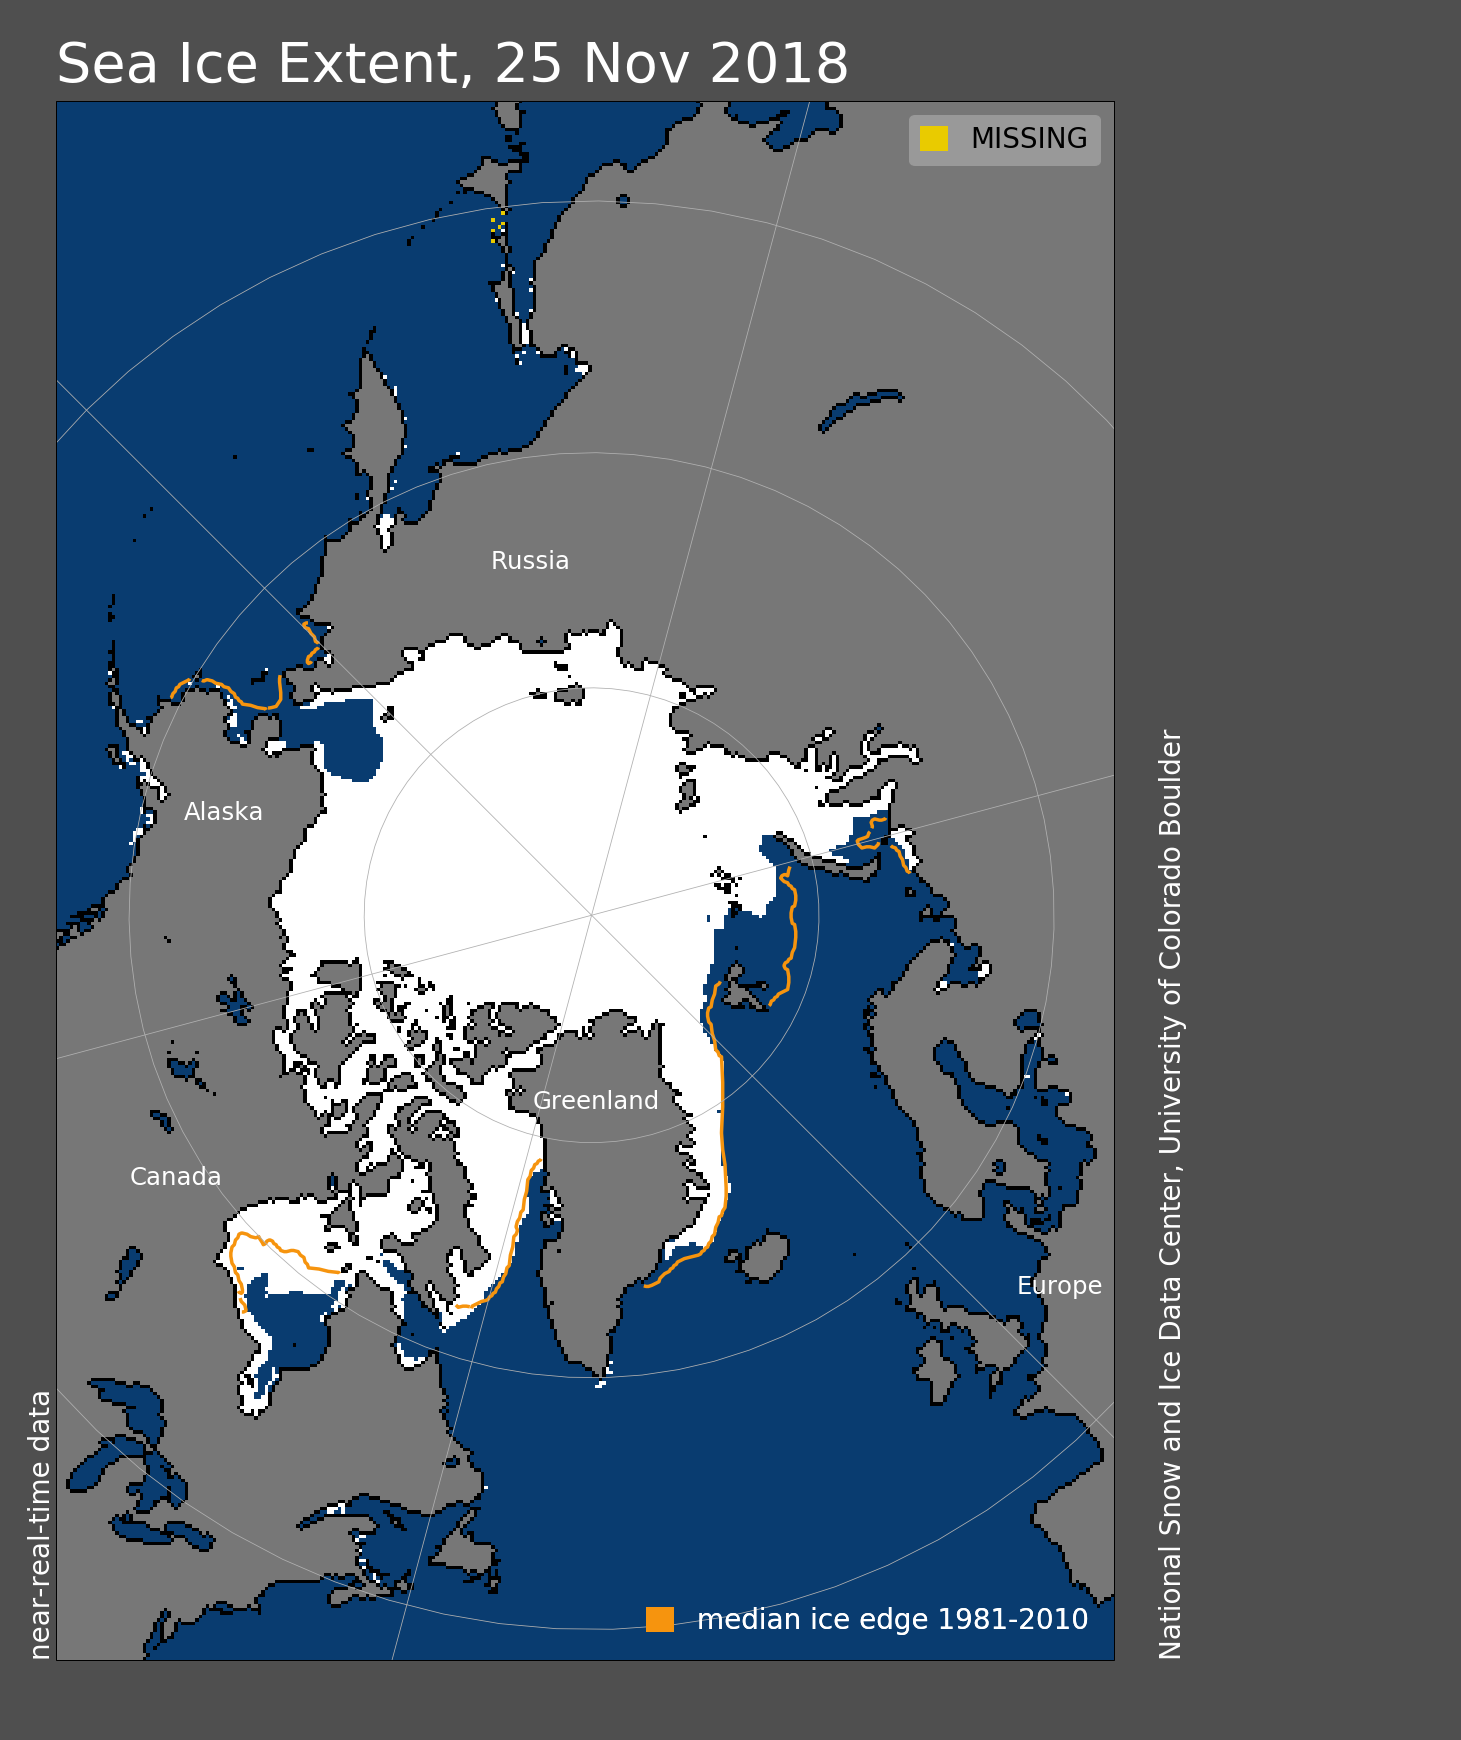
I think something worth looking into is why the ice extent has been growing so rapidly when SST's in the region were 5-7C above normal in places? Obviously we are at the time of year when you'd expect some pretty fast gains but we moved from about 3rd in lowest ice extent to 13th in a matter of a few weeks with SST's that were as warm or warmer than previous years and anomalies that were above normal for the region. One would expect with SST's so far above normal that it would delay the freezing some and also the extent would be much lower than it is right now. Just looking at the latest NSIDC map, the only two regions that are noticeably absent of ice are the Chukchi Sea and Barents Sea areas while everywhere else is pretty close to the 1981-2010 mean and Hudson Bay is freezing a touch quicker than usual.

If indeed the solar cycle and other factors like the AMO phase play a role as some research suggests then it's possible we could be seeing some signs of that with the solar min we are entering and the AMO possibly transitioning from a warm to a cold phase. Here's one study written on the AMO citing possible links between it and Arctic/Antarctic ice extent. IF indeed we are transitioning to a cold phase of the AMO then it will be interesting to see if we see an upward trend in Arctic ice levels the next 5-10 years or if things remain stable/decrease.
"Sea ice is an important component of the global climate system and a key indicator of climate change. A decreasing trend in Arctic sea-ice concentration is evident in recent years, whereas Antarctic sea-ice concentration exhibits a generally increasing trend. Various studies have investigated the underlying causes of the observed trends for each region, but possible linkages between the regional trends have not been studied. Here, we hypothesize that the opposite trends in Arctic and Antarctic sea-ice concentration may be linked, at least partially, through interdecadal variability of the Pacific Decadal Oscillation (PDO) and the Atlantic Multidecadal Oscillation (AMO). Although evaluation of this hypothesis is constrained by the limitations of the sea-ice cover record, preliminary statistical analyses of one short-term and two long-term time series of observed and reanalysis sea-ice concentrations data suggest the possibility of the hypothesized linkages. For all three data sets, the leading mode of variability of global sea-ice concentration is positively correlated with the AMO and negatively correlated with the PDO. Two wave trains related to the PDO and the AMO appear to produce anomalous surface-air temperature and low-level wind fields in the two polar regions that contribute to the opposite changes in sea-ice concentration." https://www.ncbi.nlm.nih.gov/pmc/articles/PMC5381096/
-
5 hours ago, Rjay said:
Hmm, what month is it?
The ice extent gain is well above normal as were the SST’s. Common sense would say that with such above normal SST’s the freeze and gains should be both delayed and declining further as well relative to other recent years. Instead we have the 2nd highest extent we’ve seen post 2005.
-
1
-
-
17 minutes ago, Rjay said:
How do we intelligently debate your word vomit?
Read above
My point proven. Mods won’t do their job here and move banter stuff where it belongs. Back to sea ice, can someone offer a plausible theory as to what is causing such a rapid refreeze of the Arctic when SST’s were well above normal?
-
Ice extent is growing rapidly, at above normal rates still. We are now in the lower bounds of the 1981-2010 average.
-
1
-
-
1 hour ago, bluewave said:
https://thebarentsobserver.com/en/ecology/2018/11/autumn-spring-arctics-new-season
November on the coast of the Barents Sea has been unseasonably warm. Halfway, the Norwegian Meteorological Institute could report 5,9 degrees Celsius above normal for Troms and Finnmark region in northern Norway.
What was snow-covered and frozen in late October is again rainy and warm.
The warm weather are confusing plants and trees. Some, like the low-growing goat willow tree, believes it is spring. On Friday, catkins, the fuzzy soft silver-colored nubs, started to appear, both near Kirkenes and in Murmansk
Both are cities far above the Arctic Circle.
Catkins are actually the trees’ flowers just before they fully bloom, like you normally can see in late April, early May in the Barents Region.
“Very interesting, but not at all good news,” says Paul Eric Aspholm, Research Scientist with the Norwegian Institute of Bioeconomy Research (NIBIO).
Aspholm works at Svanhovd, NIBIO’s department in the Pasvik valley in the Norwegian-Russian borderland, the heart of the area experiencing some of the most dramatic climate changes in the Arctic.
He explains how such confusion like we see this November could harm trees and plants in the Arctic.
“The plants use a lot of energy when blooming. It is a kind of failed reproduction and no seeds are produced. One thing is the catkins we can see, but there are likely a lot of other processes going on inside the plant disturbing the balance in what should be the dormant phase.”
Meanwhile Hudson Bay and surrounding areas are rapidly freezing over and seeing temp anomalies well BN with ice extent advancing past even the 1981-2010 median. Also models indicate season to BN temps heading for the Barents Sea area so don’t worry they will quickly see things freeze up which will continue to the rapid ice extent gains we are seeing.

-
4
-
-
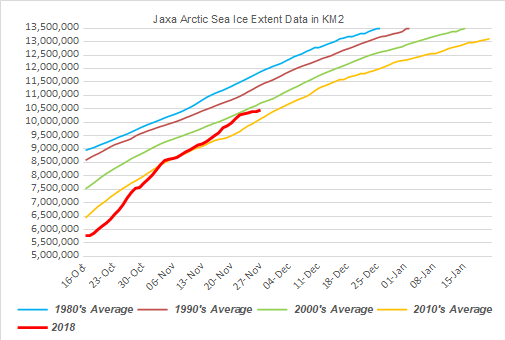
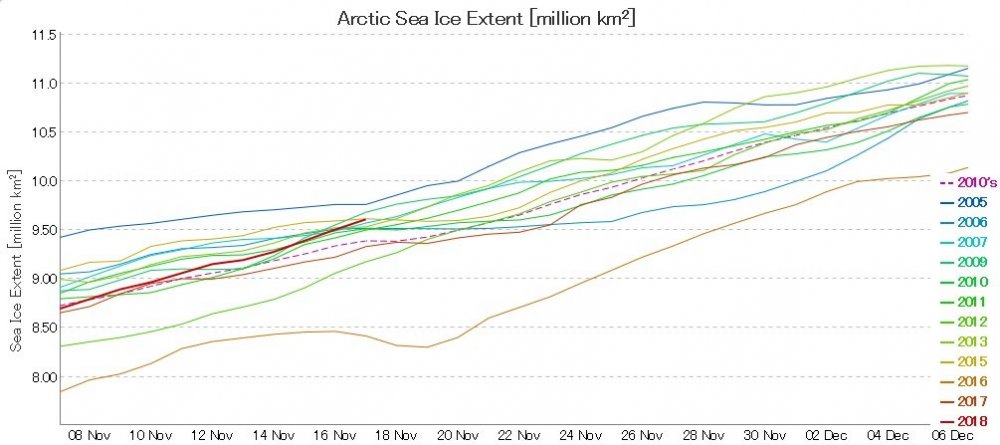
Latest update, JAXA extent is the 11th lowest on satellite record OR 3rd highest post 2005. Source for these graphs/charts is here. https://forum.arctic-sea-ice.net/index.php/topic,2223.msg181476.html#new
NSIDC data is showing similar results.
-
1
-
-
Meanwhile the latest data indicates this year continues to pass other recent years at a very fast pace. With the Hudson Bay expected to freeze up in the next week or two expect this to continue at a steady pace. Source here. https://forum.arctic-sea-ice.net/index.php/topic,2223.2100.html
-
1
-
-
7 minutes ago, forkyfork said:
fixed
When your PIOMAS graph updates for November we can compare them.
-
8 minutes ago, forkyfork said:
omg, ice gains in november
Yep nothing surprising there but it IS interesting that the current volume is close to the 2004-2013 average. Making up some good ground this year so far and encouraging to see.
-
1 minute ago, forkyfork said:
that's how piomas works, mr. internet expert
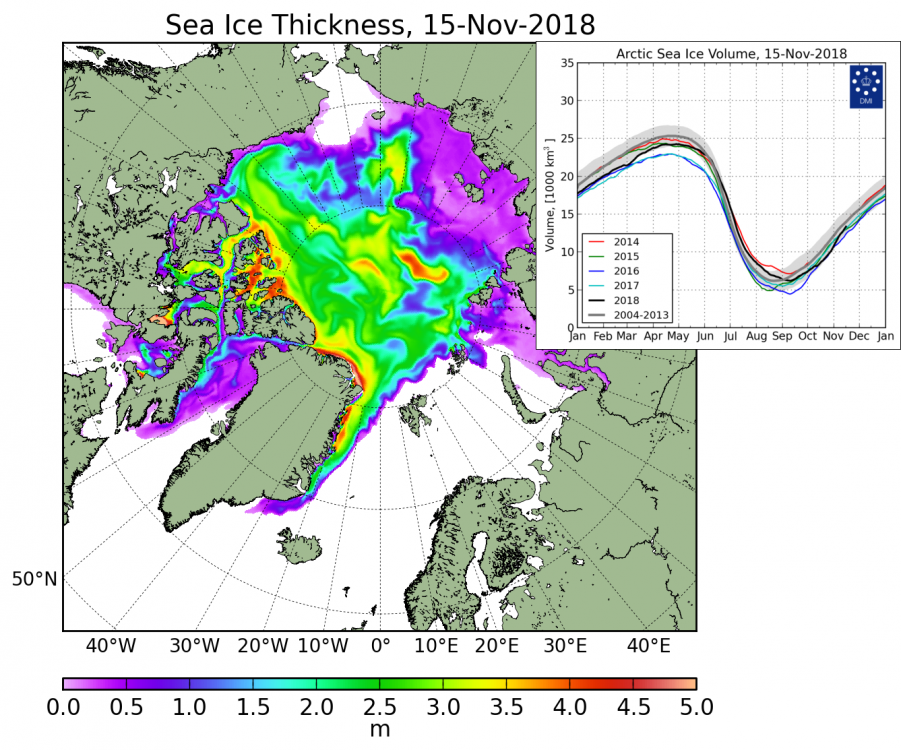
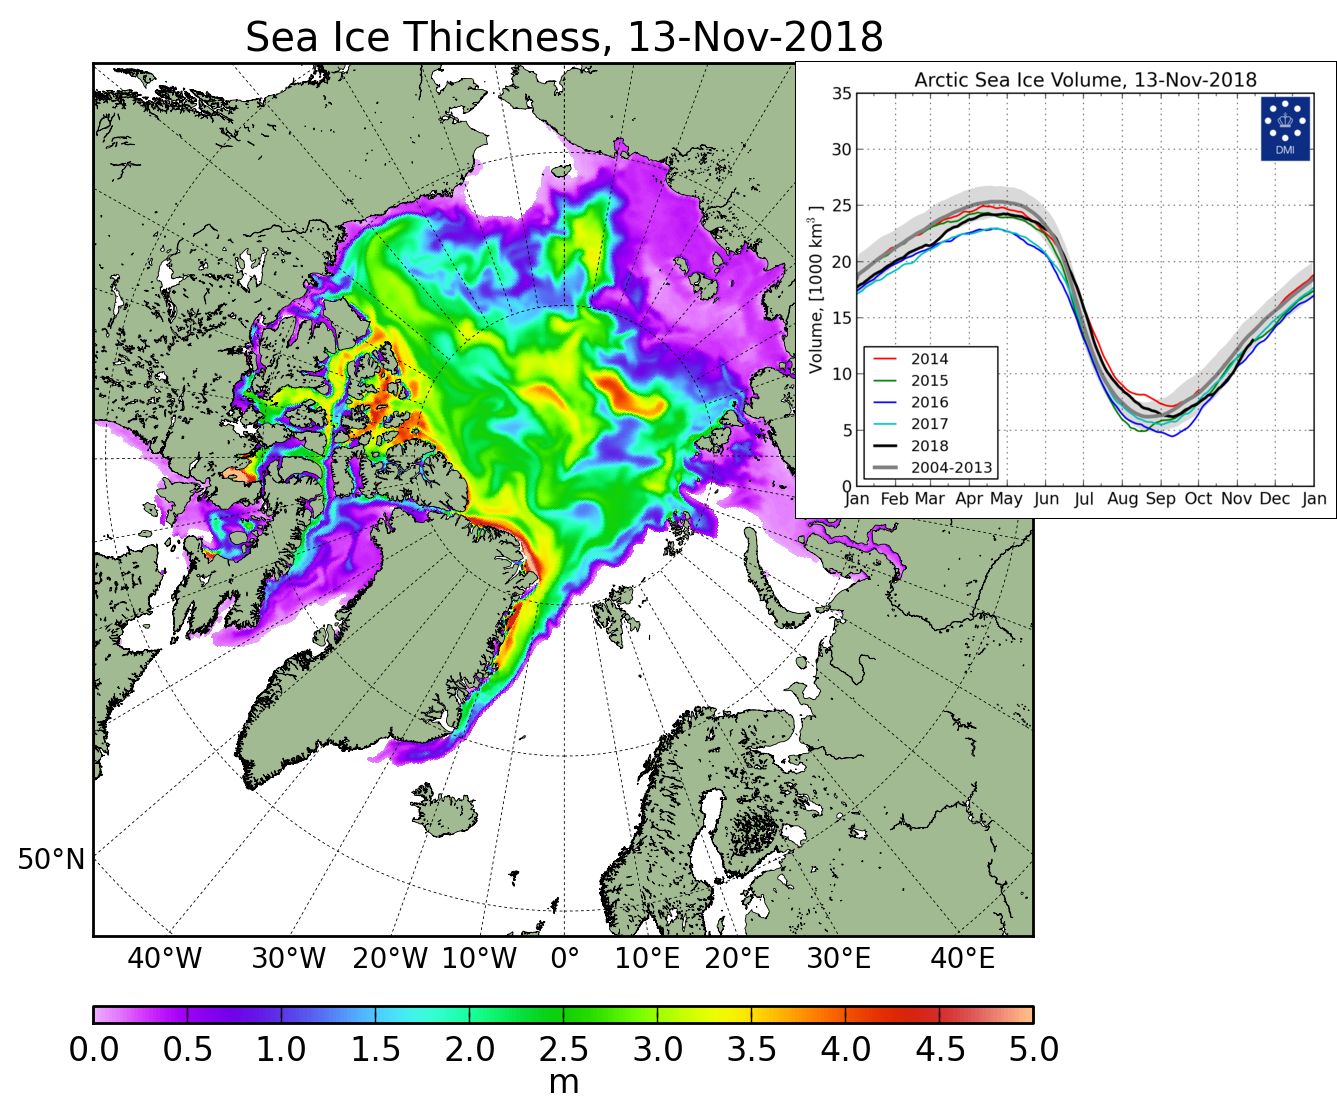
I'm aware of how it works, guess you missed the sarcasm. I expect the next PIOMAS update will be quite a significant jump up. Here's where DMI was October 15 for reference.
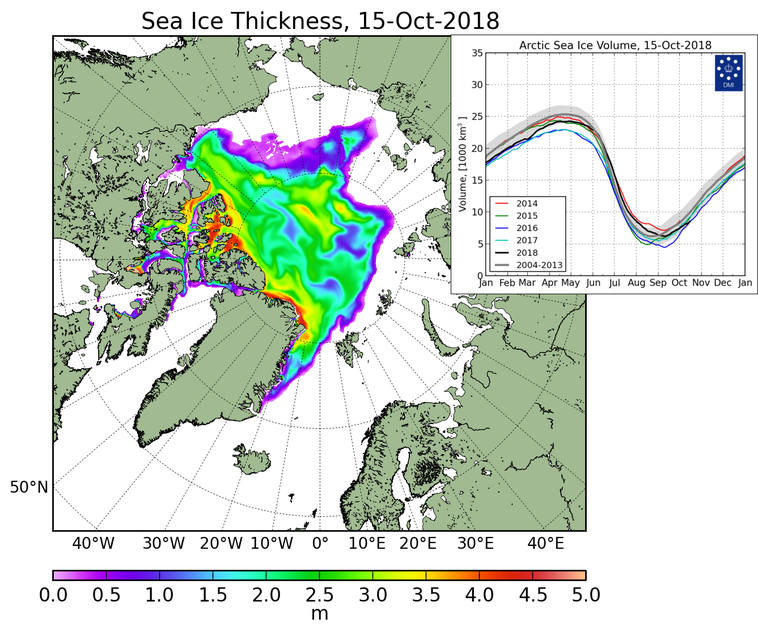
Here is today.

As you can see there have been significant gains since then which has it passing all recent years charted except 2014 and near the 2004-2013 average. Regardless of what you consider to be more or less accurate, across the DMI mapping this year is currently nearing the 2004-2013 average which is encouraging to see. I expect some nice gains on PIOMAS as well.
-
40 minutes ago, forkyfork said:
here's a volume graph that's more reliable:

That graph is nearly a month old and stops in the middle of October. Got a current one?
-
Here's the latest Arctic ice volume/thickness from DMI. As of right now the Arctic is nearing the 2004-2013 average.
-
1
-
-
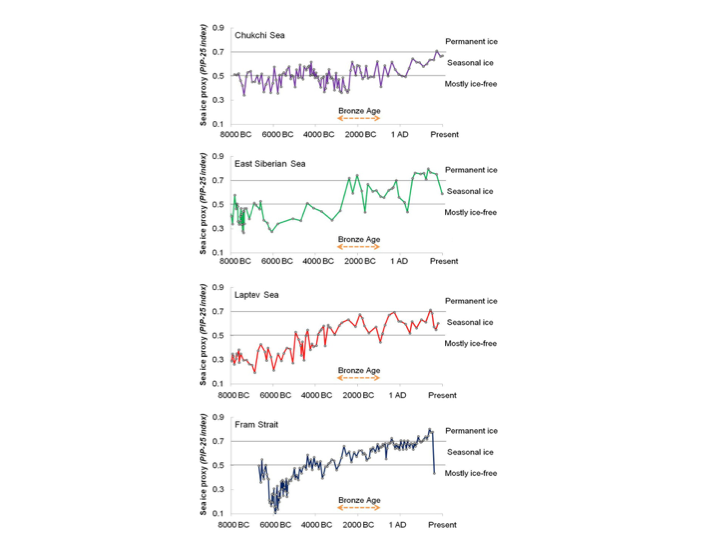
Some interesting ice core results from various parts of the Arctic over the long term show interesting results. The Fram strait has seen a significant drop but the 3 other regions are within the norms for the long term climate if one accepts these results as valid. https://onlinelibrary.wiley.com/doi/abs/10.1002/jqs.2929
-
2018 ice volume finished above 2016 and 2017, passed 2015 and was just below 2014.

Here's some interesting stats from another forum. If you like reading up on stats about the ice and other scientific details they post some pretty cool stuff here. https://forum.arctic-sea-ice.net/index.php/topic,2223.2050.html
NSIDC stats for 11-12-18. Currently 2018 is 8th lowest, now surpassing 2017, 2016, 2012, 2011, 2010, 2009, and 2006. If current trends continue 2018 can "drop" to 11th lowest because 2015, 2013 and 2007 are stalling the next few days.
2018 - 9.559 km2 (8th)
2017 - 9.326 km2 (4th)
2016 - 8.649 km2 (1st)
2015 - 9.650 km2 (stalling next few days)
2014 - 9.827 km2
2013 - 9.575 km2 (stalling next few days)
2012 - 9.002 km2 (2nd)
2011 - 9.458 km2 (5th)
2010 - 9.521 km2 (7th)
2009 - 9.283 km2 (3rd)
2008 - 10.090 km2
2007 - 9.660 km2 (stalling next few days)
2006 - 9.500 km2 (6th) -
29 minutes ago, aperson said:
Connolly et al., 2017: https://www.tandfonline.com/doi/full/10.1080/02626667.2017.1324974
Emphasis mine.
Thus the Alekseev et al. 2016 data set cannot be used to refute the CO2 hypothesis impact on SIE, that is CO2 -> increased temperature -> decreased SIE, because doing so is a circular argument.The rest of your posting career is a similar abuse of scientific literature. People don't engage you because you're correct (you're delusional), they don't engage you because of the Bull**** Asymmetry Principle.
Yes, set in the context of the paper, the author does a good job picking out the difficulties in using various pre-satellite data sets and I have made that clear in my posts. Read the article I linked from Judith Curry’s site, you’ll find some fascinating information about the various data sets and methods used and the issues with them all. Having said that there is evidence from various reconstructions, proxy sets and other studies that indicates the Arctic was quite warm in the 1920-1950 period and that significant ice loss was noticed. How much we will never know since data was so sparse and the war made things even more difficult but the point remains. Here’s another article discussing the difficulties involved with various data sets as well as some proxy data. https://judithcurry.com/2017/08/16/what-do-we-know-about-arctic-sea-ice-trends/
-
2 hours ago, bluewave said:
You should research the sources that you get your material from. The authors you cited aren't even qualified in the field of climate science. That's why the graph is so inaccurate compared to the legitimate study in the NSIDC link that I posted.
Which specific authors are you referencing? You do realize who Judith Curry is right? You also realize the incredible difficulties in amassing anything remotely accurate pre-satellite especially since most of the old ice maps use climo or the gaps are filled in right so there will be significant differences in how this data is assimilated even among various climate scientists? I’m sure you’re aware of a possible critical flaw that was made in the data set you referenced regarding the use of DMI and other maps or did you just blindly accept it? You also realize what even the IPCC has to say regarding this in AR5 chapter 10?


Arctic Sea Ice Extent, Area, and Volume
in Climate Change
Posted
Since PIOMAS is unavailable due to the govt shutdown, here is the latest DMI volume.
Antarctic ice loss is slowing down after a rapid drop. It appears the remaining ice is mainly high concentration ice so the loss should level out fairly soon.