Jump to content

dtk

Meteorologist
  • Posts

    1,001
  • Joined

  • Last visited

Posts posted by dtk

  1. On 12/15/2022 at 6:29 PM, psuhoffman said:

    @dtk or anyone else…did they ever update the gefs to be run off the new operational or is it still the old gefs? 

    Last major upgrade to the GEFS was in 2020 to version v12: https://www.weather.gov/media/notification/pdf2/scn20-75_gefsv12_changes.pdf

    There have only been minor updates since then. NOAA is currently working on the next set of significant upgrades to GFS (v17) and GEFS (v13)...more than a year away.


    • Thanks 3
  2. 45 minutes ago, Ed, snow and hurricane fan said:

    I am trying to see if the 12km NAM and 3 km NAM run the same physics.  I remember the ARW, NMM and such, even if I had no clue what the differences are.


    The 12Z 3 km and 12 km NAMs are more different for tomorrow's DFW winter event than I'd expect just from finer resolution.

    Generally same physics with some specific (and relevant) exceptions.  See here: https://www.emc.ncep.noaa.gov/emc/pages/numerical_forecast_systems/nam.php:

    The NAM nests run with the same physics suite as the NAM 12 km parent domain with the following exceptions:

    • The nests are not run with parameterized convection
    • The nests do not run with gravity wave drag/mountain blocking
    • In the Ferrier-Algo microphysics, the 12 km domain's threshold RH for the onset of condensation is 98%, for the nests it is 100%
    • The NAM nests use a higher divergence damping coefficient.
    • The NAM nests advect each individual microphysics species separately; the NAM 12 km parent domain advects total condensate
    • Like 1
  3. 4 minutes ago, psuhoffman said:

    I know you’re kidding but I think they’ve done very well. If you account for known biases and ignore the one or two outliers each suite the consensus has been extremely consistent for days. Imo some just pay too much attention to every run that nudges slightly closer to what they want even if it’s just noise or guidance bouncing around within the typical range of error for a lead time. 

    Indeed, I was kidding and I absolutely love the challenge of trying to contribute to our "Quiet Revolution".  We have a lot more to do, but it's pretty darn amazing how far we've come.

    I have actually been watching model performance more closely than I usually have time for. The GFS set some of its own all-time record high skill for several metrics in the NH in Dec. 2021, followed by a (relatively) rough patch in January. For some perspective and from a high level, we continue to gain about a day of lead time per decade of development and implementation in global NWP.... It's interesting though, and as @Bob ChiII pointed out somewhere else, that doesn't always translate to the anecdotes, individual events, etc. 


    • Like 5
    • Thanks 3
  4. 20 minutes ago, psuhoffman said:

    But this is the fallacy that gets us into trouble. There is no continuity between runs. Next run is just as likely to shift the other way.  The better argument might be that perhaps the Gfs still struggles with phases involving multiple waves and chases convection or keys the wrong wave. It used to do that. No idea if it still does. 
     

    Frankly over the last 72 hours I fail to see how anything has changed much. The consensus is still about the same. Some of the players swapped sides or shifted here or there but still looks like the big storm potential is east of the bay on most guidance with maybe some very minor accumulations west of the bay. 

    It's a shame that we cannot get consistent simulations for an under-observed, highly chaotic, strongly nonlinear system with finite computing. I need a new career.

    • Haha 12
  5. 15 minutes ago, Ralph Wiggum said:

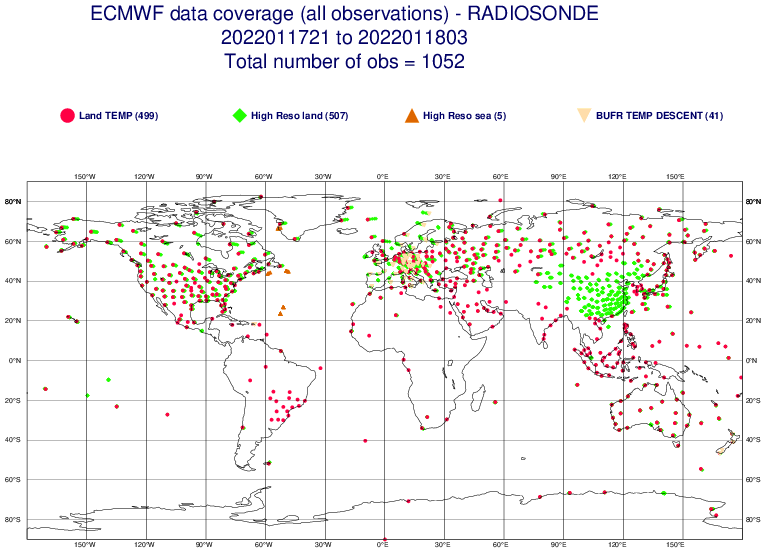
    Someone said the Europeans were struggling getting data because there was a shortage of weather balloons due to Covid. Can anyone confirm?

    No. [Edit to add] And if there is a sonde missing for ECMWF, there is a 99% chance it's missing for everyone.

    image.png.e1a8e2fa8e670e95bf85916adc7af544.png

    • Like 3
    • Thanks 3
  6. 43 minutes ago, IronTy said:

    I see the euro still has a SoMD special for the weekend.  When the GFS gonna fold?   The American empire has had its day.  Hey is there a Chinese weather model?

    Yes, it's called GRAPES: https://public.wmo.int/en/media/news-from-members/cma-upgrades-global-numerical-weather-prediction-grapesgfs-model-china

    39 minutes ago, BristowWx said:

    just hang your hopes on the sampling issue...that will get you through until its sampled then panic...does beg the question where does the euro get it's sampling data or is it just better at extrapolating...or none of those

    Every time someone mentions "sampling", I die a little inside. Almost all meteorological information is shared internationally....nearly all modeling centers start from the same base set of data from which to choose/utilize. There are two main exceptions: 1) some data is from the private sector and has limits as to how it can be shared, 2) some places aren't allowed to use certain data from some entities; e.g., here in the US we aren't allowed to us observations from Chinese satellites which isn't the case at ECMWF/UKMO, etc. There can be other differences that are a function of data provider, such as who produces retrievals of AMVs, GPS bending angle, etc. Generally speaking, differences is in how the observations are used...not in the observations themselves.

    4 minutes ago, Ralph Wiggum said:

    There was something posted yesterday saying the Tonga volcano screwed up some sensors the Euro uses for initialization data and they were unsure when those would be back online. Could this be the reason the Euro is on an island with this?

    No, see above regarding data. The signal that was in the "innovation" field, which is just the difference between a short term forecast and the observations. In this case, the signal is real as a result of the shockwave and showed up in certain observations that are used in NWP. I do not have it handy, but I bet we would see similar signals in other NWP systems for that same channel. Further, what was shown was just the information that went into that particular DA cycle and not the analysis itself. Even if that signal was put into the model, it would be very short lived....both in terms of that particular forecast but subsequent cycles. It has no bearing on the current set of forecasts.

    • Like 5
    • Thanks 5
  7. 50 minutes ago, CAPE said:

    Is this really a thing? Maybe a little sliver of hope for a better outcome for those along the Fall Line. East of there this thing is totally dead Jim.

    Mount Holly AFD-

    A lot of focus remains on the Sunday into Monday system. A deepening low pressure system coming out of the southeastern U.S. will lift NE into New England from late Sunday into Monday. We continue to see relatively good agreement with an inland track (if anything there appears to be a slight shift further west with the latest model runs). Although guidance has been quite consistent on this track the last several runs, my one hesitation is that this turn north is going to be dependent on a second mid level trough (currently over northern Canada) digging southeast over the western Great Lakes by Sunday. This trough timing may be important for the timing of the southern low taking a turn further north. While the models appear to be rather consistent with this feature, it is not yet within the upper air network or the usable range for GOES satellites. Therefore, I still have a bit of uncertainty. All that being said, it is hard to ignore the consistency of guidance on the track thus far, so forecast favors a track with the low generally following the I-95 corridor through our region.

    No. 

    • Like 1
    • Haha 3
  8. 1 hour ago, Ralph Wiggum said:

    Do the GEFS get the additional recon flight data like the GFS has been receiving?

    GEFS is initialized from the GFS analysis. The control for the GEFS is initialized directly from the analysis (interpolated to lower resolution). The members are then perturbed through combinations of perturbations derived from the previous GDAS cycle's short term forecast perturbations....all centered about the same control GFS analysis. So yes, recon data would impact GEFS through the GFS analysis.

    • Like 4
    • Thanks 13
  9. 2 minutes ago, psuhoffman said:

    When is the gefs getting the upgrade. They still waiting

    until the short range fv3 system is ready? 

    There is a plan for a "unified" gfsv17 and gefs13 upgrade. It is still a couple of years down the road but development is happening now. The ensemble upgrade is complicated by the reforecast requirement to provide calibration for subseasonal (and other) products.

    • Thanks 3
  10. Just now, psuhoffman said:


    It’s intriguing. It’s possible that the resolution is the culprit on the eps and geps but the issue for the Gfs is more to do with the outdated gefs. It is weird that the same phenomenon is showing on all 3 global systems. 
     

    @high risk: do you know since the upgrade how the ensembles score at this range compared to the op?  I think we’re still at a range the eps is slightly better than the euro op. 

    GEFS mean scores are statistically better than deterministic GFS for the medium range....but that has to come with all kinds of caveats (e.g. domain/temporally averaged, not necessarily applicable to individual events, etc.). 

    • Like 3
    • Thanks 8
  11. 1 minute ago, DCAlexandria said:

    Stop the storm is 6 days away, there's going to be massive shift

    what, why? models nail temperature forecasts to the degree, in complicated setups, at 6+ day lead times, all the time. oh wait....

    • Haha 10
    • Weenie 1
  12. 3 hours ago, WxUSAF said:

    I thought they were essentially abandoned years ago. I think the NAM has a planned sunset as well? @dtk?

    To this and the other question regarding next steps for HiRes guidance...

    1) NAM (including nests) are frozen.  They will be replaced in the coming years.

    2) SREF is also frozen (and now coarse resolution).  Effort is being re-oriented toward true high resolution ensembles.

    3) HRRR will include ensembles in the DA in 2020, but we cannot afford a true HRRR-ensemble.  The HREF fills some of this void in the interim.

    4) All of the above are going to be part of some sort of FV3-based, (truly) high resolution convection allowing ensemble.  We are still several years away as there is still science to explore for defining the configuration.  There's also serious lack of HPC for a large-domain, convection allowing ensemble.

    • Like 9
    • Thanks 12
  13. 2 minutes ago, cae said:

    I just took at look at FV3 bias scores... there still seems to be some room for imrpovement.  The below charts are for temps at 850 hPa and 1000 hPa (near sea level) over North America for the last month.  There's a similar bias for H5, but I'm not sure how meaningful that is.  The FV3 does well for H5 anomaly correlation, which I think is more important.

    Yes, the cool/low height bias with increasing forecast time is already well known and documented.  In fact, I am pretty sure there is already a fix for this particular issue, though it is too late to include in the Jan. 2019 implementation.

    • Thanks 1
  14. 6 minutes ago, WxUSAF said:

    @dtk tell us all why the superior physics and data assimilation techniques of the FV3 have locked in our snow here. Please? :ph34r:

    It's all part of our plan to get people to pay attention.  In reality, it is going to be dead wrong.

    5 minutes ago, usedtobe said:

    Daryl,  How do the FV3 scores compare with the GFS?  Right now I use it as another ensemble member.  

    This is a pretty solid implementation, considering that we haven't had a chance to put a ton of new science into the package (outside of the model dynamics and MP scheme, a few DA enhancements, etc.).   For things like extratropical 500 hpa AC, it has gained us about a point (about what we'd expect/want from a biannual upgrade).  Improvements are statistically significant. 

    I should caution, our model evaluation group has noted that there are times where the FV3-based GFS appears to be too progressive at longer ranges.  It's not clear how general this is and for what types of cases this has been noted.  

    • Like 4
    • Thanks 1
  15. 2 hours ago, pasnownut said:

    actually check that.  Hi risk and i were discussing the other day and he said that it is too big an undertaking and they dont have the resources to convert the GEFS to Fv3.  I think you'll have a new Op to stare at w/ same old GEFS for longer range viewing.  I'll dig back through my posts and see if i can find it.  Need more coffee/dramamine first.

    FV3-based GEFS will not be implemented until early FY 2020 (probably Q2...e.g. about Jan 2020).  Some of this is driven by human and compute resources as there is a requirement for a 30 year reforecast for calibration before implementation.

    1 hour ago, dallen7908 said:

    "Starting with the 00Z 19 December cycle, the FV3-GFS uses GFDL microphysics instead of the Zhao-Carr microphysics in the GFS."

    Saw this in the information (i) section of the FV3-GFS comparison site.  Is this referring to 2018 or 2017?


    Definitely 2017.  All official retrospectives and real-time experiment use the Lin-type GFDL MP scheme.

    • Like 4
    • Thanks 5
  16. 9 minutes ago, Jfreebird said:

    I have a question/questions.... just because I love crunching data lol and I see a few outlying members with Maria...   The ECMWF model Ensemble has 50 members.. Each of those members have a name IE EN01,EN02 etc....

    1. Are there Ensemble members that are more accurate than others?

    2. If so then what are they and where can you find a graph with the latest run that shows the ensemble members with their names?


    Thanks for everyone's knowledge and help

    A well calibrated ensemble prediction system will generate forecasts consistent with the probability density function associated with the forecast uncertainty/error.  While true that there will be members that perform well for any individual event, there are not members that are inherently more skillful on the average.  That is by design.  In fact, most ensemble systems use stochastic components to help represent the random errors in the initial conditions and subsequent forecasts.  This is true for single model ensembles like ecmfw eps and ncep gefs.  Multi model ensembles like the sref and Canadian eps are more complicated since they will have members that are more skillful based on the components within each member.

    • Like 1
  17. I build arguments and if it doesn't fit your preconceived notions about the climate system you folks hurl insults ad hominem attacks etc.

    The skeptical side in me is the scientist in me. None of what you folks on this forum have presented anything that would convince a skeptic like me that the world is in trouble from rapid climate change. I have said this before...I can see a maybe another 1c of warming spread out over at least 100 years or more....TCR. This would have minimal impact on the climate system. There is not enough land ice...glaciers... to abruptly change ocean currents which abruptly change climate. Below is a graph of the ice accumulation rate over Greenland from the ice core. The climate system was chaotic until the Holocene when the land ice disappeared.


    attachicon.gifGISP220k.png


    To think a trace gas that is a minor GHG will somehow throw this whole system out of balance is a stretch. Computer models give us an idea that if you increase an external forcing like CO2 you will get some warming. I agree with that. But the feedbacks?? Models are horrible with feedbacks....I use models almost everyday. I understand NWP well.... So to bet the farm on these climate models is like in winter putting forecast out for a major snowstorm 15 days from now for a major nor'easter because the models are indicating it. And then having making people prepare NOW!!!  This is why so many METS are skeptical of climate science forecasts.

    Weather modeling is fundamentally different than seasonal modeling, much less climate modeling.  Also, the fact that you use CFSR (CFSv2 ICs) to make some of your arguments makes me think that you do not in fact understand NWP and DA well.


    By the way, one of the reasons you see a significant change in the CFSv2 near surface temperature has to do with the fact that the model and resolution actually changed for the component that is used in the data assimilation cycling (from T382 to T574 spectral truncation).  The two changes that occurred were sometime in 2008 and then in late 2009, I think.  This has huge implications as the physics are not necessarily guaranteed to behave the same way, and the precipitation changes can lead to changes in surface hydrology and soil moisture.  In fact, I think NCEP may have even discovered an unexpected, significant change in the initialization of snow cover/depth after the 2009 modification which has H U G E implications for "monitoring" of T2m. 


    To clarify, the prediction model in CFSv2 remains frozen....the component that changed is the driver for data assimilation cycling.  This was done in an effort to be forward thinking with the end goal of merging GDAS and CDAS analyses in order to create a single set of coupled initial conditions for both weather and seasonal prediction.

  18. Coming from a software engineering background, I am curious what programming language most models are developed in? Also, what kind of computers are they using to process all of the algorithms?

    Almost exclusively FORTRAN (some C++). The NCEP operational computer as well as those at both the UKMet Office and ECMWF are IBM power clusters (6 for us, and 7 for them, I believe). NCEP is getting a new supercomputer in 2013, but the contract was just recently awarded and the details haven't been made available.

  19. I'm curious of the model maintenance. Throughout the various seasons, there's always discussion of "Model X does horrible for this type of system" or "Model Y always over overdoes the precipitation."

    How often are the algorithms and/or inputs tweaked? I'd think the owners of the models would want to adjust them as to not be so far off in certain situations.

    These numerical models are very complicated, nonlinear beasts. It's easy to say "tweak" something to target a particular problem, but these tweaks always have unintended consequences. Many things within the models themselves have feedback processes. For example, you can't modify things within the algorithms that handle cloud processes, without also impacting precipitation, and radiation, and surface fluxes, and....

    Now, we do in fact try to target problem areas. However, we can't just make modifications to the models on a whim (or very frequently). NCEP has a huge customer base, and many factions within have a say as to whether or not certain things can be changed. There is a very rigorous process for testing and evaluating changes prior to implementation, and it happens in many stages (and chews up a lot of resources). Because of the scope of what we do, and the amount of testing that needs to be done, we typically make changes to the major systems at most once/year.

  20. Which models have the best verification scores at the following time intervals before a possible event of interest?

    Best models 10 days before a potential event

    Best models 7 days before a potential event

    Best models 4 days before a potential event

    Best models 2 days before a potential event

    Best models 1 day before a potential event

    This is tough to answer actually since it really depends on the type of event/season, etc. For the day 9-10 range, you have to use ensemble. The deterministic models only score about 0.5 or so for 500 hPa height AC (generally, 0.6 is used as a cutoff to define forecasts that have some skill). Errors are large at this lead time.

    For days 4-7 (or so), ECMWF has higher scores than the other operational globals. The UKMet and GFS generally score 2nd behind the EC, with the Canadian behind that (especially days 6-7)..and then others even behind that. That's not to say there aren't occasions where the other models beat the EC, because it does happen. These metrics are also typically hemispheric, and each model has their own strengths/weaknesses by region, regime, season, etc. The EC is also less prone to "drops" in skill compared to the other operational models.

    I can't really comment much on the short range, though the ECMWF is going to be a good bet (you don't score well at day 5 without doing well at day 1). It's being run at high enough spatial resolution to take seriously for many different types of phenomena.

    Best sources of GFS ensemble maps?

    Fastest sources for updates of the Canadian models? Is it practical to find the GGEM out to ten days?

    Are ensembles of Canadian models useful and where is a good place to find those?

    What kinds of GFS ensemble maps are you looking for? We generate lots of products based on something called the NAEFS, which combines the GEFS and Canadian ensemble members.

    Why would you look at the GGEM out to ten days? Why would you look at any deterministic model out to ten days (other than for "fun")?

    The Canadian ensemble is extremely useful if you're familiar with it. It's the only major operational global ensemble that is truly multi-model (the GEFS and EC ensemble have parameterizations to mimic model/error and uncertainty)....along the lines of the SREF. That is not to say it is more skillful than the EC EPS and GEFS, however. I think that it is prone to being a bit over dispersive, (i.e. it can exhibit too large of spread on occasion).

    Help needed with model biases:

    I found this links but are there better sources for updated model bias information?

    Outdated, perhaps still useful:

    http://www.hpc.ncep....s/biastext.html

    http://www.hpc.ncep.noaa.gov/mdlbias/

    http://www.hpc.ncep....l2.shtml#biases

    The problems with these kinds of lists is that the models are updated fairly frequently.....meaning their biases change fairly often. As an example, the version of the GFS that we run now is nothing like the version we ran even as recently as two years ago. Too many myths exist about the models based on how things were ten years ago. I've tried to dispel some of the most egregious ones in other threads.

×
×
  • Create New...