
cardinalland
-
Posts
508 -
Joined
-
Last visited
Content Type
Profiles
Blogs
Forums
American Weather
Media Demo
Store
Gallery
Posts posted by cardinalland
-
-
4 minutes ago, psv88 said:
Down down to 73 and windy now in Miami. Changeover soon
changeover from kokomo to margaritaville impending
-
 2
2
-
 2
2
-
-
the exact number of inches is not gonna make a difference when everything is windswept and there are big fat drifts
-
looking forward to seeing some sick drift photos
-
i think 10-15 for the city with up to 20 down by the jersey shore and on LI, with overall ratios close to 10:1 or a little lower. could be wrong. enjoy the show i’m watching from afar.
-
3
-
-
thinking 4-8 right now. we’ve got most of the ingredients for a big one (50-50, cold enough air, well positioned trough and divergence, multiple pieces of energy). it’s not cold enough for good ratios though and no blocking means this thing is flying. that’s my 1am take
-
 1
1
-
-
it’s the zany 80s all over again. put on some van halen
-
3 minutes ago, TheSnowman said:
This is the 4th Storm this winter where I got absolutely Waxed by Southern RI; which has NEVER happened before.
It is also the 3rd Storm where I was Beaten by people South of me West of me and North of me and East of me. That…. THAT should be Impossible once. Let alone 3 times in a Winter.
rhode island is the smallest state. you can drive to another one if you’re disappointed
-
Snow globe outside in Durham NC
-
2
-
-
just changed over to snow in durham
-
1
-
-
15 minutes ago, WeatherGeek2025 said:
you can't compare last year with this year, not even close sir!
the prevailing synoptic pattern of this winter so far feels quite similar to the second half of last winter
-
1
-
-
1-2022 was teens in new haven at least
although drier air appears to be approaching the western edge of CT, I see signs of backfill.
-
5 minutes ago, shaggy said:
Yeah no models had this slow motion early on which is why they all showed the ULL pulling it onshore Monday night. At this point its so slow hunberto might be north east of it by the time it gets to the northern Bahamas amd yank it due east from there.
Pretty bad performance by the gfs and euro on this one
to be fair fujiwara is a pretty hard dynamic to work out, this setup was never gonna be an easy one
-
3
-
 1
1
-
-
every single site in the nyc micronet is at 99+ right now. 3 99F locations and the remaining 18 locations are at 100+.
-
1
-
-
Just now, Sundog said:
Back down to 99 for me after briefly going over 100
i don't think so lol, i don't have a station now but most of the ones near me are at 99 or 100
-
KNYC hits 99. honestly i'm in the neighborhood and I think that's p accurate for our high so far. highest temp at the park since 2012.
-
it's clouded up here in manhattan. i think we're done heating for today at about 96F near me. see you back here tomorrow
-
data from new haven airport KHVN. sea breeze has arrived there already.

-
1
-
-
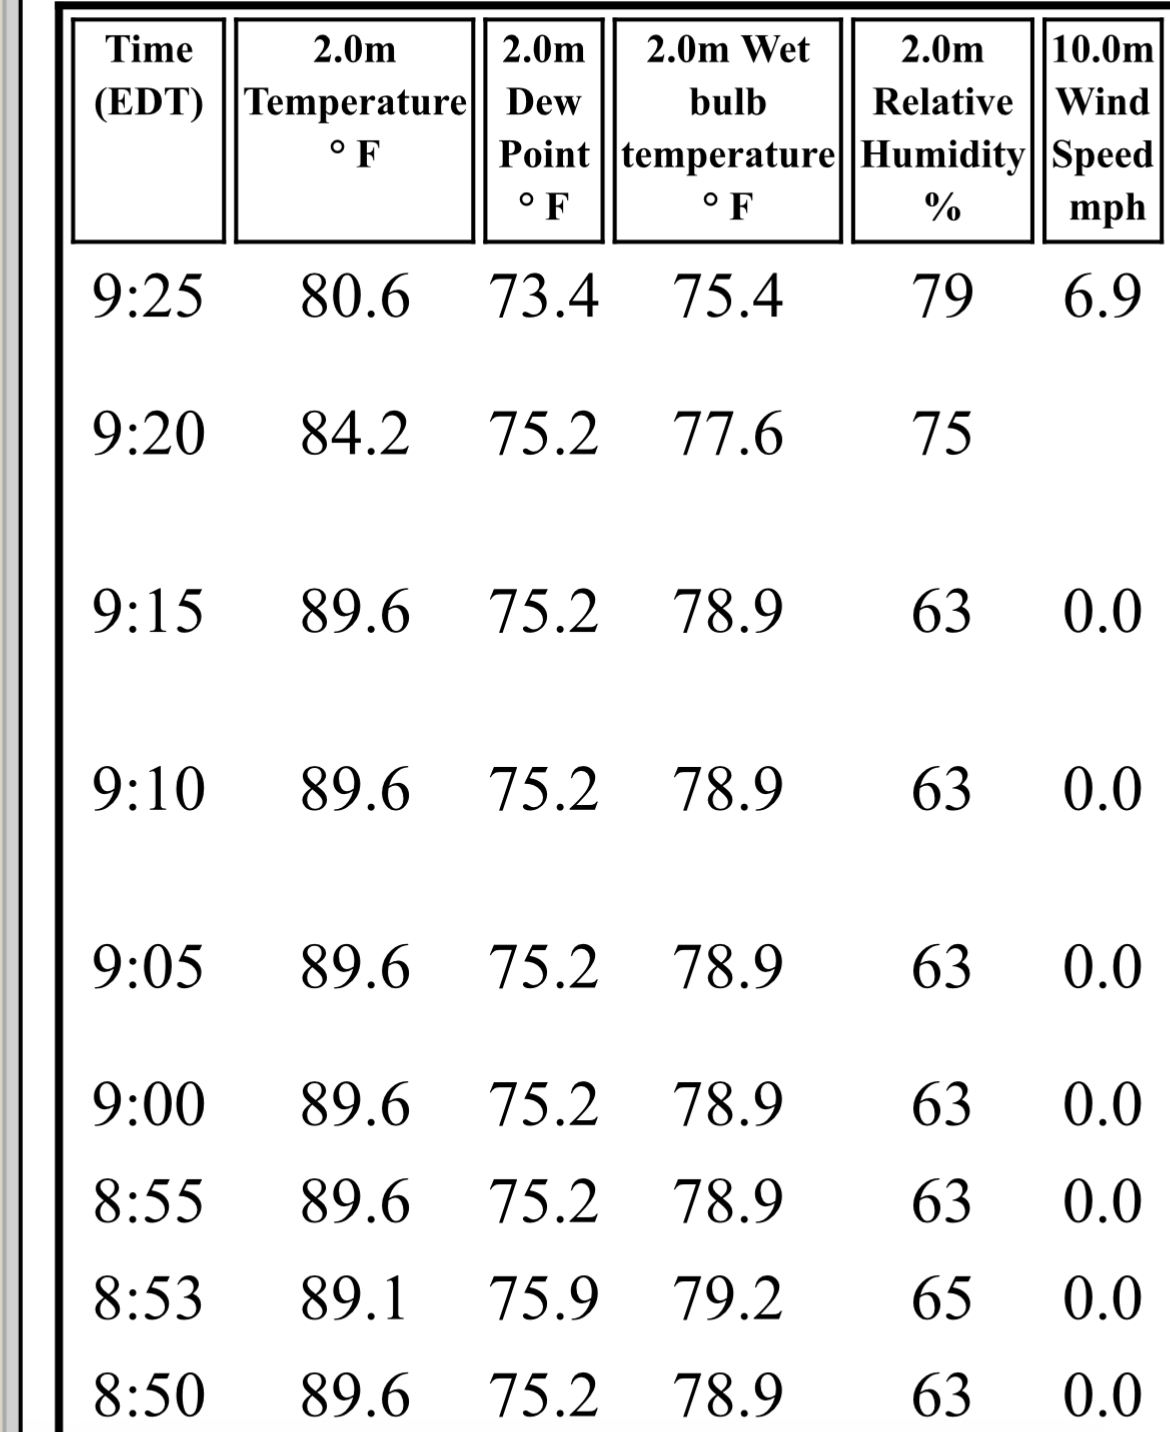
jfk currently 90/79 with a heat index of 106. and it’s not even 9am yet
-
 1
1
-
-
26 minutes ago, LibertyBell said:
Tony what was the high on August 16, did it stay in the 90s?
high of 86F, low of 74F
27 minutes ago, LibertyBell said:meh that 102 peak and 8 straight days of 95+ from 1944 really stands out, when you compute the average highs of both how do they compare?
Incidentally both 1944 and 1988 are part of the 11 year solar cycle (as were 1955, 1966, 1977, 1999, 2010).
Aug 1944 had an average high of 88.0F, Aug 1988 had an average high of 87.0F
-
1
-
-
-
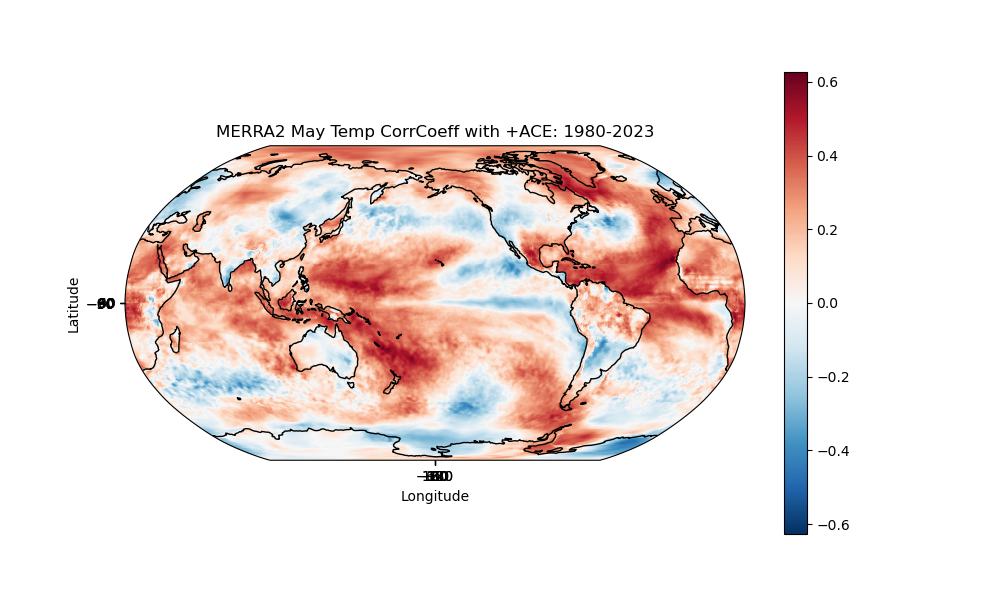 I had some free time today and decided to correlate Atlantic ACE with temperatures around the world for the month of May (which, over oceans, roughly correspond with sea surface temperatures.) One can see a strong positive influence from sea surface temperatures across the Tropical Atlantic, as well as the East Atlantic, Labrador Sea (hmm) and tropical West Pacific/Maritime Continent. Now there's definitely a lot of noise in here, but I found it helpful for my analysis. I also produced temperature correlation coefficients for number of TS/H/MH (didn't differ too much from this) and precipitation correlation coefficients (pretty much just noise, no trend.)
-
1
-
1
-
-
my analysis...
Factors in favor of a more intense hurricane season:
- warm Caribbean and waters surrounding Florida
- warm West Pacific and Maritime Continent
- negative PDO
- positive OHC anomalies around Caribbean and loop current
Factors in favor of a less intense hurricane season:
- a cool Tropical East Atlantic
- some modelling showing convergence aloft over Atlantic during hurricane season
Slightly above average sounds right to me. Things aren't screaming hyperactive like 2024 but the factors are slightly in favor of more storms. I'm feeling more homegrown seasons this season... not so many Cape Verde long trackers. Maybe near average ACE but slightly above average storm numbers. I'll write a storm # prediction in the thread at some point.
-
1
-
1
-
-
just got to stand on my porch saying "we needed this"
LFG
-
1
-
-
i think we should spring forward 3 hours when DST begins and stay there
"Don’t do it" 2026 Blizzard obs, updates and pictures.
in New England
Posted
the melts on here are hilarious when i have 13.4” on the season and it’s 65 degrees today.
it’s really incredible what’s going on in SE MA. that area can get skunked for years but when it gets nailed, it gets buried lol.