

dWave
-
Posts
1,903 -
Joined
-
Last visited
Content Type
Profiles
Blogs
Forums
American Weather
Media Demo
Store
Gallery
Posts posted by dWave
-
-
On 6/17/2025 at 5:48 PM, bluewave said:
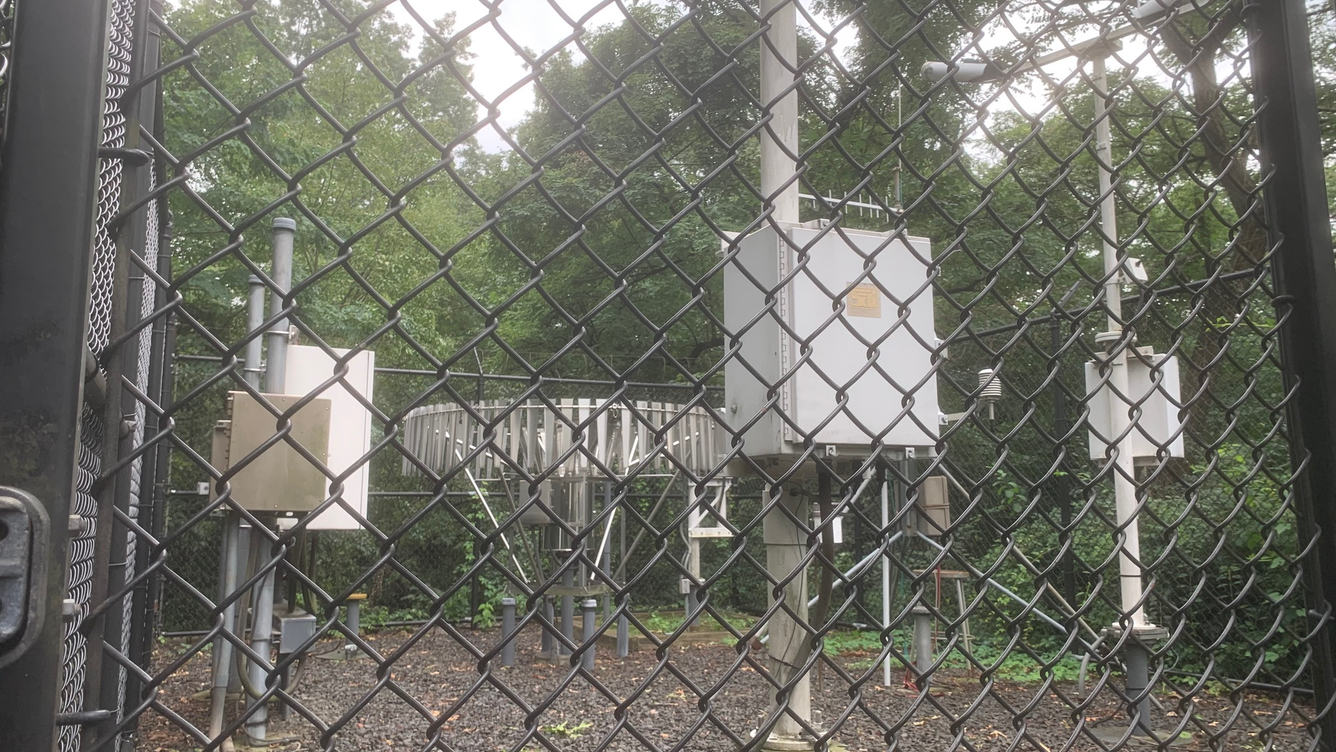
The decline of NYC 100° temperatures since the ASOS was installed under the trees in 1995 is all about the incorrect sitting and not about cycles.
2021

1921
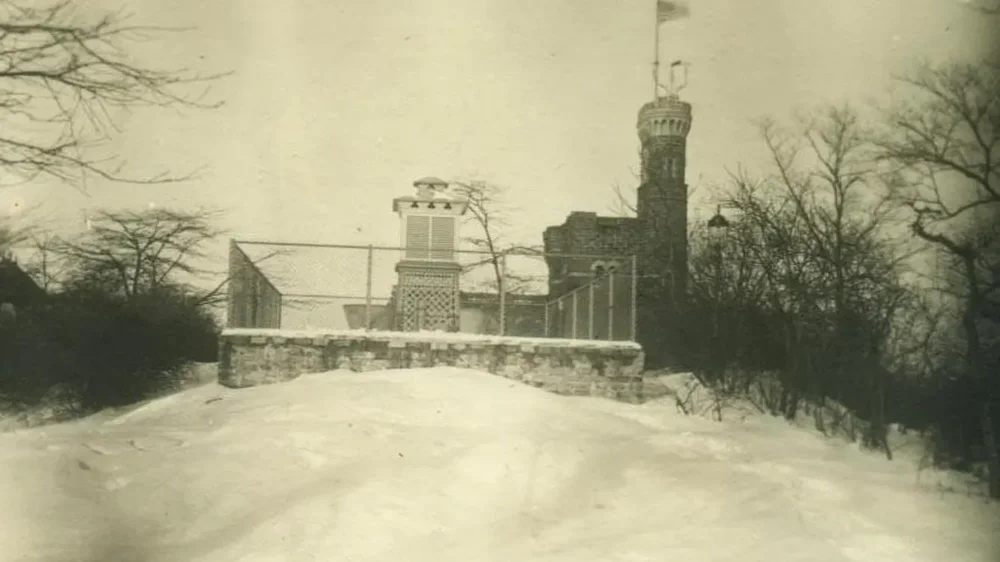
Yeah its bad, and last time I pass by there it was considerably worse than this. You can walk right past it but its so hidden now you may no idea anything is there unless you are really trying to find it.
Just standing there compared to being out and about where people actually live and its undeniable that it is an absurd representation of NYC.
-
 1
1
-
-
On 6/11/2025 at 10:11 AM, LibertyBell said:
where's JFK been heading?
JFK normals peak at 84/69.
-
1
-
-
11 hours ago, TheClimateChanger said:
Mean summertime high temperatures have risen by 2-3F since 1990. If that trend continues, average summer highs should reach the upper 80s around NYC by 2050, by which time, there should be a marked increase in the number of 90F days [similar to the observed increase in 85F days over the past several decades].
Normal highs already max out in the upper 80s. Since July daily averages are pretty flat, the avg high for the month is nearly the same.
87/72 at LGA
EWR 87/70
Teterboro 87/69
Meanwhile Central Park tops out at 85/71.
Philly 88/70
Down in DC they now have normals in July at 90...90/73
-
1
-
-
Quite the downpour with some hail in the Bx now
-
85/67 now after a low of only 74. Hazy sunshine, but brighter than yesterday at this time.
-
On 5/31/2025 at 12:56 PM, LibertyBell said:
I found the 8 day 95+ 1944 super heatwave
Note there was another heatwave before that which was 9 days long.
1953 was even more extreme with a 12 day super heatwave (our longest ever) and a 7 day heatwave, with 4 100+ temps (2 in each one lol.) Look at this torrid stretch in 1953 late August and early September 98, 99, 98, 100, 97, 102 lol.... it was sandwiched by two 94 degree days if those were each 1 degree higher it would have tied 1944 for longest streak of 95+. The streak in 1944 was 97, 102, 97, 96, 95, 95, 96, 95
2002 also had two long heatwaves, 9 and 8 days long. The 8 day one had a 5 day streak of 95+: 96, 95, 95, 96, 97 .... that was our last 5 day streak of 95+ and also our last heatwave of 7+ days!
The July 1993 10 day super hot streak (with 5 straight days of 95+ and 3 straight days of 100+: 98, 100, 101, 102, 97) I boldened was the hottest and longest heatwave I remember (I recall the July 1999 11 day streak too but it wasn't as hot as it was earlier in July when we hit 102 on back to back days.) One thing I do remember well about July 1999 was that it tied July 1993 for most 90 degree days in one month (20).
The 90s were known for these super heatwaves, 1991 had a 7 day heatwave with 5 straight days of 95+: 96, 99, 96, 100, 102. The year with the most 95+ days was 1955 with 16.
That July 1977 9 day super heatwave with 5 straight days of 95+ is also noteworthy: 96, 98, 97, 100, 102.... after a brief reprieve of 92 it shot back up to 104 (our second hottest temperature on record, now tied with July 2011) for the last day of the heatwave !!
Longest Heat Waves - 90 degrees + in a row(through March 10)DaysDatesTemperatures12
August 24 - Sept 4, 1953
91,91,91,94,98,99,98,100,97,102,94,90 11
July 23 - August 2, 1999
92,97,97,93,96,97,93,92,90,98,90 10
July 7 - 16, 1993
August 4 - 13, 189698,100,101,102,97,94,94,91,90,90
90,94,92,97,95,98,94,96,93,909
August 11 - 19, 2002
July 13 - 21, 1977
July 6 - 14, 1966
July 5 - 13, 194492,96,98,95,92,93,94,94,94
93,92,96,98,97,100, 102,92,104
91,93,91,91,91,94,99,101,95
93,94,91,94,92,91,93,93,918
July 29 - August 5, 2002
August 2 - 9, 1980
August 28 - Sept 4, 1973
August 10 - 17, 1944
June 26 - July 3, 190196, 95, 95, 96, 97, 90, 92, 91
91, 92, 91, 94, 93, 94, 96, 95
98, 95, 98, 94, 95, 94, 96, 93
97, 102, 97, 96, 95, 95, 96, 95
91,91,93,95,95,100,100,947
July 29 - August 4, 1995
August 9 - 15, 1998
July 15 - 21, 1991
July 12 - 18, 1983
July 7 - 13, 1981
August 1 - 7, 1955
July 15 - 21, 195393, 93, 91, 94, 96, 90,96
93, 93, 95, 94, 96, 99, 97
90, 93, 96, 99, 96, 100, 102
94, 93, 94, 98, 96, 93, 97
94, 95, 96, 93, 94, 94, 93
98, 100, 90, 95, 100, 97, 93
92, 97, 100, 101, 91, 90, 90We still have some impressive heat waves and hot spells if you look at urban sites not called Central Park. Such as LGA, EWR etc. If you got a 10+ day heat wave in the Park today it'd probably be catastrophic because the reality would much worse than that for people within the UHI.
-
8 hours ago, SnoSki14 said:
I never understood the unofficial start to summer for beaches in late May. Water is still very cold and temps can be very chilly too with any east wind.
To me the 4th of July weekend is the real start to summer.
Its just easy to frame it around two major holidays. Also, the amount of daylight contributes to the feel of summer or not. A lot more daytime to work with in June than mid to late August. Most colleges and some schools start in Aug, and places start to lose their seasonal employees too. There's only so much potential time to the summer window, cant afford to sacrifice any just because the early parts may not be reliably hot.
But I get it, in terms of beaches in this region I don't get too excited about it until July, mainly because of water temps.
-
22 hours ago, LongBeachSurfFreak said:
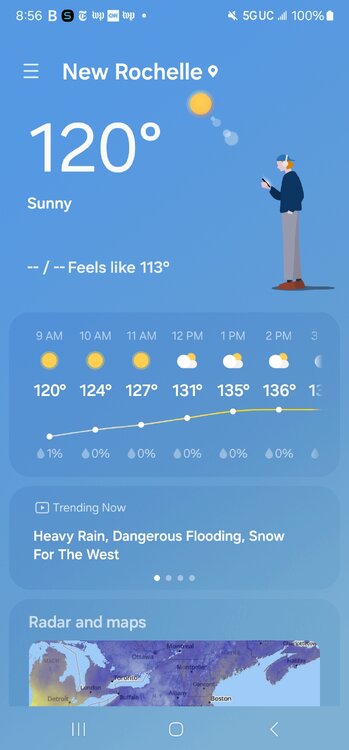
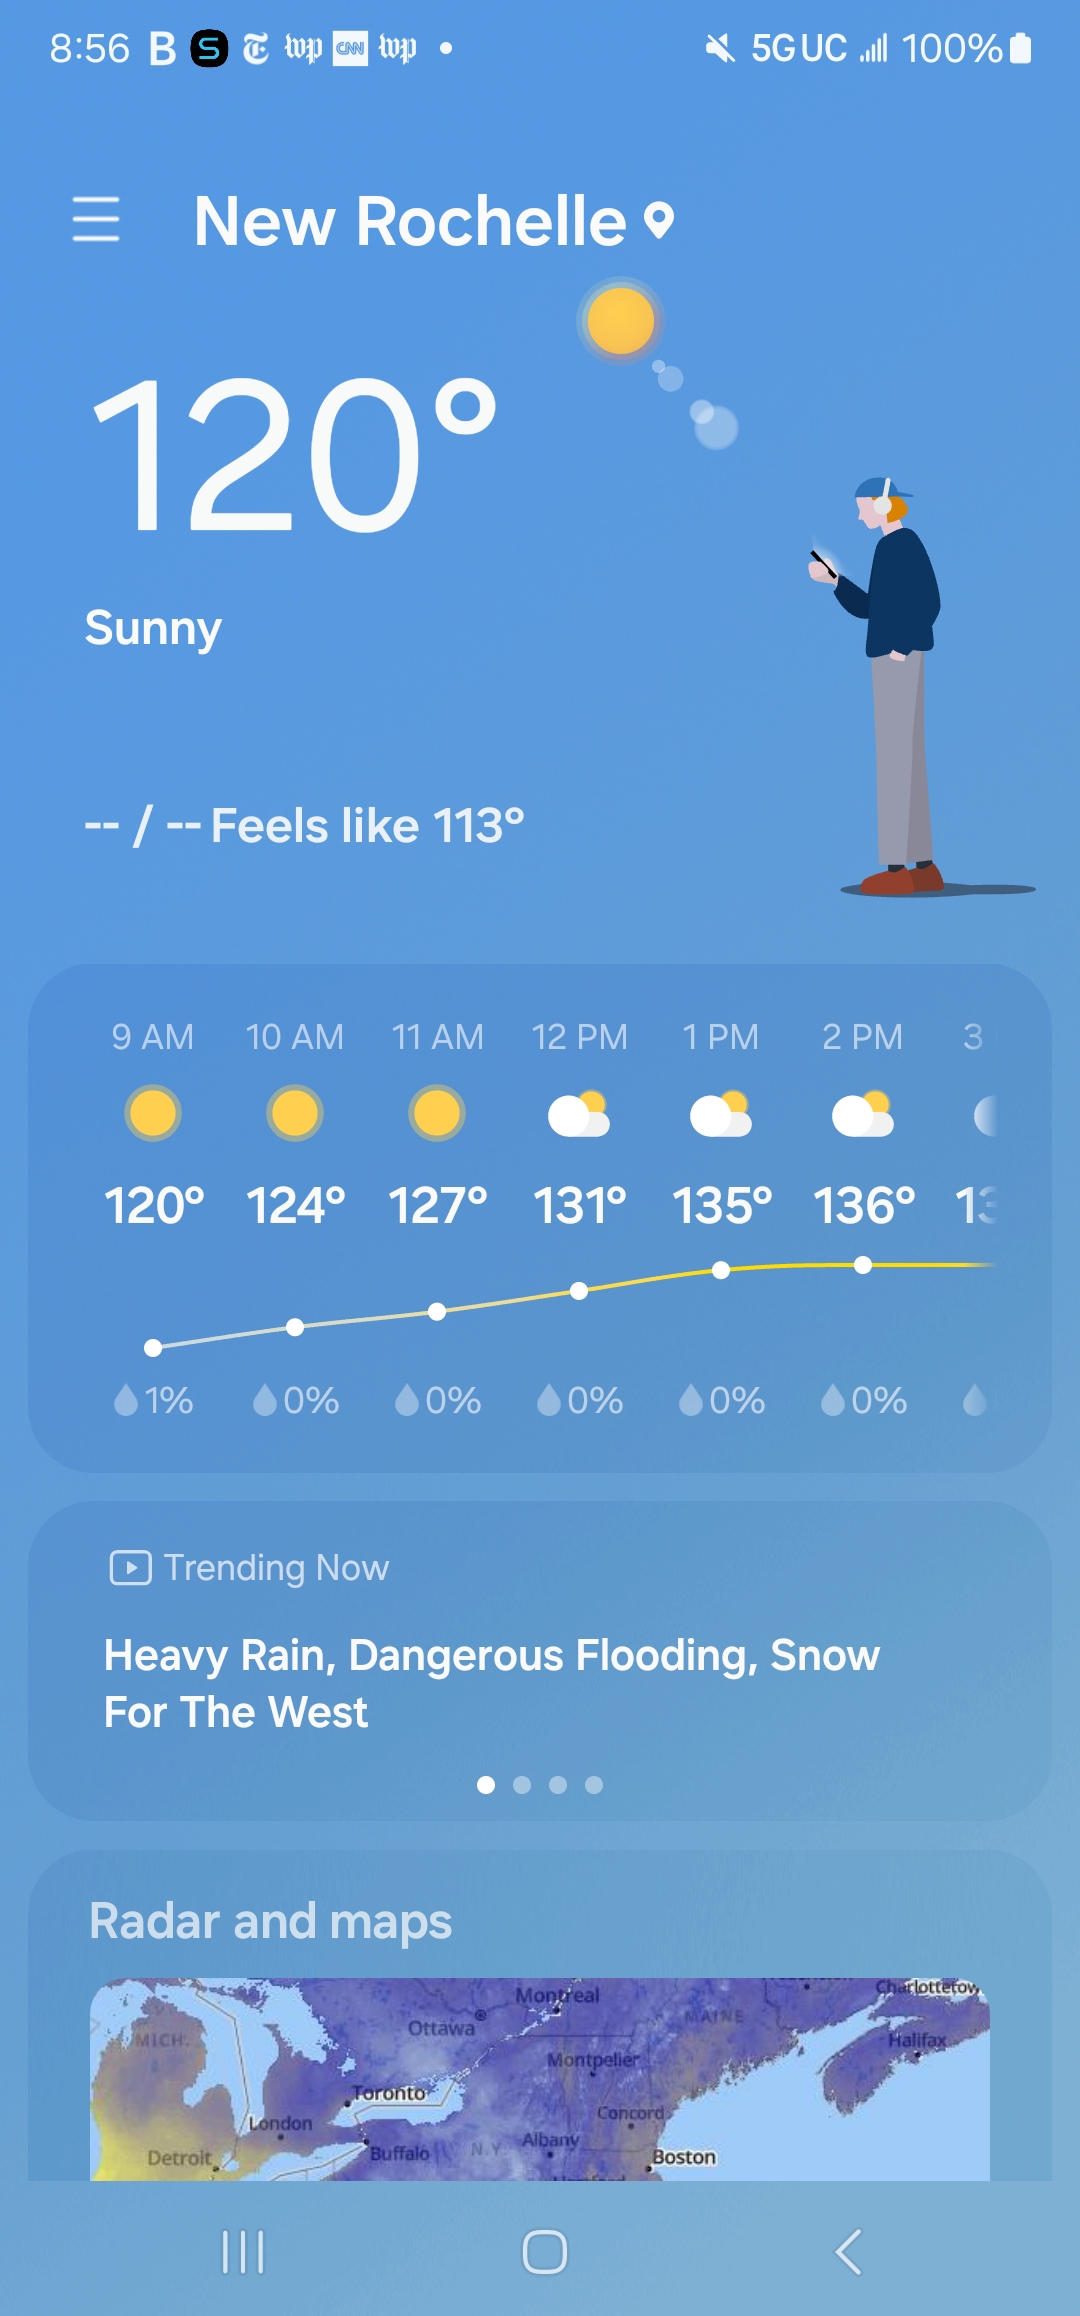
Lee Goldberg has mentioned the Park not being representative. But it’s still the go to for apps, which is where like 90% of people get their weather info now.
That's true. However apps tend to just point you to the closest offical reporting station, so they actually help deemphasize Central Park. If you in Manhattan and small portion of BK you'll see the Park, but more NYC residents will be directed to LGA and JFK. Some close in suburbs will get LGA/JFK as well. SI will get Newark numbers.
If i'm at home, apps show me LGA statistics/records and current conditions. Or some AI generated estimate based on LGA + attempts to show neighborhood microclimates. I only see Central Park on TV.
-
5 minutes ago, LibertyBell said:
They don't have the money to cut it huh?
I still don't see that heatwave from 1953 or 1993 ever being equaled. 102 in September is absolutely unreal lol.
It would take a microburst over Central Park taking out a bunch of trees.
-
 1
1
-
-
Quite the light show and about 0.8" rain in 15 mins
-
3 hours ago, Brian5671 said:
Ugh-that's miserable in the rain-we did it a few years back a few times-one year had off and on shower and cold.
I did it last year, the forecast was pretty bleak, but it didn't turn out so bad for people in the earlier waves. They finished basically rain free. Just cloudy and cool. Maybe some brief drizzle. When the rain did come it poured though. Still got soaked on the way home. For those who started later it must of sucked toward the end.
-
1 hour ago, winterwarlock said:
Dan Zarrow thinks there is still a shot we avoid the heavy rains as the system shifts further offshore. Hope he is right. No one wants gloom and days and days of rain
Working at the 5 boro bike tour I hope that's true for Sunday. Or at least limited to an occasional light shower.
-
1
-
-
Just now, Rjay said:
Lga 79 to 48 in an hour is wild
Being outside at the time it felt like most of that drop was in 60 secs
-
3
-
-
Most sudden and dramatic temp drop I may have ever experienced. On my bike felt like 80 to 50 in an instant. A warm wind became a strong cold one and it was a wrap. I could see the shock on people's faces.
-
1
-
-
10 hours ago, Krs4Lfe said:
JFK is usually the lowest of the 3 climate sites, I expect that to be reflected by this storm as well. It’s funny because the way NYC is spread out, I feel like they are all equally accurate for their respective areas. JFK is usually indicative of south shore Queen/BK, Staten Island. Central Park is usually indicative of Manhattan and Bronx. And LaGuarida is usually indicative of the city’s largest borough, Queens. So I guess they each have some value but Central Park definitely under measures most of the time
Yeah I agree they all have their place. For me, in the Bx I find I tend to match up with LGA better, espically when E to NE winds are a big factor. It better captures any Sound influence which will effect some eastern areas of the boro as well. It's also significantly closer to me than CPK (as the crow flies), it's easier to get in the same snow bands etc. LGA obs on avg are actually more similar year round, especially in Spring with back door cold fronts.
-
2
-
-
Been snow and sleet the whole time, looks around 3". Now changing to more of a freezing rain/sleet mix atm. 30F
-
1
-
-
8 hours ago, weatherpruf said:
Any thoughts on the crisis at NOAA and how this will affect forecasts?
If there is data of interest to you, better download it while you can, especially anything climate change related. NOAA pages are dissappeaing right now.
-
Switched to snow..maybe a little sleet mix. 39
-
-
1 hour ago, LibertyBell said:
meh the sun is starting to come out now, I guess that's the end of that.
I hear people shoveling outside lol
That's a new and unfamiliar sound....
Yeah feels like forever since I had to use a shovel. Snow actually stuck on pavement too which makes it feel like a real snowfall. A lot of the paltry snow totals of the last 2 years were grassy surfaces acclumation only. It matter for statistics but in urban areas, outside of a walk in a park, it's effectively 0"
-
1
-
-
Pleasantly surprised, 2" of snow. Its been a long time.
-
2
-
-
Was a burst of snow/graupel. Patchy coating on some rooftops and a few trees, now changed to mostly rain and washing away. 37
-
Good morning..apparently the forecast has changed. Dry ground heats up. Well it was nice while it lasted

-
1
-
 4
4
-
 1
1
-
-
Here comes a new plume of smoke headed south from a fire in Inwood Hill Pk

June 2025 discussion-obs: Summerlike
in New York City Metro
Posted
Thunder is non stop, I assume for those storms 25 miles away in Rockland/NJ border. Sounds like its right here though