

drstuess
-
Posts
167 -
Joined
-
Last visited
Content Type
Profiles
Blogs
Forums
American Weather
Media Demo
Store
Gallery
Posts posted by drstuess
-
-
Am I reading the announcement today correctly? Microwave (SSMIS) will no longer be available?
https://www.ospo.noaa.gov/data/messages/2025/2025-06-include.html
Sent from my SM-S901U using Tapatalk -
On the topic of forecast accuracy, gfs forecast for the waves today has been as bad/off as I have seen in a while. This is comparing the buoy (line trace) to the latest GFS forecast for now. South swells often are late, so see if it fills in, but horrible so far.

Sent from my SM-S901U using Tapatalk -
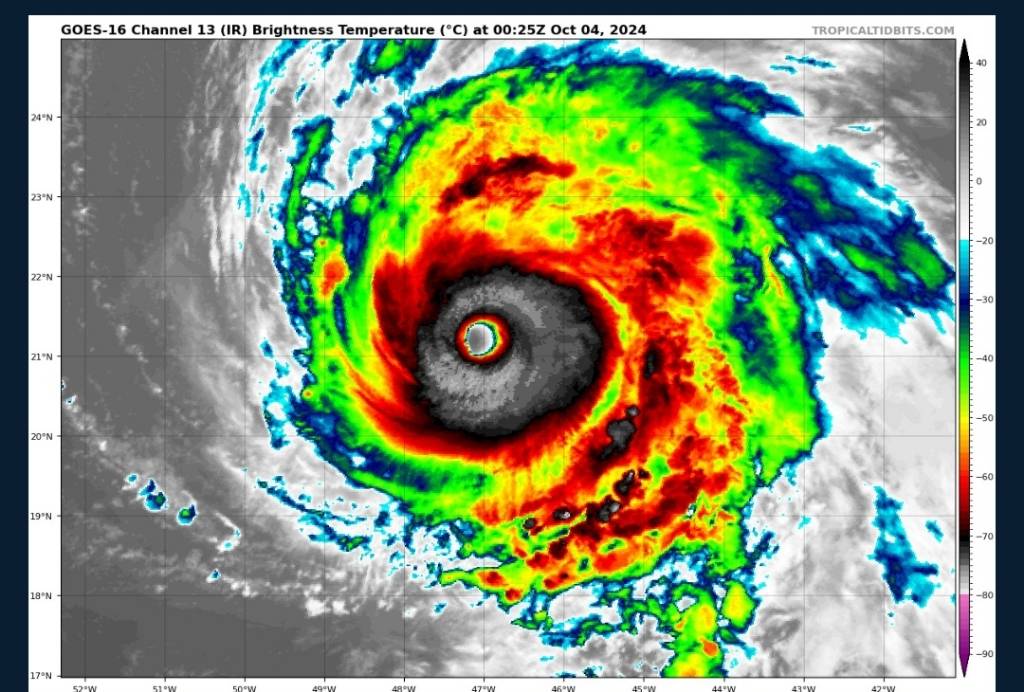
Godspeed our avian friendsAn all timer of a VDM.
912mb
158kt FL wind peak
Severe turbulence in the NW & NE eyewall
11°C temperature difference in eyewall
Flocks of birds observed in the eye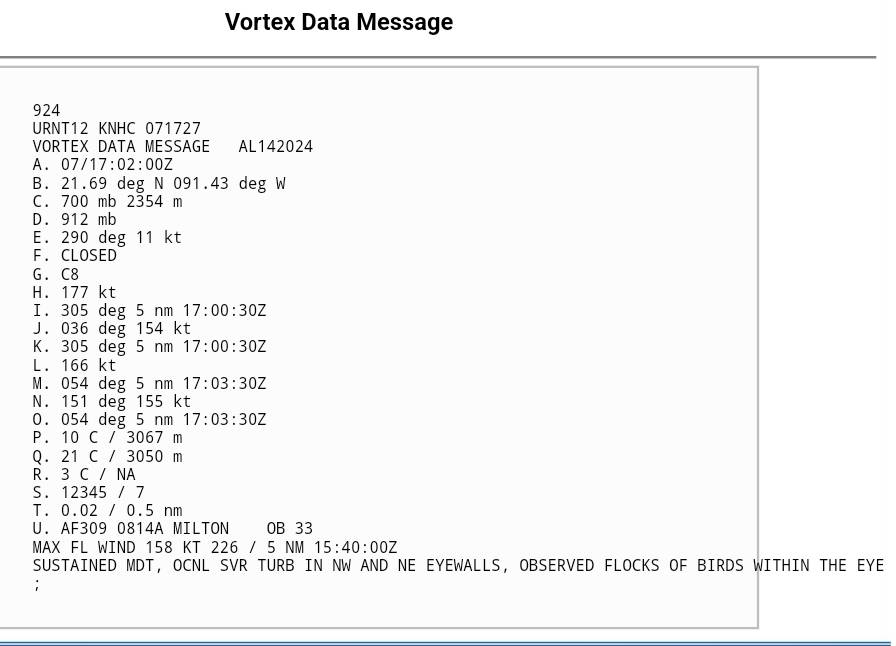
Sent from my SM-S901U using Tapatalk
-
 4
4
-
-
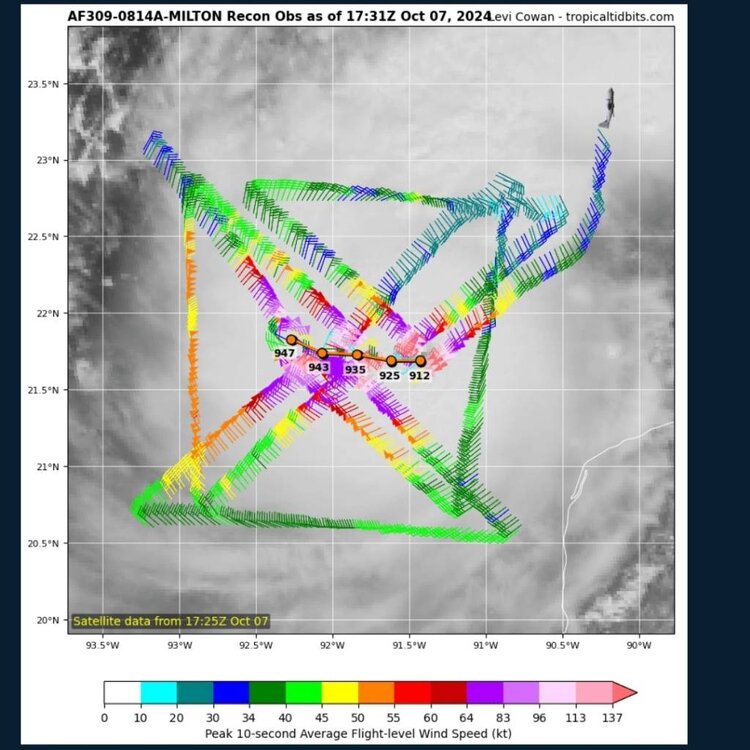
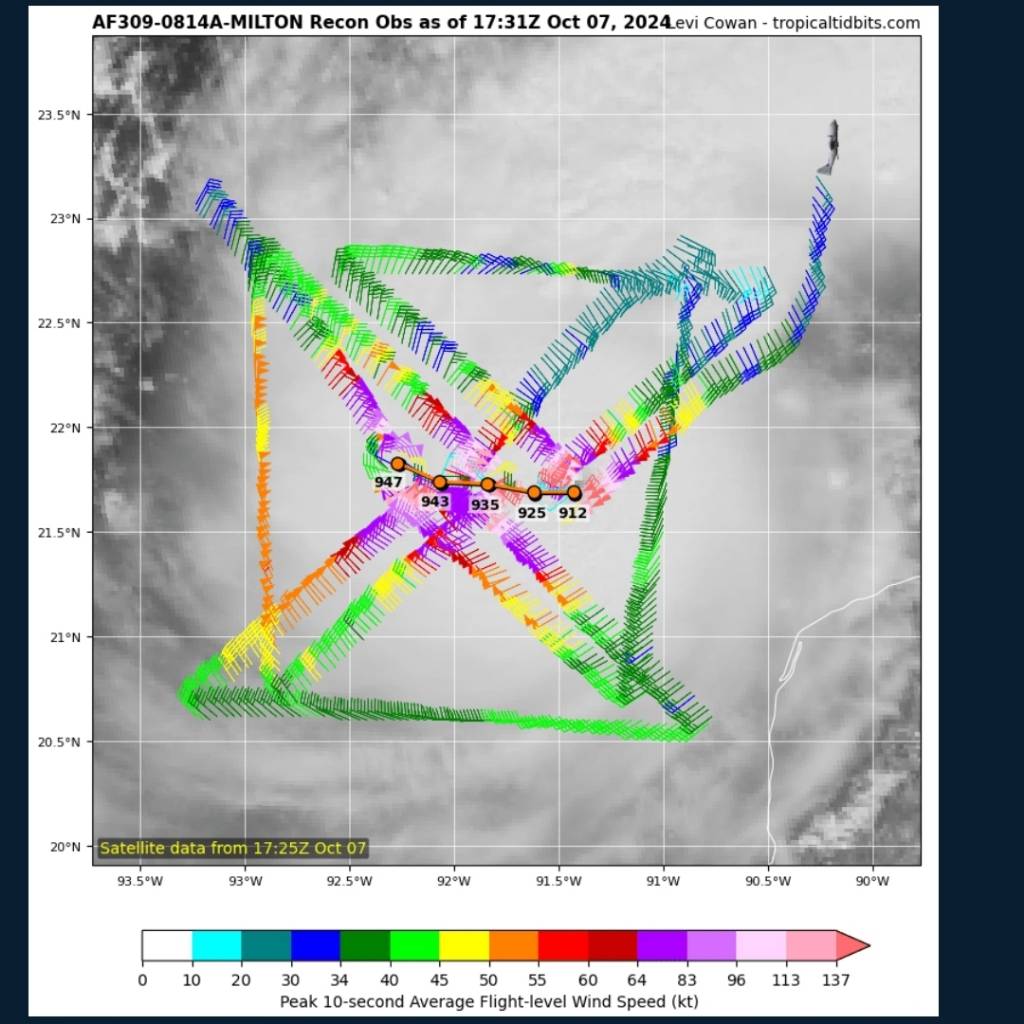
35 mb drop in 4 HH passes is nuts.
Sent from my SM-S901U using Tapatalk-
1
-
-
Captain Kirk promoted to Major. That is a pretty cane.

Sent from my SM-S901U using Tapatalk-
1
-
-
Issac popping a pinhole eye way out in the middle of nowhere.
Sent from my SM-S901U using Tapatalk -
Radar blowing up in Southern RI. Getting dark out
Sent from my SM-S901U using Tapatalk -
Hail here was solid. I did not get outside and grab any pics, but my neighbor sent these over this morning.

And this from local fb
-
6
-
-
Some pretty good hail in Southern RI. Just stuck my hand out the bedroom window and got smacked pretty good
Sent from my SM-S901U using Tapatalk-
 1
1
-
 1
1
-
 1
1
-
 2
2
-
-
Portland gauge at 14.37 ft which is above the 1978 record it seems.
Sent from my SM-S901U using Tapatalk-
2
-
-
Ocean and buoys not nearly as angry as earlier in the week. Wate levels pretty high though. Within half a foot of the "record" for that station, but note there are 3 Preliminary" values in the last 4 weeks above the "record".

Sent from my SM-S901U using Tapatalk -
Ocean and surge is angry. From Matunuck

Sent from my SM-S901U using Tapatalk-
2
-
-
Block island buoy getting up there this am. Trying to recall if there was another winter stretch like this where we seem to hit > 20 ft every week.

Sent from my SM-S901U using Tapatalk -
FWIW buoys of OBX running a touch above the GFS wave outputs.

Sent from my SM-S901U using Tapatalk-
1
-
-
Walked the dog in the rain in Narragansett. Maybe a few pingers, but pretty wet.
Sent from my SM-S901U using Tapatalk -
Thank you, i really appreciate it. I dont want to put words in your mouth, but applying your comments to the probabilistic maps, you think the NWS 10% high end maps showingWell .. not trying to be a wise ass buuut, nothing's "locked" in a 72 hours in a 'needle thread' pattern.
subtle movements in the last 18 hours can move a rain snow line N or S by 40 mi, can short term bust a forecast.
That said, the air mass on the front side of this thing is cold. The DPs even out over the low GOM waters are I think that fights back as we get into the 36 hour window and we start seeing models collapse to a chillier boundary layer.
I think the correction vector on the thermal is on the cold side for this one, but out of deference to the model... the short answer to your question has to be no - not locked in.
And sorry I used "locked in" a bit loosely, I just wanted to understand the likelihood.
Sent from my SM-S901U using Tapatalk
-
Are P-type issues locked in for S coast RI? I am seeing people run with those 10:1 maps, but NWS 10% high end map is still ~1 inch. If so, people probably are in for some disappointment.Good ...maybe it'll translate to less warm intrusion during the first half of this thing for NYC-CT-RI
Sent from my SM-S901U using Tapatalk
-
Mid next week would be another big wave maker for the southcoast. S fetch down to the bahamas. Beaches are taking a beating.

Sent from my SM-S901U using Tapatalk-
1
-
-
Pvd hit ~9 ft, or about 5 feet above the predicted high tide. 1938 was 12.67 feet above sea level. Overall looks like maybe #3 overall, and somewhere between once a decade and once a century?Have you seen any storm surge numbers for yesterday . I figured some south facing coasts saw a decent rise east of center .
Sent from my SM-S901U using Tapatalk
-
1
-
-
Maybe McGulps will weigh in, but biggest seas I have seen in RI. Novelty waves breaking way up the bay and Block buoy was 30' all day. Ocean is mean.
Sent from my SM-S901U using Tapatalk-
1
-
-
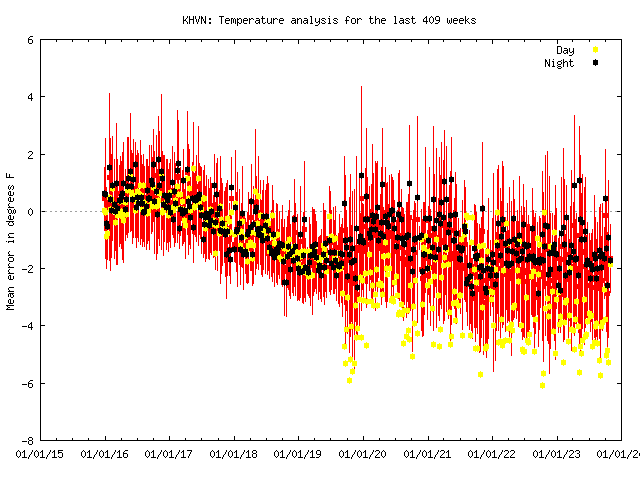
Out of curiosity, does this mean it is too high or too low? OP was saying he thought it was too high, but I would interpet negative errors as too low?Looks pretty questionable the past few years...but might not be enough for them to flag it like ORH....if it stays within 2F of their calibration tools, they don't change it....an unnerving fact we all found out last year when discussing KORH.
Sent from my SM-S901U using Tapatalk
-
2018 late october did have a rocking noreaster though. Night of the Ocean Mist Halloween party. Sox won. Building shaking with each wave hitting and water shooting up between the floor boards.2021. Lashing for AEMATT
Sent from my SM-S901U using Tapatalk
-
5
-
-
I was being sarcastic regarding post, hence the "average=sum". Adding /s si you don't lump me in with the poster I was quoting.So, if you were to hand-draw a CONUS surface temperature chart with isotherms, you're telling me that the temperature would go *up* the more stations I have? News to me.
Sent from my SM-S901U using Tapatalk
-
No, they just take the cumulative value across the stations. Everyone knows average = sum. /sHow exactly does a denser number of reporting stations make it warmer?
It's odd that any Joe would "comprehend" more reporting stations as causing higher readings, when that statement does zero refutation to the idea that more reporting stations could also make colder - if/when and fairly going by that same [faux] logic.
Sent from my SM-S901U using Tapatalk
2025 Atlantic Hurricane Season
in Tropical Headquarters
Posted
I dont want to take something out of context, but reads like that.
FNMOC site is down (although someome saodnthat was down after inauguration).
https://www.fnmoc.navy.mil/tcweb/cgi-bin/tc_home.cgi
Sent from my SM-S901U using Tapatalk