

blizzard1024
-
Posts
1,073 -
Joined
Content Type
Profiles
Blogs
Forums
American Weather
Media Demo
Store
Gallery
Posts posted by blizzard1024
-
-
1 hour ago, skierinvermont said:
I've made this very simple yet very important point 5 times now blizzard. It clearly refutes any theory that your or Spencer or Anthony Watts (lol) come up with that ENSO is responsible for OHC increases. Until you address it is quite clear you are not here to engage genuinely.
Plus you assume that we can measure ocean temperatures with precision needed for OHC. That started really with the Argo floats in 2003. the data gets coarser and less reliable the farther you go back, especially before the satellite era. You seem to have problems with radiosonde data ; well I would say ocean temperature data is rife with inconsistencies, measurement errors etc too. BUT if it supports increasing CO2 = warmer Earth, it is accepted. If it doesn't, then it can't be correct. What about clouds huh? The NASA cloud project shows an inverse relationship between global average temperature and cloud fraction between 1983-2009. This suggests clouds modulate the climate system or have a significant effect. Why is this ignored too? This whole CO2 is the Earth's temperature control knob is on shaky ground and that is why you become so belligerent. You can't have a reasonable debate because you are insecure about this whole theory. So you attack and become angry. Chill out. Life is good....
-
1 hour ago, skierinvermont said:
Except the authors of surface temperature datasets have documented why they believe their adjustments produce a highly accurate result, whereas the authors of the radiosonde data do precisely the opposite. They explicitely state that they have little confidence in their own data.
Citing radiosonde data is to ignore the cautions of the authors of the data. It makes no sense and is another example of Christy's intellectual dishonesty. It's like me making some best guesses about the temperature in my hometown over the past year and then you holding it up to the whole world as some sort of gold standard for temperatures in Denver. It's called lying.
Christy and Spencer are heros in the climate debate. So is Dr Curry. Brilliant and courageous people who are standing up for real science.
-
1 hour ago, donsutherland1 said:
A paper on the performance of the climate models:
https://agupubs.onlinelibrary.wiley.com/doi/full/10.1029/2019GL085378
This paper suggests a TCR of 1-2C for a doubling of CO2. That seems reasonable and is in line with the observations. Theoretically speaking a doubling of CO2 should produce a modest warming within this range with neutral feedbacks. Its the 3-6C projections that I think are out of the bounds of reality. The Oceans provide too much of a buffer.
-
So reanalysis datasets are bad then too because they rely on upper air soundings. So the only records that are valid are the one's that are heavily "homogenized". Of course this introduces a massive warming trend in the data. That is very convenient. Like I said, in climate science the conclusion is CO2 is causing warming and all the research is to support that conclusion. This is backwards.
-
41 minutes ago, bdgwx said:
Unfortunately, the historical radiosonde measurements are plagued by numerous changes in instrumentation, observing practice, and time of observation that lead to nonclimatic changes in the archived measurements
This is exactly like the surface temperature data which is the gold standard to many.
-
54 minutes ago, bdgwx said:
I don't see how you can say UAH is the best. What dataset/model are you comparing UAH to to assess its "bestnest". And why did you select that dataset/model for comparison to begin with? Why not just call that chosen dataset/model the best?
RSS used to use a GCM to make diurnal bias corrections. The academic community criticized them for it. They changed their methodology in this regard in v4. The warming trend went up. Perhaps the GCM method was more correct afterall? (see Mears 2017).
Karl did not adjust SSTs upward. He gets SSTs from ERSST (see Karl 2015). I read the ERSSTv4 papers (see Haung 2015 part 1 and part 2 and supplemental). Now, understanding that I'm not an expert, I did not see any adjustments documented that I felt were mistakes. In fact, quite the opposite. I think it would be a mistake to omit these adjustments and not publish v4 of ERSST. BTW...I believe ERSST is now up to v5. And GISTEMP and others also uses ERSST as well.
I don't know about the early 1800's but at least since the 1880's the unadjusted data show MORE warming; not less. (see figure 2B Karl 2015). And again...show me a dataset/model that you feel best characterizes reality so that we can make objective comparisons between it and UAH (or any dataset really). Justify why you think that chosen dataset/model best characterizes reality.
UAH doesn't retain data from NOAA-14 which has a warming bias. Also UAH agrees best with radiosondes and reanalysis vs the other datasets.
.thumb.jpg.101b28ce4193731659e8623496926325.jpg)
-
read this paper on climate models...
https://judithcurry.com/2020/06/20/structural-errors-in-global-climate-models/#more-26311
-
48 minutes ago, donsutherland1 said:
Here is a key finding from a relevant paper that removed the impact of ENSO:
We analyze five prominent time series of global temperature (over land and ocean) for their common time interval since 1979: three surface temperature records (from NASA/GISS, NOAA/NCDC and HadCRU) and two lower-troposphere (LT) temperature records based on satellite microwave sensors (from RSS and UAH). All five series show consistent global warming trends ranging from 0.014 to 0.018 K yr−1. When the data are adjusted to remove the estimated impact of known factors on short-term temperature variations (El Niño/southern oscillation, volcanic aerosols and solar variability), the global warming signal becomes even more evident as noise is reduced.
https://iopscience.iop.org/article/10.1088/1748-9326/6/4/044022
The fatal flaw in this paper is that it ignores the UAH data in its conclusion which is the best dataset. RSS uses NOAA-14 which has a known warming bias. Plus they use a model to calculate the diurnal drift factor instead of empirical data. Hence RSS diverges closer to the really flawed surface dataset around 2015. Just like Karl et al 2015 adjusted SSTs upward using faulty methodology to enhance warming. If one looks at my climate division from NCEI, the unadjusted datasets i.e the actual measurements show NO trends since the late 1800s. The adjusted shows 3F rise. So all the global warming is man made by adjustments not the real data. UAH is the closest to reality showing modest warming well within the bounds of the holocene. Nothing unusual.
-
49 minutes ago, skierinvermont said:
At least the skeptics back when I was in college had the intellectual honesty
your anger in your posts shows that you are insecure about your position related to the whole CO2 CAGW viewpoint. I am totally secure in my position. Basic physics. Not computer models and analyses based on computer models that have a high degree of uncertainty.
-
33 minutes ago, donsutherland1 said:
Here is a key finding from a relevant paper that removed the impact of ENSO:
We analyze five prominent time series of global temperature (over land and ocean) for their common time interval since 1979: three surface temperature records (from NASA/GISS, NOAA/NCDC and HadCRU) and two lower-troposphere (LT) temperature records based on satellite microwave sensors (from RSS and UAH). All five series show consistent global warming trends ranging from 0.014 to 0.018 K yr−1. When the data are adjusted to remove the estimated impact of known factors on short-term temperature variations (El Niño/southern oscillation, volcanic aerosols and solar variability), the global warming signal becomes even more evident as noise is reduced.
https://iopscience.iop.org/article/10.1088/1748-9326/6/4/044022
This is counter intuitive to me. We had two major volcanic eruptions one in 1982 (El Chicon) and Pinatubo in 1991 early in these records and we have had three intense El NInos 1983, 1998 and 2015. How can removing all this lead to a strong warmer trend? Volcanos cool the atmosphere and strong El Ninos warm the atmosphere. I will read in more detail. Thanks.
-
3 minutes ago, skierinvermont said:
Sure the data post 2003 is better. But the data pre-2003 is also fairly reliable. Sure you can look at 2003-present. We could also look at 1998-present. Or 1992-present.
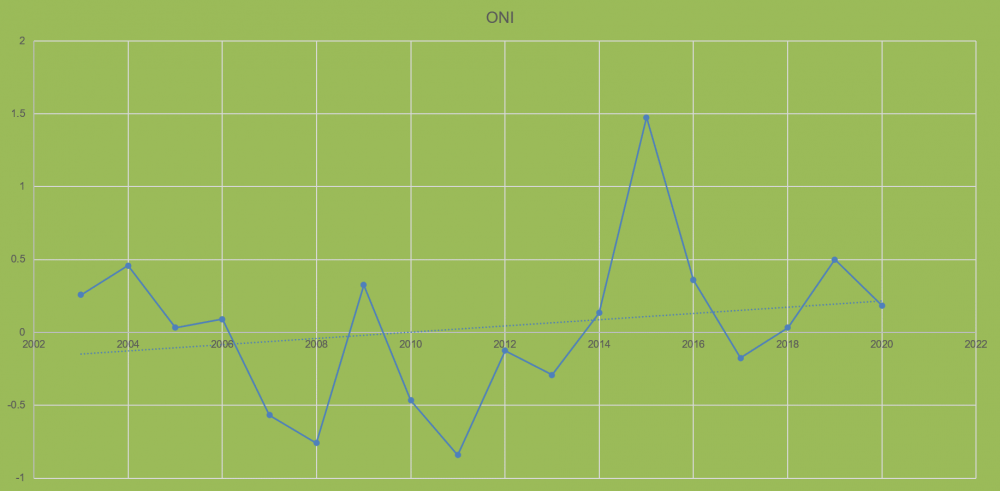
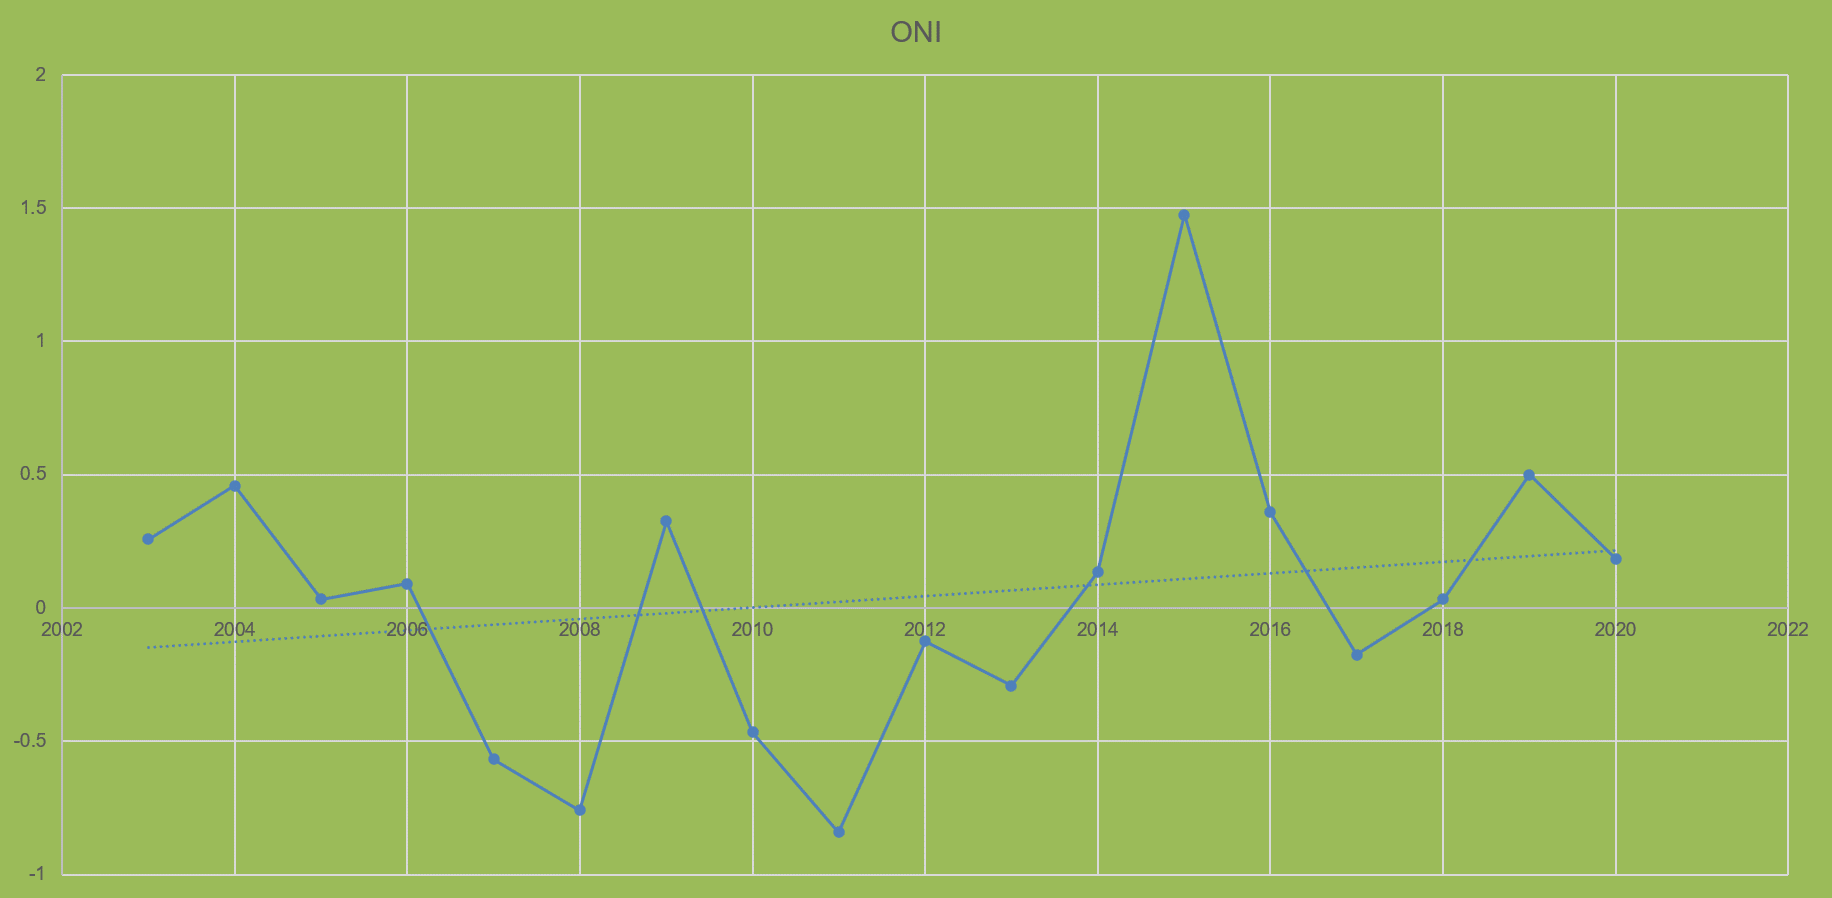
Or if you suddenly will only use only post 2003 data (without providing any evidence that pre-2003 data is fatally flawed) we can still pick periods with negative ONI trends.
2003-2013 had an extremely negative ONI trend. Far more negative than ANY of the trends you've cherrypicked. And yet the OHC trend over that period is VASTLY positive.
We can go on, we can pick countless start and end dates with negative ONI trends and positive OHC trends. All of these disprove your 'hypothesis'. It only takes one to disprove it. But there are many that disprove it.
On the other hand, the CO2 theory is consistent with all of these observations.
What you are forgetting here skier is that it doesn't cause an automatic response in the Earth's temperature OHC there is a lag too.... to be truthful we need more data from the Argo floats to make any conclusions. This easily could be a cyclical trends in OHC.
-
Okay....follow my logic. Argo floats deployed in 2003. Very reliable much higher resolution dataset. Data for deep oceans before this is suspect. So using this new dataset which is the most comprehensive we see ONI or a tendency for more El Ninos, and, indeed OHC from the Argo floats has increased. Before 2003, one can say the data is of lower quality. Before the satellite era of the 1970s the data was even poorer in quality. Hence starting in 1970 (satellite era) or starting in 2003 (Argo data) makes sense and is not cherry picking. The tendency for more El Ninos leading to a warmer planet makes sense meteorologically and climatologically. Maybe CO2 causes more El Ninos? I know that has been stated (of course). But whatever the cause the increase in El Ninos likely is a major player in the warmth of the planet recently.
-
Just now, skierinvermont said:
Again, you are cherrypicking start dates.
Many start dates show a negative ONI trend. And yet over all periods the OHC trend is vastly positive. This is the lack of genuine engagement and the deceptive behavior I am referring to.
This isn't an 'opinion' of yours. Deliberately picking start dates to avoid the point I have already spelled out for you is a lack of genuine engagement.
I told you I started when the argo floats were deployed in 2003 so you can assume much better OHC data. it wasn't a random date. if the data showed negative I still would have posted it.
-
4 minutes ago, skierinvermont said:
Clearly you've never studied biology if you think drugs in the body are basic science.
I'll concede there are good models and bad models. Models have to be used within the means for which they were designed and within the limits of their capabilities. You've presented nothing to show you've done any analysis of these models and why the scientists who have put much research into them are mistaken.
You've presented nothing more than an emotional appeal to 'its just a model!!' As bdwx pointed out this appeal is baseless. Models are routinely used for incredibly complex systems with great utility.
I don't know much about biology I will give you that. How many times does a drug end up causing unknown side affects or other problems? anyway, I have been using atmospheric models for more than 30 years and I know the inherent problems with them. The atmosphere is a high non-linear system very hard to model.
-
 1
1
-
-
2 minutes ago, skierinvermont said:
Lots of other start dates would show a negative trend. And yet over all time periods OHC trend is vastly positive (other than maybe picking a very short 1 year period).
But we are talking about OHC since the 1970s. We don't have a good handle on OHC really before the Argo floats but I will let that go. Let's try 2003-present after the Argo floats are active and you will see a tendency toward more El Nino ish conditions which is known to warm the planet.
-
15 minutes ago, bdgwx said:
I trust models to predict the location and timing of solar eclipses.
I trust models to predict the behavior of drugs in my body.
I trust models to predict how solutions to engineering problems will behave before those solutions are implemented so that I don't waste time and money.
I trust models to produce temperature readings from RTDs and thermocouples.
I trust models to produce satellite images of clouds and water vapor.
I trust models to forecast hurricane track and intensities several days out.
I trust models to forecast severe weather outbreaks.
Everyone trusts scientific models and even bets their lives on them on a daily basis.
We calibrate our trust based on the ability of the model to explain and predict observations. Invoking a model is not something to be ashamed of. It is something to embrace because if you aren't invoking a scientific model then you're just guessing.
Okay. First the top 5 you have are pretty basic science and not as complex as the climate system.
Number 6 hurricane tracks several days out...now you are pushing it. There is tremendous uncertainty several days out and the hurricane center uses probabilities to determine risk. If the probability is greater than 10% of death and destruction, i.e the consequence is very high people evacuate. Rapid intensification, interaction with mid-latitude waves and extratropical transition are not well modelled.
Number 7 you are pushing even way more. There are many instances where severe weather outbreaks don't materialize. we don't have a full understanding of CAPE vs shear and the balances needs plus dry air and other variables. There have been many busts here.
Number 8 climate models are extremely uncertain.
-
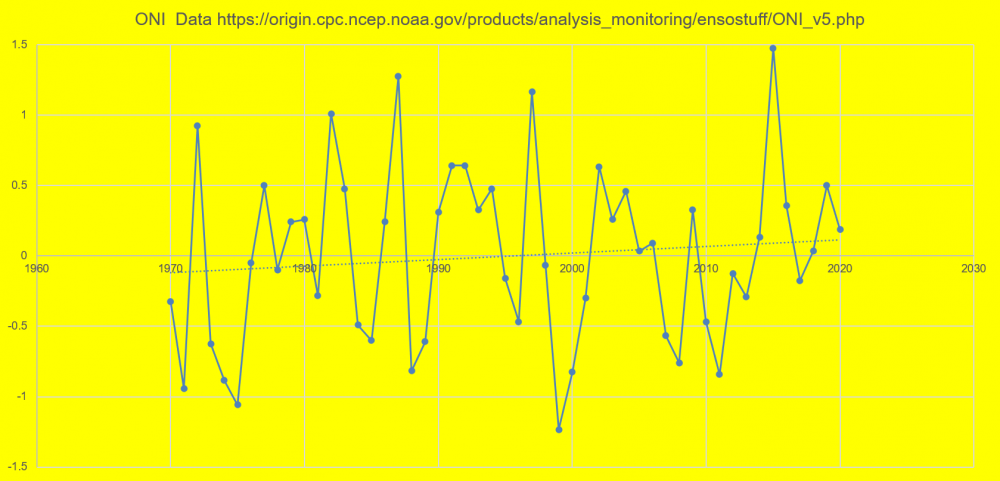
The ONI actually has a positive trend since the 1970s... data source https://origin.cpc.ncep.noaa.gov/products/analysis_monitoring/ensostuff/ONI_v5.php
-
2 minutes ago, skierinvermont said:
ENSO doesn't increase OHC. By warming the ocean's surface, and thus radiating more heat to the atmosphere, OHC decreases during ENSO.
Plus the ONI trend since the 1970s is essentially zero.
Yes you are correct. But more El Ninos lead to more tropical convection. This leads to more water vapor at high altitudes increasing the Earth's temperature and indeed an imbalance.
-
11 minutes ago, donsutherland1 said:
Argo floats, satellite measurements of solar irradiance, satellite measurements of ice melt, etc. all provide data for measuring the energy imbalance.
Yes the argo floats begin in 2003, the satellite data for ice begins during the late 70s a known cool period of the 20th century. Of course there easily can be a cyclical imbalance. Again I am not being disrespectful. I just don't agree. That's all. All of you are obviously passionate and smart people.
-
Just now, skierinvermont said:
My statement had absolutely nothing to do with what has happened in the past.
Propose a mechanism, other the CO2, to cause a .87W/m2 imbalance.
ENSO cycles. Since the late 1970s we have had stronger El Ninos vs La Ninas. This would easily increase OHC in a cyclical fashion. The 1970s had predominately strong La Ninas. Now we are seeing stronger El Ninos. Also there hasn't been a major volcanic eruption in almost 30 years. The 1960s, 80s and early 90s had major eruptions. Plus the clean air act has reduced soot and other pollution in many western societies which thermometer data is dense. This had led to warming. Regional changes in forest cover. Ocean current changes. The Sun. The sun reached a grand maximum in the 20th century and it is waning now. There is a lag since the sun heats the oceans significantly vs IR radiation. Cooling could be on the way this century. There is so much more to natural variability that is understudied because the tail wags the dog in climate science. It is assumed CO2 is the thermostat so all papers and studies have to show this or show how today's warming is unprecedented. They even adjust temperatures upward recently and downward in the past. Anything that proves CO2 is the driver of the climate. They have a conclusion so now the research is done to back it up. This is backwards IMO. Respectively- Blizzard1024
-
1 minute ago, skierinvermont said:
My statement has absolutely nothing to do with climate models. The warming of the whole earth system is based on data. Nothing else with a radiative effect in our atmosphere has changed to cause such an imbalance, except CO2.
So you know what the Earth's climate has been like for the Holocene? last 2000 years? Proxy data is coarse and can't be stitched to high resolution real measurements with accuracy. You can invoke statistics but you can get what you want when playing with stats. How do you know today's climate is unusual? We don't have enough data to understand ocean temperatures or land temperatures more than 100 years and really more than 60 years ago.
-
1
-
-
1 minute ago, donsutherland1 said:
Great point regarding the energy imbalance. The recent paper revealing the energy imbalance had an error bar of 0.12 w/m2. That the earth has already experienced dramatic and sustained warming is evidence of that imbalance. The idea that a significant imbalance might not exist (be an error) is implausible.
When the Earth's OLR is around 239 W/m2 explain to me how .87 w/m2 is significant? especially if the oceans are absorbing most of it?
-
48 minutes ago, skierinvermont said:
For the oceans to warm by that much the earth must have a large and persistent energy imbalance. The only plausible cause of such an imbalance with any evidence is CO2.
You can't say this unless you invoke a climate model. Maybe you trust models, I don't.
-
6 hours ago, skierinvermont said:
Opinions are one thing. Repeating right wing lies that have been disproved a thousand times over are entirely another. Any remotely genuine engagement on the topic would be entirely a different matter and deserve a more engaged response. Anybody with an ounce of respect for the truth, science, human or environmental health wouldn't be repeating disproved falsehoods ripped straight from right wing disinformation sources. This isn’t some mr Rogers fairy land where everyone gets to have an opinion just because they were born. The truth and a rigorous disciplined pursuit of it is what counts.
One group is presenting facts and peer reviewed science. The only response is 'it's the oceans!!!' and a bunch of other lies. There is no genuine search for the truth. There is no discussion to be had with such an individual.
Where do you get "right wing" lies from? I am not a right winger by no means. I am a realist on the climate system and its inherent uncertainties and complexities. It is NOT all figured out like many seem to think. Even the Earth's heat imbalance, .87 W/m2? We have a very hard time measuring with any certainty the solar constant and other heat flows. This could easily be in error. The Ocean heat uptake is not a problem at all. If you do the math it shows that the increase in OHC equals a whooping .04C! That means that the oceans can continue to take up heat and stabilize the climate system. Anyway I could go on here but I won't.
.jpg.868c7bb92ea98c8db4a5e2de387d478d.jpg)

Phoenix Records its Hottest Summer on Record
in Climate Change
Posted
Are you serious? Come on. Millions of peoples are not dying due to climate change. That is a big stretch. Are you ok?