
bdgwx
-
Posts
1,500 -
Joined
-
Last visited
Content Type
Profiles
Blogs
Forums
American Weather
Media Demo
Store
Gallery
Posts posted by bdgwx
-
-
2020 has eclipsed 2016 as the warmest year in the GISS record strictly speaking. But it was of the thinnest of margins and qualifies as a statistical tie.
-
 1
1
-
-
Dr. Spencer posted documents containing the official seal of the Office of Science and Technology Policy on his blog under the direction of David Legates. These documents represent the views of a whos who list of contrarian scientists.
http://www.drroyspencer.com/2021/01/white-house-brochures-on-climate-there-is-no-climate-crisis/
These documents are disinformation at best. They certainly don't represent "the current state-of-the-science on various topics of climate change" as Legates claim. In addition the OSTP did not grant approval to disseminate these documents. It is not even clear they were aware of their existence until now.
https://www.washingtonpost.com/weather/2021/01/11/controversial-climate-skeptics-release-papers/
Edit: Apparently the documents are also hosted by the Center for Environmental Research and Earth Sciences.
https://www.ceres-science.com/content/climate_change_flyers.html
Edit: David Legates and Ryan Maue have both been relieved of their duties in regards to the OSTP over this.
https://www.washingtonpost.com/weather/2021/01/11/controversial-climate-skeptics-release-papers/
Edit: NOAA has issued a statement regarding the matter.
-
Copernicus released their final monthly report for 2020.
https://climate.copernicus.eu/surface-air-temperature-december-2020
2020 is the second warmest year in their record after 2016.
-
1
-
-
Per NSIDC the annual mean extent in 2020 was 10.160e6. This breaks the previous record of 10.163e6 set in 2016.
-
 3
3
-
-
2 hours ago, Vice-Regent said:
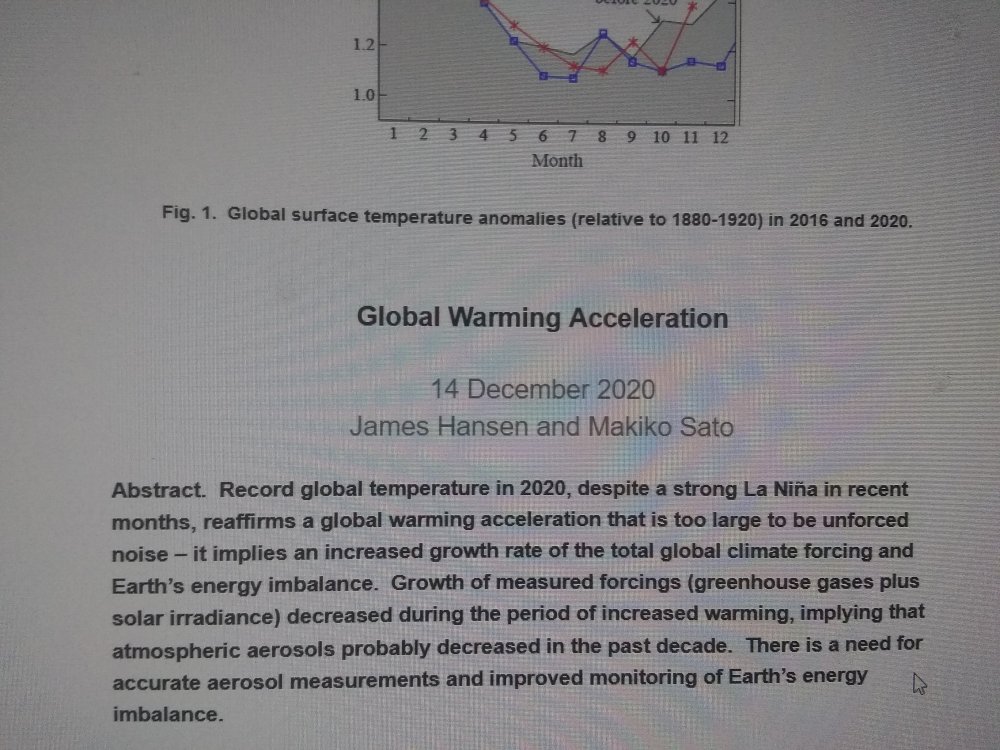
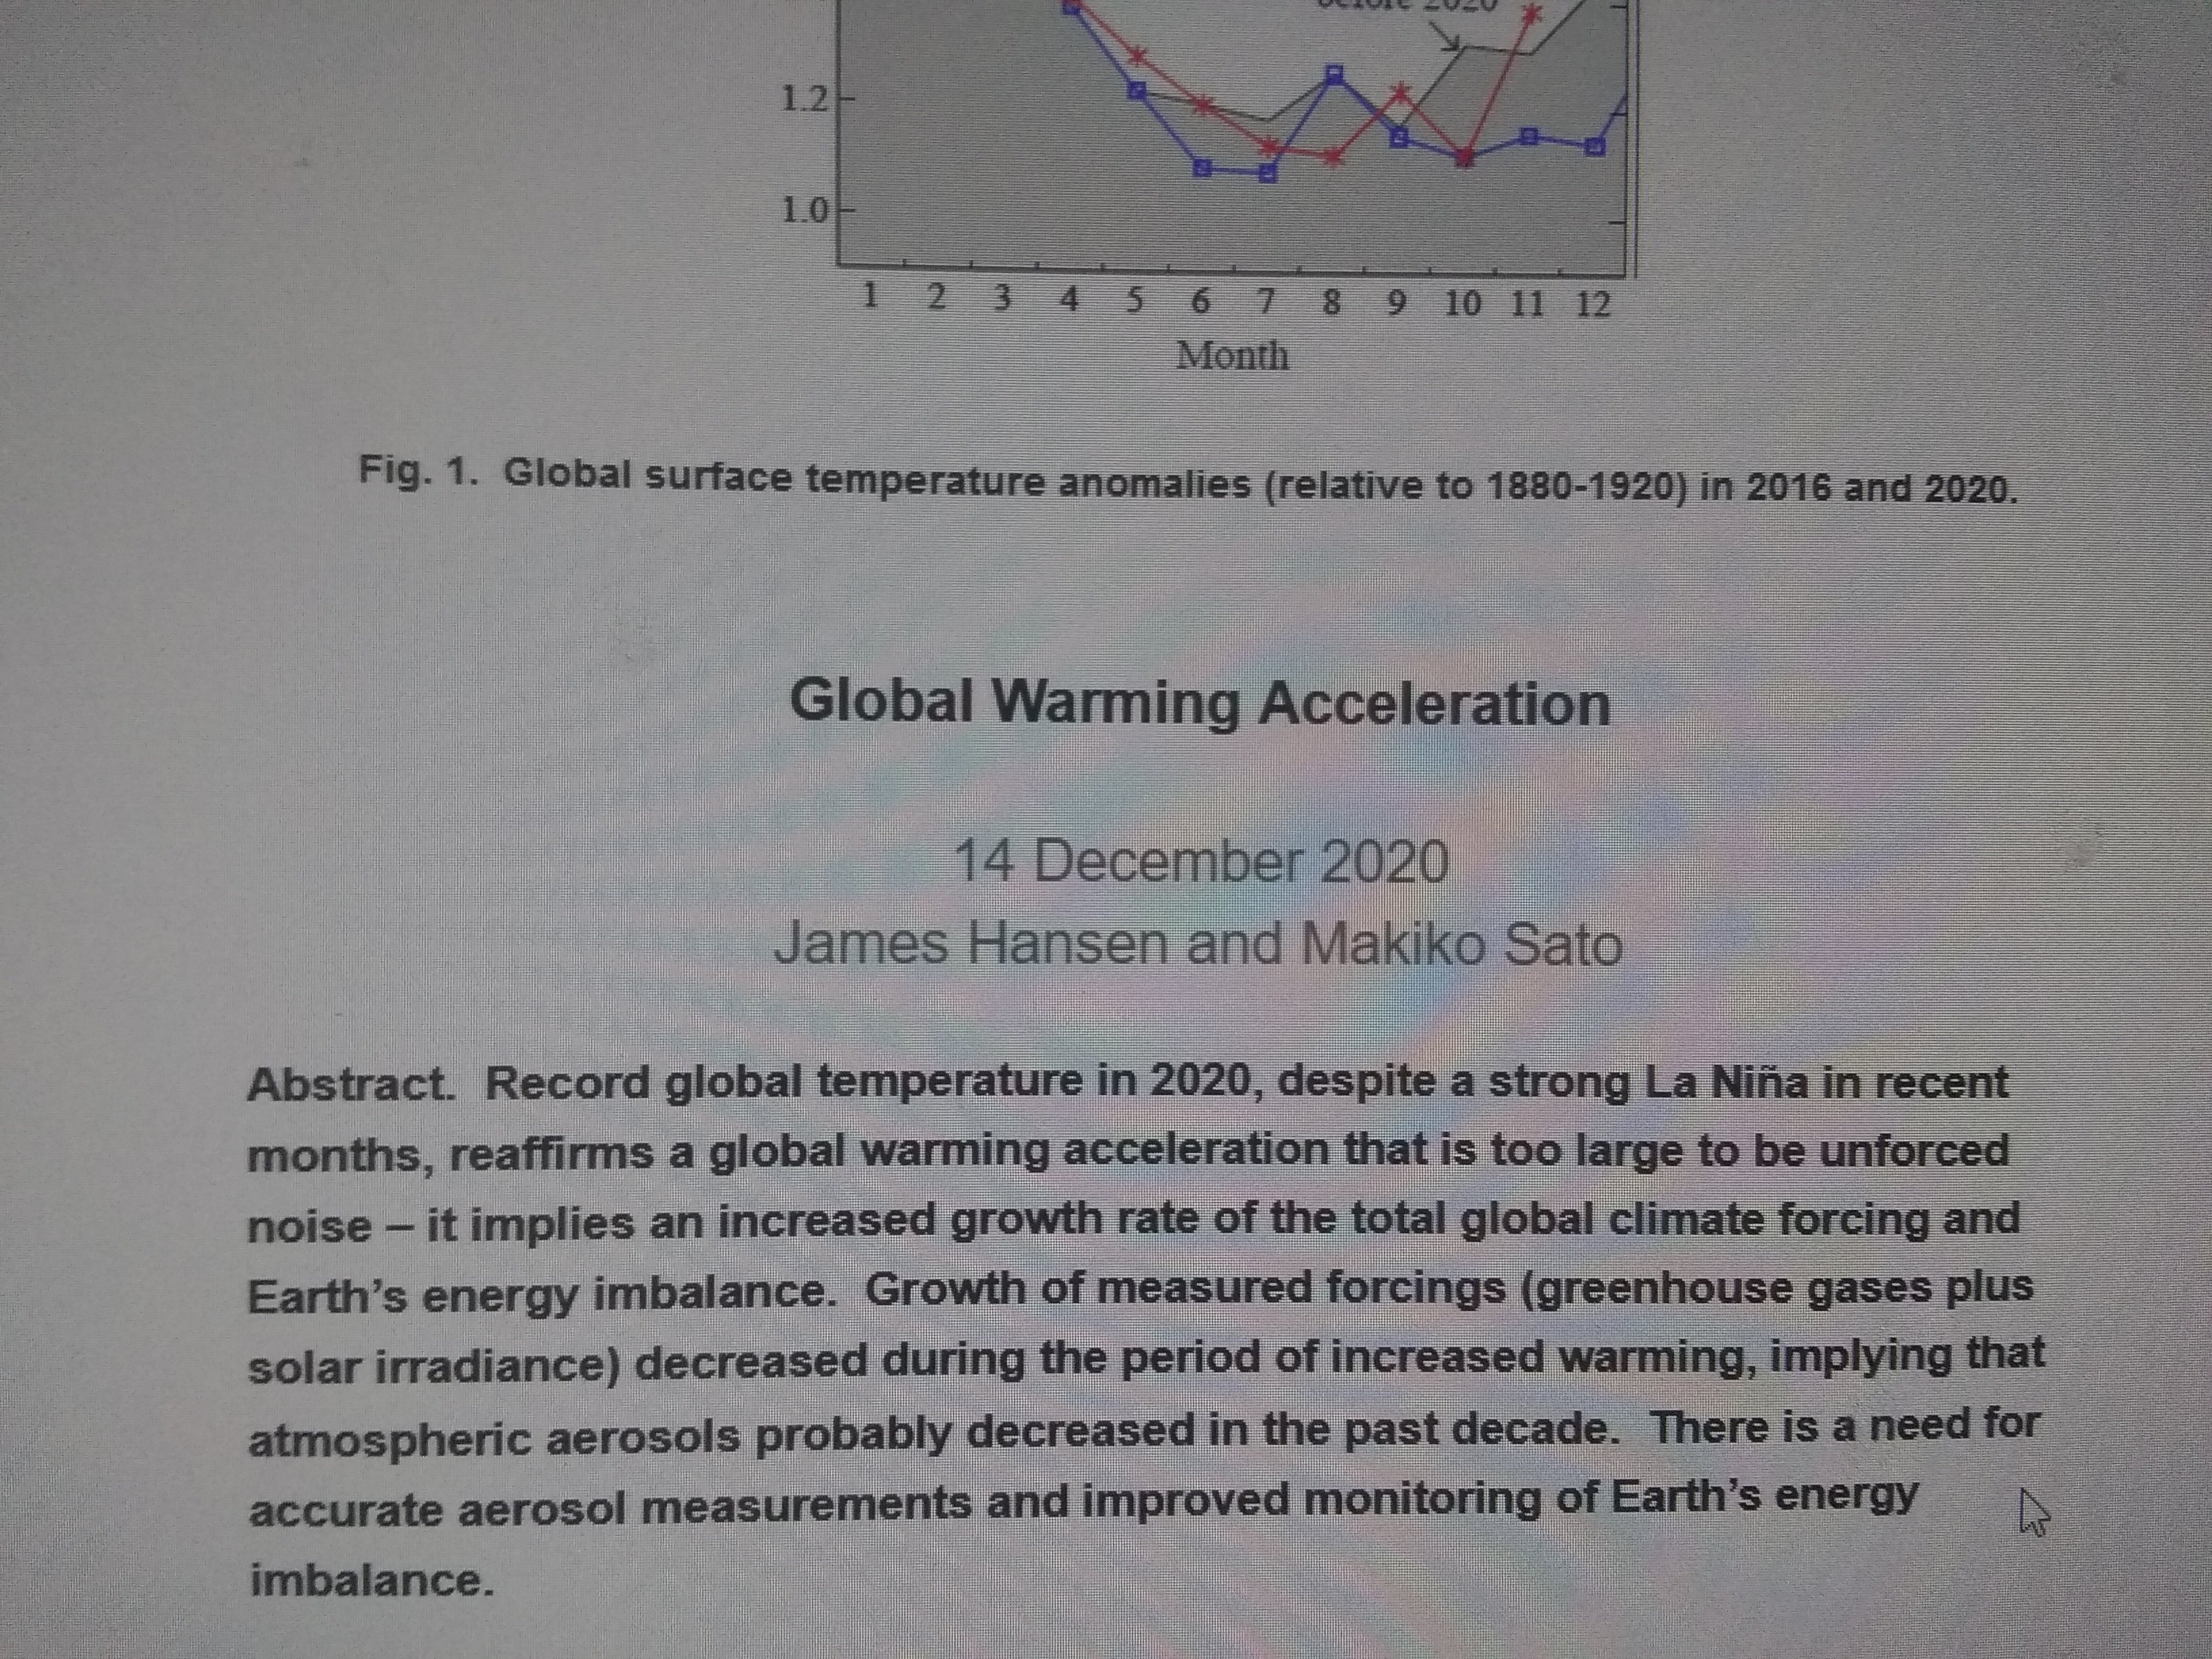
That was a good read. Full text here.
There is some interesting commentary about how we've probably underestimated aerosol forcing. That's probably not a good thing since it means the warming may continue to accelerate as we clean up our aerosol emissions.
-
1
-
-
GISTEMP reported +1.13C for November easily beating out November 2015 for the #1 spot.
-
2
-
-
2 hours ago, chubbs said:
Could have gotten better than even money a couple of days ago on the site you linked above - I would have taken those odds
I got in at 35c a couple of weeks ago when my model was suggesting it should have been valued at 55c. My model is suggesting 80% odds now so there's not a lot of premium/discount to exploit anymore IMHO. I've found this to be a fun and challenging exercise. I've learned a lot in the last couple of weeks. I'm honing my statistical analysis skills (which are still subpar) and got the GISTEMP code running on my Ubuntu install. I also discovered that Nick Stokes' TempLS dataset which updates early makes a great predictor. He processes GHCN and ERSST directly.
-
2
-
-
I was hoping NASA would release the November GISTEMP update today. They didn't. My model is predicting the November value to come in at +1.10C +/- 0.11. At +1.10C December only needs to come in at +0.75C for the annual mean to hit +1.02C which would top 2016's value of +1.01C rounded the nearest hundredth. With observations + GFS forecast through December 15th my model is predicting a value of +0.99C and if this cooling rate persists through the second of half December as well that takes us down to around +0.93C for a final annual mean of +1.03C. We'll see what happens.
-
1
-
-
For a fun perspective on a crowed-sourced prediction regarding whether 2020 will beat out 2016 as the warmest year in the GISTEMP record check out this betting market.
-
2
-
-
ERA reported the warmest November on record by a wide margin.
https://climate.copernicus.eu/surface-air-temperature-november-2020
IMHO this positions GISTEMP favorably to report the warmest year in their dataset. ERA couples reasonable well with GISTEMP.
-
2
-
-
NCAR reanalysis is running warm too. In fact as of the 18th it is warmer than both Oct and Sep. It could be a photo finish on whether 2020 beats out 2016 on the GISTEMP record even despite the ongoing La Nina.
-
1
-
-
I will say that GISTEMP came in at +0.90C for October which is 0.09C cooler than September. This lowers the odds of 2020 being the warmest. It's probably below 50% now.
-
HWRF, HMON, COAMPS, and experimental HAFS all have 98L attaining cat 4 intensity.
-
1
-
-
On 10/7/2020 at 11:12 PM, StormchaserChuck! said:
Nope. Enjoy your government.
Hmm...maybe you're seeing something I'm not or perhaps your objection was regarding the method as opposed to the results but GISTEMP (which the Brown and Caldeira method is based) stands a reasonable chance of beating out 2016 still. We don't have the October value in yet but data from reanalysis leads me to believe that it could be elevated like the September value. And so far preliminary data for November is even warmer than October. Despite the La Nina I don't think we can confidently eliminate 2020 as being the warmest on the GISTEMP record yet. In fact, I'd say the odds are about 50/50 right now. Dr. Huasfather's analysis gives it an even higher 83% chance.
-
1
-
-
1 hour ago, lookingnorth said:
I'm not an expert either, but I did a class project on it last spring and that's basically what I found. The change in lapse rates thing is new to me, but it makes total sense.
Yeah. It's something that is counter intuitive at first, but once you understand exactly how the GHE works and the fact that Antarctica has a unique vertical temperature profile it's pretty obvious it has to be this way. Unfortunately the negative GHE in this isolated region has its limits and will likely turn positive in the future here as well.
Here is an interesting study that quantifies the effect. According to the authors most of the effect is actually attributed to water vapor which is a potent GHG itself. And it is the non-condensing GHGs (like CO2) that provide the secular nudge upward for water vapor concentration via the well known Clausius-Clapeyron lapse-rate feedback.
https://www.nature.com/articles/s41612-018-0031-y
Of course I don't mean to imply that the negative GHE is the sole or even dominant reason for the SH's weak polar amplification. Obviously many other factors are involved here with the most obvious being the larger percentage of ocean coverage relative to the NH.
-
2
-
-
5 minutes ago, jpeters3 said:
FWIW, highest raw T on Goni was 8.0. We are at 8.4 on eta right now.
Wow. Eta is definitely highlighting the problem with the CI number needing to be spooled in. ADTv9 has it clamped at 1.3T/6hr so it can't catch up with the raw value quickly enough.
-
A raw T# > 8.0 suggests a sub 900mb cyclone. I'll go 895 mb 150 kts.
-
ADT continues to show intensification.
ADTv9 is at 5.4 at 21:20Z
ADTv8 is at 5.8 at 21:00Z
And based on the satellite presentation in the last hour I would not be surprised to see another tick up on these T numbers with the next update.
-
5 hours ago, TriPol said:
Can someone tell me what the cause was of the Siberian heatwave this year? I've never seen anything like it before.
According to the best estimate from this study anthropogenic manipulation of the climate made the 2020 Siberean Heat Wave 100,000x more likely as compared to a purely natural evolution of the climate.
-
3
-
-
6 hours ago, CAD_Wedge_NC said:
Speaking of Antarctica ..... "Ice extent is now well above the 1981 to 2020 median extent. This follows a remarkable transition from generally below median extent beginning in August 2016 to well above median extent just in the seven weeks preceding October 1, 2020". Why are we seeing the shift from near record low extent in the north, to near record high extent in the south? If this is a "global" issue, someone please explain the anomaly with Antarctic ice extent.
It's complicated. First understand that this is not entirely unexpected. In fact, the IPCC AR5 WG1 prediction for SH sea ice, although significantly more uncertain than predictions for the NH, shows a slight preference for increases through about 2030 with the possibility of record highs persisting even through 2060 before things turn south (pun intended) down there too. I must caveat that by saying the uncertainty envelope does include the possibility of the secular decline starting around 2020 as well. The unfortunate state of affairs with SH sea ice is that our understanding of its behavior in a warming world is still quite nebulous compared to our understanding of NH sea ice behavior. Second understand that the see-sawing of temperatures and sea ice between hemisphere has been shown to occur during previous significant climatic change events so it is not unprecedented nor is it inconsistent with climatic shifts.
Anyway here are some things to consider...
- The NH is characterized by ocean surrounded by land whereas the SH is land surrounded by ocean. This trivial fact accounts for the bulk of the differences between NH and SH sea ice behavior. The consequences of this can be quite dramatic and contradictory between the NH vs. SH.
- A positive phase of the Southern Annular Mode (SAM) is associated with increasing SH sea ice. Global warming tips the SAM toward a positive phase.
- ENSO negative/positive phases reinforce positive/negative SAM phases.
- The Montreal Protocol through its ban of CFCs, repair of stratospheric ozone, associated cooling tendencies and other effects on weather patterns has been linked to SH sea ice increases.
- Increasing GHGs actually have a cooling effect on the Antarctica continent itself especially during the SH winter when the upper atmosphere is often warmer than the surface. Remember, GHGs act like a thermal barrier preventing IR radiation from passing through. This causes the warm/cool side of the barrier to warm/cool further. Positive/negative lapse rates get more positive/negative. Antarctica often has a negative lapse rate during the winter so GHGs cause cooling at the surface and warming in the upper atmosphere. This effect (among others) suppresses polar amplification in the SH.
Disclaimer...I'm not well informed regarding SH sea ice so hopefully others who know more about the behavior down there can chime in on points I've missed or mischaracterized.
The main take away here is that sea ice is mainly a NH issue right now. Most scientists do not expect NH-style declines in sea ice down in the SH anytime soon. And the fact that the SH responds differently than the NH is probably more the rule than the exception.
-
2
-
1
-
HWRF gets this down to 937mb at landfall near the Nicaragua/Honduras border...nearly the same spot as HMON.
-
Using a simple extrapolation I'm going to guess 10.18e6 km^2 for the 2020 annual mean. This would be 2nd lowest between 10.163 in 2016 and 10.201 in 2019. The current 3rd lowest figure is 10.335 so I still feel pretty confident that 2020 will end at least in the bottom 3. In fact, even if 2020's freeze trajectory catches up to the 1981-2010 mean by year end we'd still see a finish in the bottom 3. And if freeze rates continue to stay muted then a new record low for the annual mean extent is a definite possibility.
-
1
-
-
As of 10/20 the NSIDC extent YtD mean is 10.26. This is a tad higher than the current record holder set all the way back in 2019 at 10.23.. The gap is closing though. I think there is a good chance that 2020 will at least end in the bottom 3 in terms of annual mean extent. A new record is certainly a possibility as well.
-
1
-
-
As of October 13th the 5 day NSIDC average extent is at a record low again beating out 2012.
-
1
-
2020 Temperatures
in Climate Change
Posted
Berkeley Earth released their 2020 annual report. 2020 was the second warmest year behind 2016.
http://berkeleyearth.org/global-temperature-report-for-2020/