
AvantHiatus
-
Posts
4,222 -
Joined
-
Last visited
Content Type
Profiles
Blogs
Forums
American Weather
Media Demo
Store
Gallery
Posts posted by AvantHiatus
-
-
Per 12z GFS 12/19 plug in DC finishes 49.6 or 4 degrees above prior Dec record.
Nutty....
-
Enormous mounds of methane found under the Arctic sea: Underwater pingos may reveal 'worrying' clues about climate change
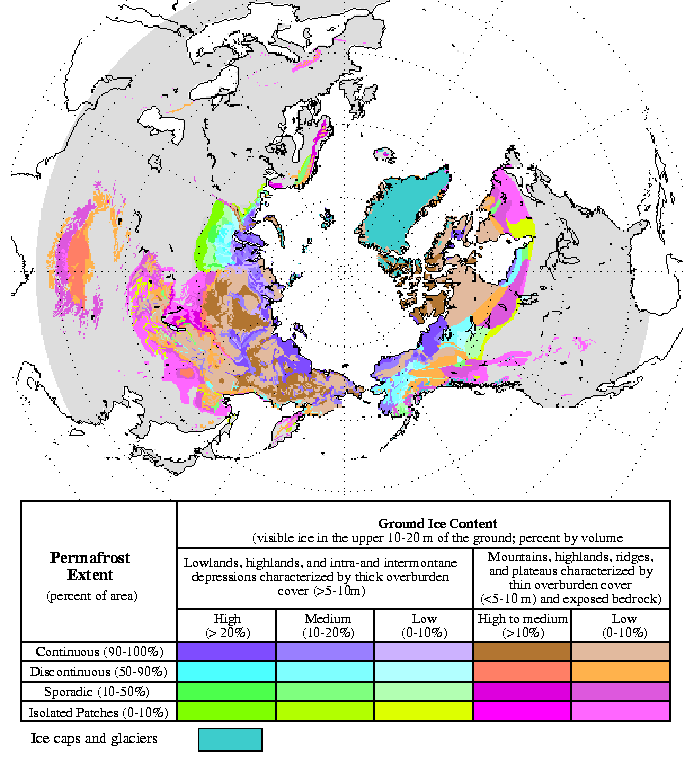
Huge mounds filled with methane have been discovered forming on the frozen sea bed of the Arctic Ocean, raising fears they are being caused by climate change.
Scientists fear thawing permafrost beneath the ocean is causing methane to become free, forming underwater pingos - mounds of earth and ice - off the coast of the Yamal Peninsula in Siberia.
Similar structures are thought to be behind enormous craters that have appeared on the land on the peninsula as methane exploded out of the Earth.
-
Not methane but this is not good. Carbon feedbacks on hyperdrive in a human hothouse.

-
DC tied for 3rd on 90-degree day count as of today with 12. 2010 also had 12.. 1991 lead with 16.
Impressive considering the prevailing 500mb. How many of the 90s were in May?
-
It is our old friend, Paul Beckwith.
-
-
-
hey southeastern MD, southern DE, and south NJ folks any updates for how the hurricane season is looking for our specific area??? any info would be greatly appreciated
Riding on the homebrew train. The recent uptick in storms forming in the sub-tropics early and late in the season is interesting and bears watching.
-
12z GFS moved it all north/west and gave us the classic fringe job... rain for us.
Looks like the Euro.
-
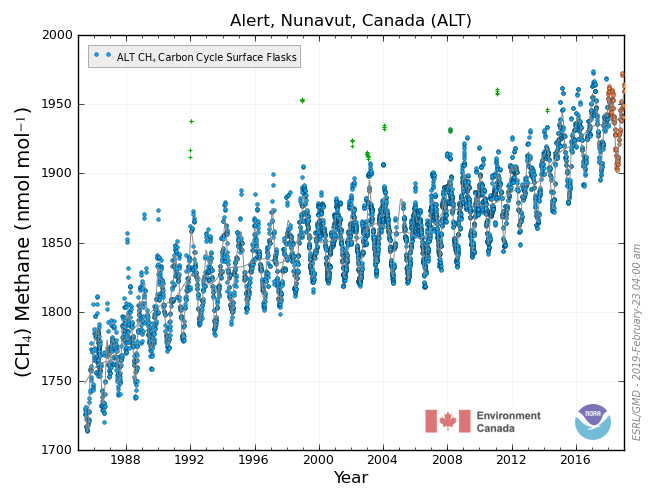
Strong trend at Nunavut...
-
Unconfirmed Reports of Giant, 1 Kilometer, Methane Crater Found in Siberia
-
This is gonna be a awesome paste bomb with a sandblast of sleet....im loving it!

-
ummm.... it was supposed to be within the last 40 years lol
Apologies, however if a tree falls in a forest does anyone hear it?
-
Ash Wednesday Storm 1962.
http://en.wikipedia.org/wiki/Ash_Wednesday_Storm_of_1962
Homes, hotels, motels, and resort businesses were destroyed along North Carolina's Outer Banks from Cape Hatteras, Nags Head, and Kill Devil Hills north to Virginia Beach, where the waves broke the concrete boardwalk and sea wall. Even some cities further inland such as Norfolk and Hampton in Hampton Roads were inundated with punishing winds and high water. Construction work underway on the new Chesapeake Bay Bridge-Tunnel was dealt a severe blow, and a major piece of custom-built construction equipment called "The Big D" was destroyed.
At the Town of Chincoteague on Virginia's Eastern Shore near the border with Maryland, six feet (2 m) of water covered parts of Main Street, and most of the island was flooded to various depths. On adjacent Assateague Island, the Chincoteague Fire Company lost a portion of its herd of wild Chincoteague Ponies. Misty, the local pony made famous by Marguerite Henry's award-winning children's book Misty of Chincoteague and the 1961 movie Misty, survived by being brought inside a house. Also along the Delmarva Peninsula, at Wallops Island, a million dollars in damage was done to NASA's Wallops Flight Facility.
Further north, 60 mph (96 km/h) winds and 7.6 m (25 ft) waves struck Ocean City, Maryland. Waves more than 12 m (40 ft) high occurred at Rehoboth Beach, Delaware destroying the boardwalk and beach front homes. Sand dunes were flattened along the entire length of Delaware’s ocean coastline. In New Jersey, the storm ripped away part of the Steel Pier in Atlantic City. Avalon, New Jersey lost 6 blocks. Long Beach Island was cut through in several places. The decommissioned destroyer Monssen was washed ashore near Holgate. In New Jersey alone, an estimated 45,000 homes were destroyed or greatly damaged. In New York, on Long Island, communities such as Fire Island were decimated; 100 homes there were destroyed. Wave heights reached 12 m (40 ft) by the shore of New York City. Extensive damage to trees and structures and beach erosion was also reported along the southern New England coast, particularly along coastal Rhode Island, and in New London and Fairfield Counties in Connecticut, although less severe beach erosion was reported in Massachusetts, New Hampshire, and Maine.[1]
-
I'm feeling a historic sleet-storm for my backyard on south. Perhaps a thick glacier topped with 6 inches of wet snow. I also expect insane rates.
-

Tropical cyclone remnants on 3/14 18z GFS. March FTW
http://mag.ncep.noaa.gov/data/gfs/18/gfs_namer_288_1000_500_thick.gif
-
-
Got GFS'd again....what is 16-20" among friends?
-
First fantasy tropical cyclone on the GFS in the gulf at 324. Seems early for this stuff.
http://www.tropicaltidbits.com/analysis/models/gfs/2015022806/gfs_mslp_pcpn_us_47.png.
-
Thanks for your thoughts. A lack of activity makes for a long summer. Hopefully we can get some long track Cape Verde systems going without the damn shear tearing them apart
Thanks mang. I'm kind of feeling a gulf stream season and it flows well with 2014. The Atlantic has not changed much but the Pacific is where major evolution is occuring. We are still stuck with this annoying +NAO.
-
Does anyone have thoughts about this coming hurricane season? Please please let it be more active than the last 2 seasons!
Semi-enthusiastic due to the ENSO. Looks like it is transitioning into central-based, also known as Modoki El Nino. This configuration includes years such as 2003 and 2005. With the 1930's pattern, we may have a strong signal shifted east instead of confined to the gulf.
Given the lag between ENSO and atmospheric response, the true red meat season may not come until 2016. Something like 2014 with more landfalls is definitely possible, which would resemble a fairly active season.
-
Quite an historical contrast in June 2014 average minimum and maximum temperatures at DCA. The average minimum was 68.8 degrees, good enough for 6th warmest on the all-time DC list. The average maximum, on the other hand, was 85.6 degrees, tied for only 31st warmest on the all-time DC list. In June 1994, DCA recorded an average maximum of 90.0 degrees, the all-time DC high for June -- 4.4 degrees higher than this year. However, the average DCA minimum in June 1994 was only 68.7 degrees, 0.1 lower than this year.
Solid proof of increased urbanization or greenhouse warming.
-
Perhaps this has been touched on earlier in this thread, but does anyone know what's caused the slowdown in methane rises from 2000-Present?
1750+ CH4 is pretty rare in the paleoclimate record. I would surmise that environmental forcings were simply "maxed" out in the 2000's. Looks like we have accelerated slightly in the last few years and especially in 2013. A more appropriate question to ask is if the recent Methane jump is a "glitch" or a real trend.
Interesting that the methane trend appears to have followed the rate of global temperature rise.

Our region's extreme run
in Mid Atlantic
Posted