
LocoAko
-
Posts
4,954 -
Joined
-
Last visited
Content Type
Profiles
Blogs
Forums
American Weather
Media Demo
Store
Gallery
Posts posted by LocoAko
-
-
Not sure if this is the right thread for this, but yikes.
-
Hence why it's in banter.
So banter == trolling, then?
-
Not Arctic, but thought I'd share.
http://news.agu.org/press-release/satellite-data-shows-u-s-methane-hot-spot-bigger-than-expected/
SATELLITE DATA SHOWS U.S. METHANE ‘HOT SPOT’ BIGGER THAN EXPECTED
9 October 2014
Joint Release
WASHINGTON, D.C. – One small “hot spot” in the U.S. Southwest is responsible for producing the largest concentration of the greenhouse gas methane seen over the United States – more than triple the standard ground-based estimate — according to a new study of satellite data.
Methane is very efficient at trapping heat in the atmosphere and, like carbon dioxide, it contributes to global warming. The hot spot, near the Four Corners intersection of Arizona, Colorado, New Mexico and Utah, covers only about 6,500 square kilometers (2,500 square miles), or half the size of Connecticut.
This map shows anomalous U.S. methane emissions (that is, how much the emissions are higher or lower than average) for 2003-2009, as measured by SCIAMACHY. Purple and dark blue areas are below average. Pale blue and green areas are close to normal or slightly elevated. Yellows and red indicate higher-than-normal anomalies, with more intense colors showing higher concentrations. The Four Corners area is the only red spot on the map.
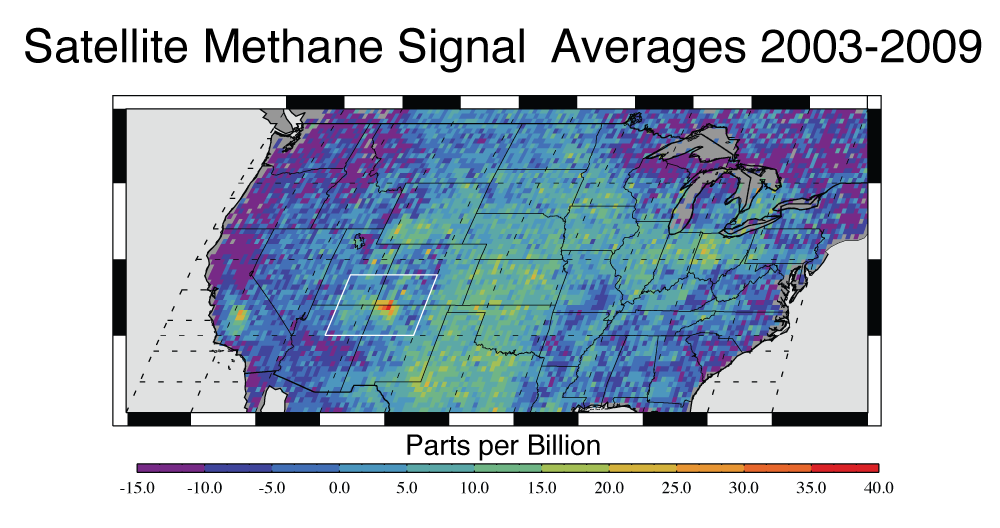
This map shows anomalous U.S. methane emissions (or how much the emissions differ from average background concentrations) for 2003 to 2009, as measured by the European Space Agency’s SCIAMACHY instrument. Purple and dark blue areas are below average. Pale blue and green areas are close to normal or slightly elevated. Yellows and red indicate higher-than-normal anomalies, with more intense colors showing higher concentrations. The Four Corners area – the area where Arizona, Colorado, New Mexico and Utah meet — is the only red spot on the map.
Credit:NASA/JPL-Caltech/University of Michigan
In each of the seven years studied from 2003-2009, the area released about 0.59 million metric tons (0.65 million U.S. tons) of methane into the atmosphere. This is almost 3.5 times the estimate for the same area in the European Union’s widely used Emissions Database for Global Atmospheric Research.
In the study published online today in Geophysical Research Letters, a journal of the American Geophysical Union, researchers used observations made by the European Space Agency’s Scanning Imaging Absorption Spectrometer for Atmospheric Chartography (SCIAMACHY) instrument. SCIAMACHY measured greenhouse gases from 2002 to 2012. The atmospheric hot spot persisted throughout the study period. A ground station in the Total Carbon Column Observing Network, operated by the Department of Energy’s Los Alamos National Laboratory, provided independent validation of the measurement.
To calculate the emissions rate that would be required to produce the observed concentration of methane in the air, the authors performed high-resolution regional simulations using a chemical transport model, which simulates how weather moves and changes airborne chemical compounds.
Research scientist Christian Frankenberg of NASA’s Jet Propulsion Laboratory (JPL) in Pasadena, California, first noticed the Four Corners signal years ago in SCIAMACHY data.
“We didn’t focus on it because we weren’t sure if it was a true signal or an instrument error,” Frankenberg said.
The study’s lead author, Eric Kort of the University of Michigan, Ann Arbor, noted the study period predates the widespread use of hydraulic fracturing, known as fracking, near the hot spot. This indicates the methane emissions should not be attributed to fracking but instead to leaks in natural gas production and processing equipment in New Mexico’s San Juan Basin, which is the most active coalbed methane production area in the country.
Natural gas is 95-98 percent methane. Methane is colorless and odorless, making leaks hard to detect without scientific instruments.
“The results are indicative that emissions from established fossil fuel harvesting techniques are greater than inventoried,” Kort said. “There’s been so much attention on high-volume hydraulic fracturing, but we need to consider the industry as a whole.”
Coalbed methane is gas that lines pores and cracks within coal. In underground coal mines, it is a deadly hazard that causes fatal explosions almost every year as it seeps out of the rock. After the U.S. energy crisis of the 1970s, techniques were invented to extract the methane from the coal and use it for fuel. By 2012, coalbed methane supplied about 8 percent of all natural gas in the United States.
Frankenberg noted that the study demonstrates the unique role space-based measurements can play in monitoring greenhouse gases.
“Satellite data cannot be as accurate as ground-based estimates, but from space, there are no hiding places,” Frankenberg said.
In March 2014 the Obama Administration announced a strategy to reduce methane emissions under its Climate Action Plan. The strategy includes improving the measurement and monitoring of methane emissions and assessing current methane emissions data.
-
Nice explanation.
I have a few more questions
1) Can we use MUCAPE during the afternoon with no inversion?
For this example this meteorologist mentioned MUCAPE with the morning sounding
http://ryanhanrahan....xed-layer-cape/
but then went on to MLCAPE.
2) Does the remnant MUCAPE(elevated instability) become MLCAPE when the cap breaks?
3) Shouldn't MLCAPE be the most unstable because of the accessibility for a parcel to reach the available energy, because of the steep low and mid level lapse rates?
4) What makes MUCAPE more unstable then MLCAPE?
Thanks for answering these additional questions.
1: You can always use MUCAPE. Typically, without an inversion, the most-unstable CAPE will be equal to the surface-based CAPE, since surface parcels will have the highest instability. MUCAPE is typically used for overnight/elevated convection just because it is in those instances where the SBCAPE can be most misleading, so to speak.
2: I'm not really sure how to answer this question, but I think the answer is no. Usually when referencing the cap "breaking", people are referring to surface parcels breaching the CIN and ascending past through LFC. Elevated instability, seen via the MUCAPE, can exist above the cap and generate convection regardless of any cap.
3 & 4: MUCAPE and MLCAPE are different ideas addressing different issues.
MUCAPE is used when there may be inversions limiting the extent of surface-based instability, but where instability may exist above this inversion. It only seeks to locate the maximum CAPE possible lifting any parcel.
MLCAPE, on the other hand, is the CAPE found when the lifted parcel has the conditions of the average lowest 100 mb of the atmosphere. This is done to obtain more realistic CAPE values, as due to low-level mixing a parcel will typical not have the conditions of the lowest (ground) level but will be representative of the lowest ~100mb or so of the atmosphere. Often, temperatures will be superadiabatic right at ground level (and therefore deceptively high compared to the T a parcel would have), and moisture pooling will often exist in the lowest data point, whereas a parcel would be much more thoroughly mixed.
Therefore, MUCAPE isn't inherently more unstable than MLCAPE.... it depends on the atmospheric situation at play. As per #3, MLCAPE can be the most unstable if the atmospheric conditions allow for it, but it isn't always the case. Check out this sounding showing elevated instability:
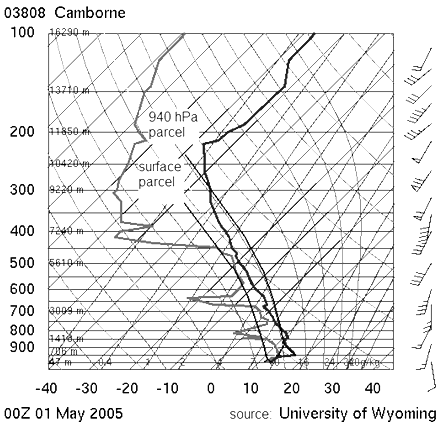
As you can see, the parcel ascending from 940mb has quite a bit of positive buoyancy and CAPE (and would be considered MUCAPE, as it is not surface-based and is the parcel with the most CAPE out of any in the sounding). In contrast, the MLCAPE, taken by using the average parcel conditions in the lowest ~100mb, would be T=~15C and Td=~4C, and would not result in very much MLCAPE, and certainly less so than the MUCAPE.
Keep in mind that MUCAPE will lift parcels from anywhere in the sounding to find the one that is the most unstable, while MLCAPE is essentially surface-based CAPE, except that the "surface-based" parcel has the average conditions in the lowest ~100mb as opposed to the true "surface" values.
-
You can find dozens of examples of scientists and non-scientists claiming the science is settled and that the debate is over. It's a ridiculous attempt at suppressing the skeptical view.
The debate over whether global warming is occurring - yes.
I haven't seen any scientists claim we know everything about everything. Come on now.
-
The attitude of many AGW alarmists that I have encountered has tended to be "the science is settled", without wanting to acknowledge the rather large uncertainties that exist about complexities/feedbacks within our climate system. There also seems to be a lack of understanding by many that the science can be solid and well researched, but still wrong about a lot of things.
Which is why you often see peer-reviewed studies that are at odds with each other - not everyone can be right, and often the most widely "accepted" view early on in a scientific field does not turn out to be entirely correct.
The bolded is definitely the case (I see it with my friends all the time). I guess I mostly don't care what a lot of alarmists or deniers say, so when I hear statements like this, I think of the scientific community. In that sense, I take "the science is settled" to clearly mean that we ARE warming and it IS anthropogenically-induced, but I don't hear people claim we know everything.
-
A lot of these are open questions that have not been resolved. The "pause" in the warming has shown how poor our understanding of the climate system is. To claim that the science is setlled and we know all, is ignorant and arrogant.
I keep seeing this brought up as some sort of talking point, but who has stated that we "know all"? Seriously.
-
There's been some attribution to heavy rainfall events in the U.S. due to climate change. Though most studies on them are not long enough for high confidence. We don't have nearly as strong of a precipitation record as we do a temperature record since the late 1800s.
The media will do their typical hack jobs, but the science will speak for itself for those who actually want to read the papers.
Yup.
Plus the 1-in-1000 year stuff isn't really even related to CC, it's just a statistical measure.
-
Your blog was tweeted by someone I follow & I read it there. Great write up. My Mom said it was a fairly somber day in Joplin yesterday. (heightened by the events in Moore I'm sure) After moving there from the Ft Lauderdale area. She is more certain than ever she will spend the rest of her life in Joplin. The will of the people there along with the kindness just over whelm her. She had to stop by Wal Mart yesterday & a random group of people where collecting the same supplies JoMo spoke about to send to Moore. She pitched in and did her part & then just broke down. When I talked to her last night she was just astounded by the acts of the people in the Midwest.

-
Can you do monthly break down. Im guessing the one extra you have is from Jun 10th.
See edit above. I believe the extra is 91F on April 16th.
-
Adding New Brunswick, NJ through today:
90 degree days: 17 (April: 1, May: 2, June: 6, July: 8)
89 degree days: 1
-
Mesoscale book that I would highly recommend. Served me well at Millersville and has a fair amount of pictures/diagrams if you are a more visual learner. It doesn't really make a hard effort to avoid the mathematics, but it also tries to break things down conceptually so if you have the interest you will likely enjoy it.
http://www.amazon.co...r/dp/0470742135
BTW, this a GREAT thread!
Seconded suggestion for this book! Great, comprehensive resource for all things mesoscale.

-
Another term that gets tossed around with the big storms or noreasters around here is vertically stacked. I only had a rough idea of what this meant but it totally hit home in 09-10. Generally speaking, most of our winter storms are tilted. Meaning the surface low (850) and upper level low (500) are not in the same place. This past weekend was a good example. The upper level low tracked though tn/ky/wv and the surface low tracked through ga, sc, and off the nc coast. This is probably the more common setup for us in the ma. Even though "energy transferred to the coast" it was not a miller B because the energy to our west was in the upper levels and not the surface.
We get our biggest storms with Miller A's when the ull (500mb) stacks directly above the surface (850mb) just south of our latitude (obx is generally the best spot I think). A vertically stacked low passing through our latitude can be distinguished by the classsic "eye" look of a noreaster. It's kinda the same principal of a hurricane but it's a cold core vs warm core system so there are sig differences. However, vertically stacked lows are spinning from the surface all the the way through the upper levels in the same place so the center is "hollow" for lack of a better term.
Miller B's are not the same irt to what happened this weekend so it's important not to confuse the 2. Miller B's have 2 surface lows. Primary will move west of us and then transfer it's energy to the "newer" surface low developing along the coast. Long story short, I see too many people confusing a miller B with a miller A when the ull tracks to the west and the surface tracks to the se of us. Miller B's can have a trailing upper level low too. We can totally whiff in the MA with the 850 transfer but still score a little something if the upper level low takes a favorable track.
With a little know how of what you're looking at on the model runs, it's very easy to distinguish between the two and set your back yard expectations accordingly.
Miller A = single surface (850) low tracking across the gulf and SE. Upper level low can track to the west into KY/TN but it is still a Miller A. Best case scenario is when the upper level low stacks over the suface low near or a bit south of our latitude. When this happens the amwx server melts down.
Miller B = 2 surface lows. One tracking into the oh valley and one tracking to our se. The initial stronger surface low will go to our west and then hand over all the goods to the newer low to our se and then that becomes dominent. NE loves these and the MA cries more often than not. Miller B's putting down good snow in our backyard is a function of latitude during the transfer. We want the secondary 850 well to our SE as the primary hands over the goods. Models have a really tough time with this as do our nerves. If we're near the southern fringe on the models, more often than not we will be dissappointed in this area. The Feb 10th 2010 was an excellent example of what needs to happen for us to score. Folks down in central VA weren't too happy though.
Clicking through 850/slp maps on the models is the easiest way to understand whether we are going to have a Miller A or Miller B evolution. You don't even need to ask questions about Miller A vs Miller B if you can understand this simpleton explanation.
Met's, I may be screwing up the vertically stacked definition. I didn't really address anything @ 700mb because I don't really know enough about it other than RH. I know you can also have closed 700 lows but I generally only concentrate on the surface and 500 when looking at a coastal. Please correct any and all mistakes. I was trying to explain it in simpleton terms so anyone could understand.
I know the regular MA folks know alot of this stuff but I hope the "storm drop in" weenies read this post because they often don't get it.
I'm not positive on this, but I don't actually think it is the vertical stacking of the lows that causes the "eye" - or it is, but not always. When lows vertically stack it signals the occlusion process happening and the ceasing of much further strengthening. All cyclones eventually vertically stack and occlude, but clearly not all cyclones have "eyes". I think the eye formation process has more to do with the frontal structure and occlusion process of some cyclones vs. others. Shapiro-Keyser style cyclones are much more likely to develop an eye (and are also more likely to develop over water, and hence affect the EC region with snow) due to the progression of the warm front. Anyway, this may be a technicality from what you wrote, so I apologize if I'm simply repeating what you've said.
http://weatherfaqs.org.uk/node/98

-
The price is a bit steep, but I highly recommend this newer book on synoptic meteorology:
https://secure.amets...fm?productID=81
Even though intended for met students, I think the examples provided with mathematical/physics content makes it pretty easy to digest for someone with an interest in meteorology.
Seconded. Got this book for Christmas and it is great. I'd already taken Synoptic Meteorology as a class, and this book helped clarify a lot for me since, despite the math, the focus is not on derivations but is very conceptual. Dr. Lackmann seems great at explaining things like this. More specifically, he explains potential vorticity and its applications better than I've ever seen elsewhere. Great stuff.
-
Well, I could spend all morning..lol, but I'll try my best. Frontogenesis simply means the genesis or formation of a front. It's an important process for precipitation to form. This basically means you have something separating different airmass or temperatures within an airmass.
So, deformation....we all love it as winter weenies. What deformation does, is to actually help cause frontogenesis. Deformation helps pack the isotherms tighter together. Packing isotherms tighter together leads to frontogenesis. You see this many times both and the cold and warm seasons..but mostly the cold season. Here is a textbook image of what the thermal field would look like. Instead of air flowing parallel to the isotherms, the wind is acting to deform the temp field and pack the isotherms together.
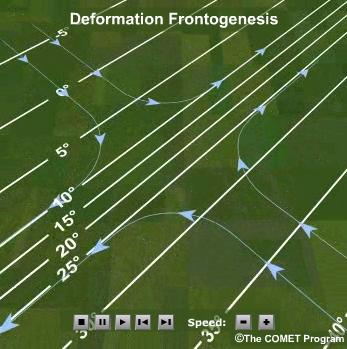
Now in real life, it's not as pretty as that image. It's a little less obvious sometimes, but the idea is there. Even winds the aren't in a 90degree angle...as long as winds are at an angle and helping to converge or pack the isotherms together, you'll deform the thermal field and lead to frontogenesis. Here is an image from the SPC meso analysis site. This is from 12/26/10. Notice the closed 700mb low with a frontal looking feature cutting through SNE (in black). Now look at the winds to the east of the low. 70kts or so from the south, pumping up warmer air. Now, lets look north of the front in NNE. Notice the winds are more NE. You can even see some winds in se Canada that are more NNE and helping to bring down colder air at that level. While this image is not as classic as the image above, you can see how warmer air is rapidly moving north and converging with the colder air and associated ne winds over NNE. What you are doing, is stretching and deforming this thermal field, and helping to pack the isotherms closer together with time. Indeed you can see in purple, that we have frontogenesis over SNE..meaning the thermal field is becoming sharper and sharper over a smaller horizontal distance, with time.
So that's all fine and dandy, but why is this important? Well when you have isotherms packed together over a smaller horizontal distance, you have a much sharper frontal slope in the atmosphere. So, the air will rise faster along this sharper slope, than it would normally with a weaker slope. Also, the atmosphere is always wanting to stay in balance. It hates being out of balance. During times of strong frontogenesis, you disturb the thermal wind balance. A fancy way of saying...the temperature is changing to quickly over a small distance. So what happens is that you get this circulation that develops where you have rising air over the warmer, or southern side of the gradient and sinking air over the colder or northern side of this gradient. This is why many times you have that narrow, but enhanced band of snow or rain on the nw side of a storm. It's also a reason for sucker holes or subsidence in the region of sinking air. So if you think about it..it's a pretty cool way of balancing the atmosphere. What happens when air rises? It cools. So you have rising air helping to combat all the warming on the warm side of the gradient. What about sinking air? Sinking air warms, so you have that also trying to fight against the colder air moving in on the north or colder side of the gradient. Hope that helps.
Secondary ageostrophic circulations FTW!

You have a knack for explaining things well and you having saved graphics from past storms really makes the posts enlightening. Good stuff.
-
http://thinkprogress...rce=twitterfeed
Link to a very nice explanation of how low ice in the Arctic leads to high amplitude jet streams and potentially more and longer snowy periods at lower latitudes.
Helpful for us unwashed, at least.
I post it here because the comparison of the ice maps for 1980 and 2007 shows that the ESAS region is where most of the reduction in summer extent has occurred.
I know that correlation is not causation (this is not a "post hoc ergo propter hoc" argument!), but an argument COULD be raised to defend the idea that either one of these events (CH4 release and sea ice loss) might credibly play a role in facilitating the other.............
Dr. Francis!
-
It must be different everywhere. Wisconsin had a major focus on forecasting the weather along with the science. Synoptic meteorology, mesoscale meteorology, and radar and satellite took me from a novice to actually knowing what I'm doing. Other classes added bits and pieces to the forecasting puzzle too.
Well both our synoptic and mesoscale courses have extremely heavy focuses on forecasting (we're required to forecast every day, write summaries if we bust, use GEMPAK to forecast, etc.) but I'm not going to claim that when you graduate with a B.S. that you're a "good" forecaster just because you earned a BS and I think you know that wouldn't be true too - that was my point.
-
this is a possibilty...
but, i don't know the first thing about forecasting...getting my masters isn't going to teach me the operational forecasting meat and potatoes you get through undergrad...which is what i'm interested in...
i have thought about going into the Air Force
I think you'd be surprised at how little forecasting there is in undergrad. I mean, it is there, but it isn't a primary focus. I gather most forecasting skills are picked up along the way (using the knowledge you gained in school) and on-the-job. I know that even at bigger programs like Penn State, while graduate school is obviously researched-focused, they even have forecasting classes at the graduate level. So don't get too down about it.
-
Not to mention Mathematics and Computer Science? Something sounds screwy about that! Maybe Mathematics majors are doing ok (ones I know from my experience are) and Computer Science majors are ok (dido), but people with the combined degree are not getting a job specific to that major? IDK...
I noticed that they didn't specifically state it was 'in the field'. I wonder if that is to be implied or not? If it isn't, then I can easily see why meteorologists are so highly employed.
And yeah, boo to petroleum engineering. If we were interested in that we would have gone into it... The end.
-
Very cool graphic. I'm honostly pretty surprised that atmospheric science jobs are that highly employed. Although thinking back on it, just about everyone in my graduating class in 2006 got a job or went to grad school (and later got a job) in the field.
Also surprised that nuclear engineering is ranked high amongst unemployed, there is a big market for them right now
That and Biomedical Engineering. Would have assumed that was a big up-and-coming thing. Poor Studio Art.

For the average salary, I wonder if Meteorology should be included under Physical Sciences. ~$69,000 is certainly not bad....
-
Saw an interesting "Infographic" posted this morning.... Note: Meteorologists/Atmospheric Scientists are listed as having a near-100% employment rate and is the 10th most employed field.

-
Not only do people not know (or sometimes care?) what the difference is between a watch and a warning, but I think some of the media does an awful job of communicating it.
Example: My very first day here in Oklahoma last Saturday, a supercell erupted to our SE in Ada that had a tornado warning, and there were other storms around that had severe thunderstorm warnings associated with them. To my surprise, the scroll on the bottom of the screen on the local news (in Oklahoma of all places!) simply said "...A severe thunderstorm has been issued for _____".
Seriously?

-
So glad to hear you're okay, JoMo, and my thoughts are with you as you deal with this.
Thanks for checking in. -
If you love your job, you will never work a day in your life.
I would recommend (and reiterate what many many others have said in this thread) that you diversify your degree. If you major in metereorology, see if you can minor in math, or computor science, or oceanography, or anything else. It will be hard, but worth it
I'm minoring in Environmental Science, but do you actually think a minor really helps that much in getting employed? It is hardly the same as a double major and I don't think it makes one much more qualified to do something. Maybe just shows interest/drive?
pivotalweather.com
in Weather Marketplace
Posted
Fantastic. Thanks for all your hard work Brett!