

Twilly05
-
Posts
49 -
Joined
-
Last visited
Content Type
Profiles
Blogs
Forums
American Weather
Media Demo
Store
Gallery
Posts posted by Twilly05
-
-
11 minutes ago, Shad said:
has anybody tried cutting the Euro off and cutting it back on?
Unplug, wait 60 seconds..oh never mind
-
Changing to snow now. Oldfield point, northeast md.
-
1 hour ago, stormtracker said:
Ok here. I made a scale. Tell me if yall agree
3-6 yo!
4-10 guys
10+ FOLKS
better? I dunno. lol. maybe 12+? This is a democracy.
Your play by play is one of the highlights of this forum!
-
 1
1
-
-
1 hour ago, stormtracker said:
lol..still a little light band from NW DC NW to hagerstown at midnight
And just misses Gtown…
-
 1
1
-
-
Elkton
Oldfield pt./Cecil county
Cloudy 30*
-
Chesapeake City bridge in Cecil County has been shut down due to icing.
-
40 minutes ago, nj2va said:
1800DIALJI
Wait, you’re one digit short. Oh…..never mind
-
46 minutes ago, psuhoffman said:
I definitely am worried about the pac base state. And you may be right about a muted in between result. But I guess I went all or nothing. What my data indicated is either the Nino is able to initiate the longwave pattern we need and it’s a blockbuster year or it fails to and it’s a lame below avg year. But the better analogs skewed in favor of a blockbuster.
There are exceptions like 2019 but it really did fail to initiate a favorable pattern and DC just got incredibly lucky that one fairly odd weak storm in a mediocre pattern maxed out for them. If we replay that winter 10 times I bet it ends up below avg snow 7/10 times.
I did adjust the averages down about 10% to account for warming. The reason I didn’t go further was if you stratify the seasonal data by enso state, nino is the one category where we’ve seen no statistical regression in our snowfall. So far a true Nino pattern has been the one thing impervious to warming’s negative impact on snowfall. I suspect so far the increase in available moisture and baroclinic instability are offsetting the warming given a perfect storm track and the Nino longwave pattern muting the Pacs ability to flood in a puke airmass. That’s probably living on borrowed time but Im gambling we haven’t reached the cliff yet.
Thanks for putting in the work. Well reasoned. Hope you are right.
-
1 hour ago, psuhoffman said:
I have teased before the idea of trying to find a way to calculate snowfall probabilities using all the major ensembles. The mean is always a bad tool to use alone because it can be skewed by extreme outliers. The probabilities are a better tool but the problem with them with any one ensemble is they are susceptible to internal bias error. All the permutations are still based off the same parent model and its equations. They tinker with the initial conditions and the models equations a bit but only within certain parameters.
Each model system has to deal with certain problems. One is how to initialize the atmosphere given our incomplete data and resolution limitations. How each model deals with these limitations and how to compensate for them affects the outcome. There is only so much they can perturb these factors within each's parameterization schemes. If there is a bias error for a specific synoptic event inherent in the parent model it is likely to infect the ensemble permutations as well.
Another issue is how the models resolve factors that are impossible to actually be accurately depicted in the model either because of the complexity of the process or because of the spatial resolution limitations of the model. Some processes take place mostly at the molecular level and are too small scale for the model to resolve the way they actually occur. Other factors are too complex and trying to actually model them with all the variables would create ridiculous exponential errors. So the guidance comes up with ways to compensate and model the effects of these processes. But each model handles this problem slightly differently. An error caused by these factors in the parent model would also be likely to infect the ensemble permutations.
The problem with using probabilities produced by any one model ensemble system is that the whole system is infected with some of the same error biases and the system does not know anything outside the system. In short, the model does not know what it does not know.
By creating a probability using multiple systems we can offset some of these biases some. It's still not perfect because at the end of the day we are using a still limited physical understanding to apply the primitive equations to mathematically represent a chaotic fluid system like the atmosphere with nearly infinite permutations based on nearly infinite processes at nearly infinite levels. We're just not even close to being able to do that accurately at long leads. But I do think using all 3 major global ensembles will turn out to be more accurate than any one.
The next issue is how to weight them based on their overall accuracy. I decided to go EPS 40%, GEFS 35% and GEPS 25%. Further investigation based on verification scores might move me to tinker with that calculation some but for now lets see how it goes.
Using this math here is where we stand based on 0z guidance using BWI as a central location.
These probabilities are through day 10, 0Z Feb 6th
51% chance of 1" of snow
27% chance of 3" of snow
9% chance of 6" of snow
I will try to update these numbers when I have time after each run going forward (when there is a realistic chance of snow, not wasting time on this during shit the blinds patterns).
So you’re saying there’s a chance…
-
59 minutes ago, WesternFringe said:
So, record snow from bombogenesis (which should decrease in frequency with a warming climate, according to IPCC 6) in Buffalo is climate change. Record cold is climate change. And droughts of snow is climate change. When it is super hot it is climate change. When we have drought it is climate change. When we rain more than normal it is climate change. Bigger hurricanes (which we haven’t seen) are the result of climate change. Got it.
Are there any weather phenomena that are not the result of climate change? Lol
No doubt we are in a warming cycle. Not much we can do about it. Push the broom faster I guess. Lol
-
55 minutes ago, WesternFringe said:
So, record snow from bombogenesis (which should decrease in frequency with a warming climate, according to IPCC 6) in Buffalo is climate change. Record cold is climate change. And droughts of snow is climate change. When it is super hot it is climate change. When we have drought it is climate change. When we rain more than normal it is climate change. Bigger hurricanes (which we haven’t seen) are the result of climate change. Got it.
Are there any weather phenomena that are not the result of climate change? Lol
No. Lol That’s the game. All about money and control. We humans can’t control how the globe behaves. Even they acknowledge that if we followed all of the suggestions, every country followed the suggestions, it wouldn’t really make much difference. We have a better shot going to the beach and pushing back high tide with a broom.
-
56 minutes ago, Ralph Wiggum said:
Gimme 300 on the inside runner that no models are currently showing.
I take the southern slider for 200 Alex…
-
1
-
-
2 hours ago, Maestrobjwa said:
It's to the point where it can't even be broadly trusted at 180 hrs...turrible, just turrible. Like it's not even the usual LR op run variations within the same idea--just not having a clue altogether, lol
Ok Sir Charles
-
1
-
-
6 minutes ago, psuhoffman said:
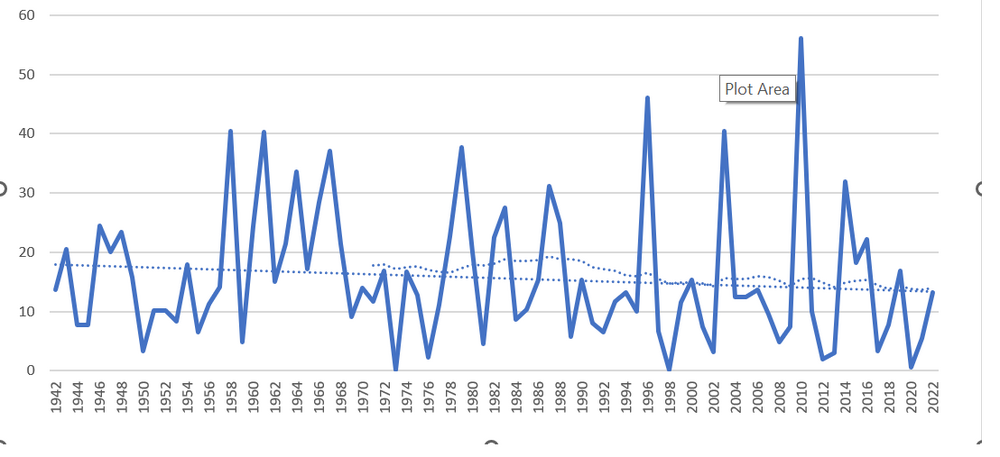
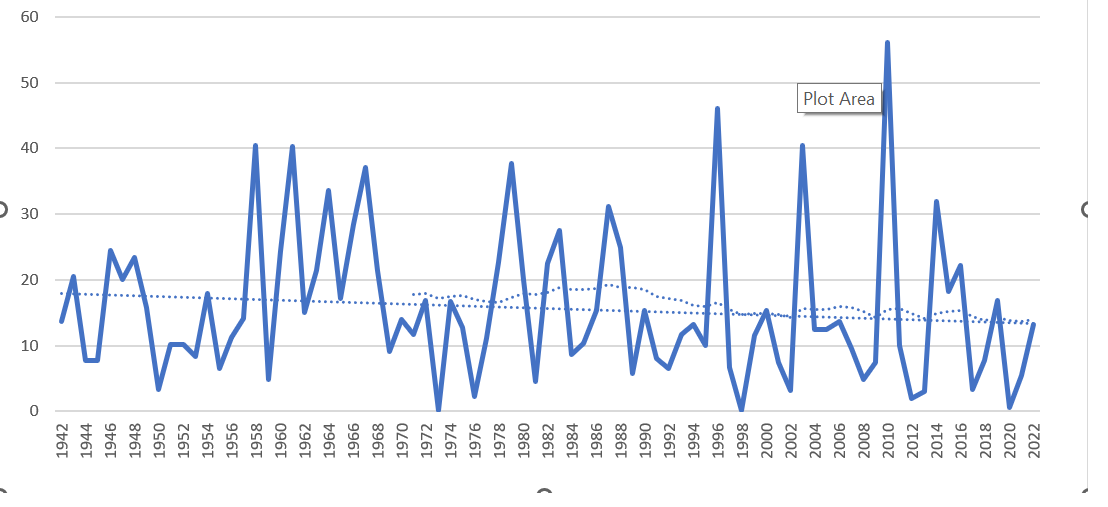
I will take you at your word that you are not trolling and engage one last time with what I take issue with in your statistical analysis. But first I'll post some data that I will reference in my response below. @Terpeast I have used only DCA data from 1942 onwards.
DCA annual snowfall with a linear trendline and 30 year running mean imposed.
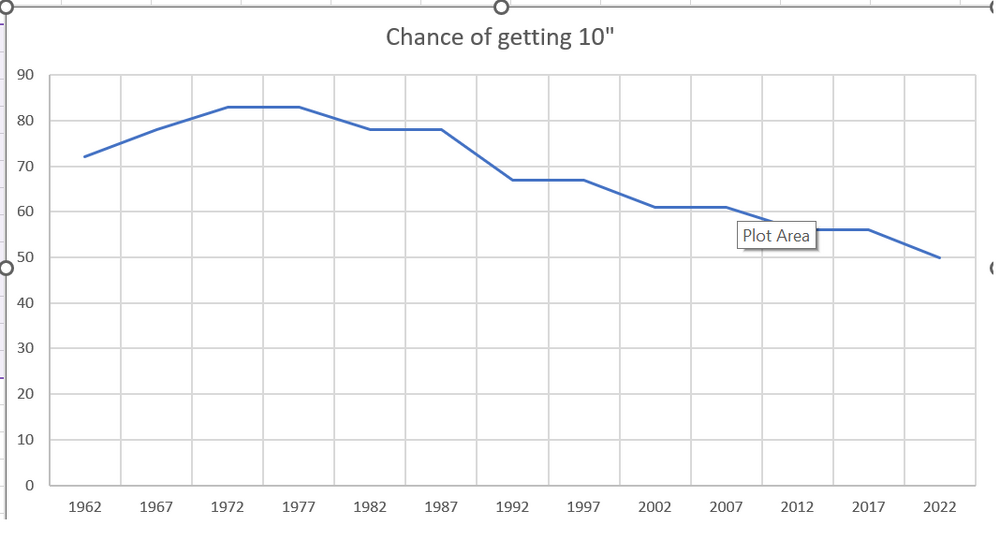
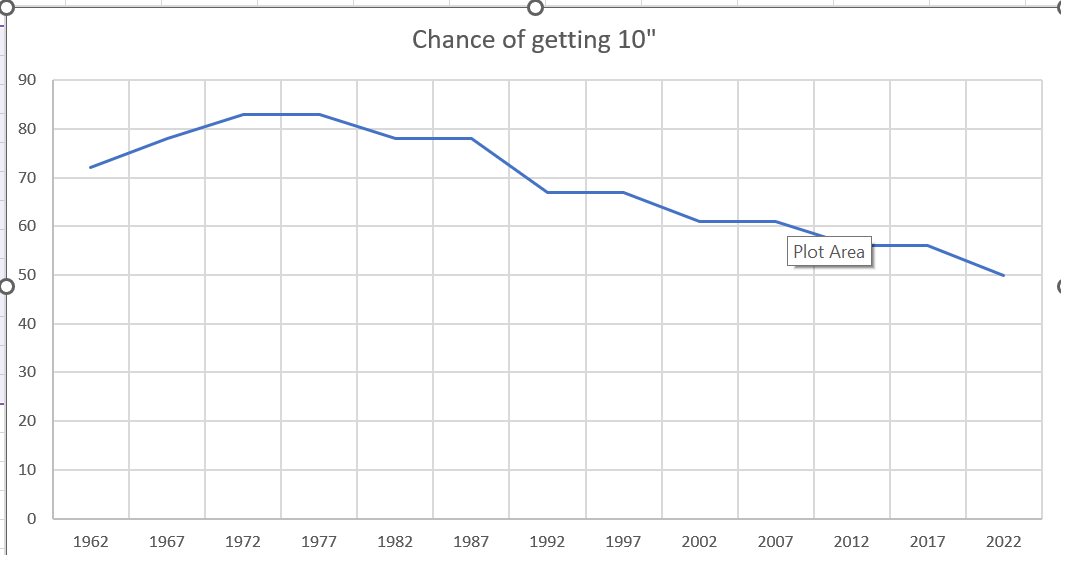
18 year running probability of getting at least 10" of snow in any given season
18 yeas was not arbitrary but was chosen because in this discussion yesterday 18 years was agreed upon as a minimum data set to avoid overly skewed results to get a statistically significant result.
Some additional facts.
The running 30 year mean snowfall at DCA has decreased from 17.8" to 13.9" over the period of record for the airport. This trend is continuing and is getting even worse...the current 15 year mean is only 13.6"
The median has decreased from 15.8" to 10.85". This trend is also getting worse. The current 15 year median is 7.8"
The chances of getting at least 10" of snow in a given season have gone from 72% to 50% in a given season. This trend also is getting worse...the current 15 year probability is 47%
The chances of getting 15" in a season have gone from 53% to 27%.
The chances of DC getting 20" have gone from 40% to 17%
1) The words bolded above are all your opinion. The slope is NOT 0, virtually is opinion...yes over any one year the change is insignificant but over a long period of time .03 adds up to 4" of snowfall we have lost annually over the period of record. That is not insignificant when your average is only about 14". That's more than 20% of our annual snowfall we have lost.
2) Single digit snowfall years is not arbitrary, its a way of showing what chance there is of getting a significant amount of snow in any given year in DC. We can use another number if you want...8", 12", 15", 18", 20"...they all show the exact same trend so it doesn't matter. I didn't cherry pick 10 to skew the data, I picked 10 because its a nice simple even number to highlight the issue which is in any given year the odds of getting snow is going down. That is true whether you use the threshold of any amount between about 7 and 20", outside that you get some crazy useless percentages because you're using a number outside a standard deviation.
3)I've repeatedly said that using the probability of snowfall or the median is way more useful to a climate like DC and you repeatedly dismiss that which is your opinion and fine but I will explain what is wrong with a mean. DC snow climo is inflated by anomalously snowy seasons like 1996, 2003, 2010 and 2014. But the snow that happens in those winters doesn't make the years in between any less awful. They do not affect what a typical winter is. Getting a huge amount of snow every 7 years or so affects the mean a lot but isn't indicative of what any given winter is likely to be like...which is probabilistically much more likely to be one of those other 6 years. Median filters out those big years better to give you a better indication of what any given specific season is likely to be like.
4) You've said there is no evidence that the mean is being skewed but the evidence is right on the chart for everyone to see. While the median and probabilities of snowfall are clearly decreasing the range of snowfall in any given year over a period of time is increasing. The standard dev of snowfall is increasing. Even though the baseline for snowfall is lower we have had several of the biggest snowfall seasons recently. This is preventing the mean from dropping as quickly as the probabilities of snow in any given season are. But for our purposes the probabilities are more important. Who cares that it snows a crap ton once every blue moon when the truth is we spend 80% of the time in the total suckage periods in between that are getting worse!
5) You repeatedly try to manipulate the data by using an arbitrary date in the 1980's from which you can say "snowfall has increased since". That is really bad statistically because snowfall does run in cycles. We are no doubt in a down cycle right now. I have never implied DC won't have better snowfall periods ahead. But by cherry picking a date that is a minimum with which to compare the current point in time fails to acknowledge that over a longer period of time its evident that the "snowy" cycles are becoming less snowy and the "dreg" periods are becoming MORE dreg. The current down cycle is no doubt a down cycle...but its worse than previous down cycles. The recent snowy periods weren't as snowy as past snowy periods. Over longer periods the downward trend is evident.
Stats can be made to “prove” anything you want them to prove. Really comes down to 2 different opinions of what the “stats” say. Who cares? Everyone has an opinion. Sadly “science” has now been thrown into the political monkey grinder. Everyone has an agenda. Sad.
-
2
-
 1
1
-
 1
1
-
-
37 minutes ago, Terpeast said:
Well there we go. This immediately makes the entire graph suspect.
If we really want to get scientific about this, we should cut out anything before 1941. Or pull snowfall records from other stations in/around DC and do a regression against the DCA data, then extrapolate the slope backwards to 1884.
Like Bob Chill said, I’m willing to bet the result will have us just needing one prozac instead of two.
That’s my point. Skewed data leads to skewed conclusions.
-
1 hour ago, Maestrobjwa said:
I'm sure there's some denial here...and I totally get it. Nobody here likes to see these stats....but I mean, you can't dispute the incremental drop in average. Like I said, we had 3 consecutive decades have 4 single digit snow seasons...I mean that's the simplest way to see it. I mean yeah it's depressing, but what can ya do?
All the more reason to enjoy the heck out of the big ones (and DON'T complain when we get them)
Who is doing the measuring? Seems to me that the airport ALWAYS has a lower than surrounding area measurement. Almost like they are trying to prove a point. Same with temps. Do you know they round up from .1?
So if temp tops out at 86.1, they round up to 87. Or low temp is 22.1, they round up to 23.
-
1 hour ago, IronTy said:
We're on 68 right now. Weather says it's 14F and heavy snow on meadow mtn. Guess the front already went through, it was 33F about an hour ago. 37F and rain on the highway right now.
Good luck. Be safe!
-
2 hours ago, IronTy said:
Leaving at 5am tomorrow morning to get a jump on the weather. Hoping to get the tent up before the cold air slams through which looks to be around 11am-12pm. WSW says wind chills of -35F, it's gonna be an epic campout. One of our game cams transmitted a pic this morning that looked like maybe 4" on the ground already. We're going to try for three nights. Really it depends on how well the dog can handle it.
I don’t think you are going to beat the front. Hope you do. Good luck!
-
1 hour ago, nj2va said:
Pretty sick upslope for the mountains and ideal snow making conditions after the cutter - in time for the Christmas week crowds at the local ski resorts.
Yeah!
Finding the silver lining…barf
-
1 hour ago, snowmagnet said:
So the GFS is offering up snow on snow on snow the 23rd, 26th, 29th.., thé CMC has rain, and the Euro has dry and cold?? Am I following this right?
Yup. Pretty much it
-
1 hour ago, stormtracker said:
On a plane now about to take off from Bali. It’s going to be a brutal 20 hours. Back at IAD around 10am tomm
Godspeed
-
1
-
-
Nothing worse than mid 30’s rain
-
1 hour ago, Scraff said:
It's a cruel, cruel summer
Leavin' me here on my own….
You got it, ya baby you got it, I’m your Venus…
-
1
-
-
10 minutes ago, H2O said:
Prince died
Shit, you’re kidding. When?
February Medium/Long Range Thread
in Mid Atlantic
Posted
NE MD PUMMELED!