Juri Iurato
-
Posts
9 -
Joined
-
Last visited
About Juri Iurato

-
MeteoTracker production units now available. Shipping time: 7-10 days. Ergonomics and usability improved (new USB-C port in the rear part), water resistant and more than 200 hours of autonomy. More than 250 units operative in the field all around the world and a pletora of very interesting sessions. Still available on Indiegogo for purchasing at the very discounted crowdfunding price (only few days left) https://www.indiegogo.com/projects/meteotracker-weather-station-for-data-on-the-move/x/25741123#/

-
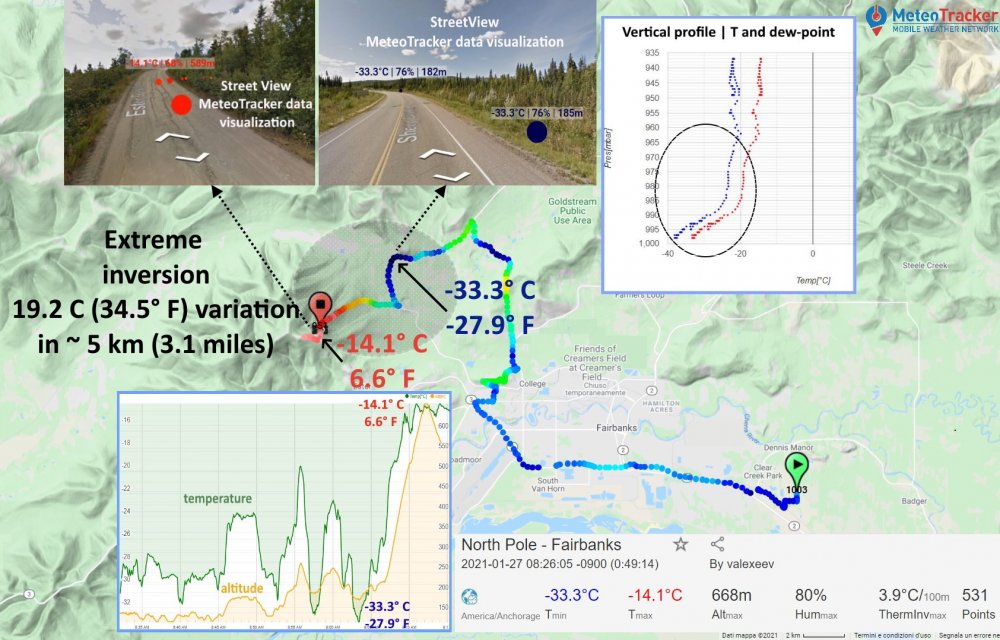
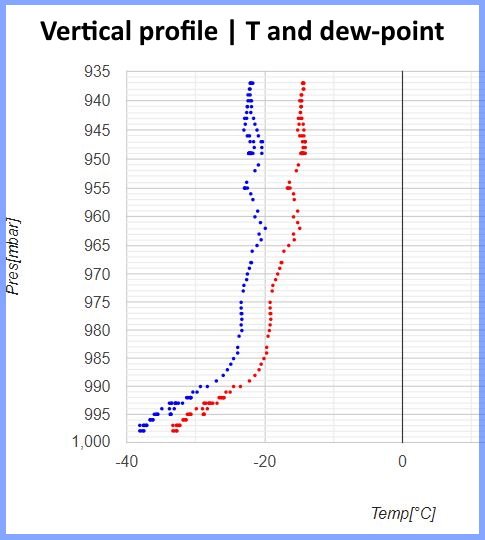
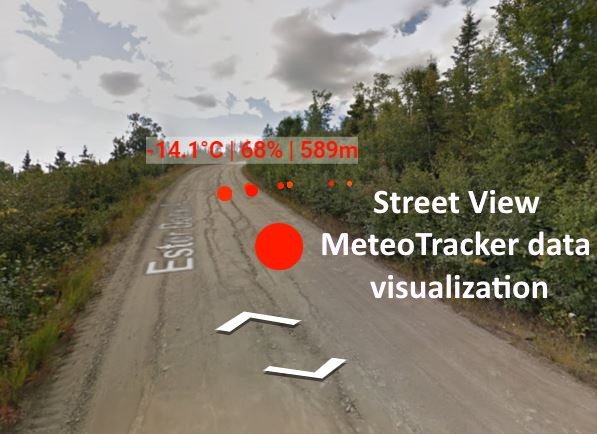
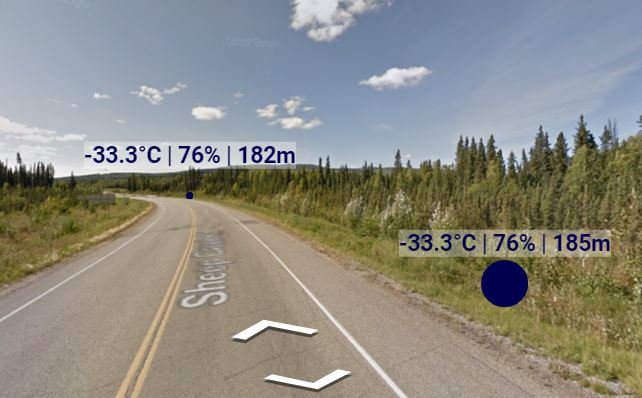
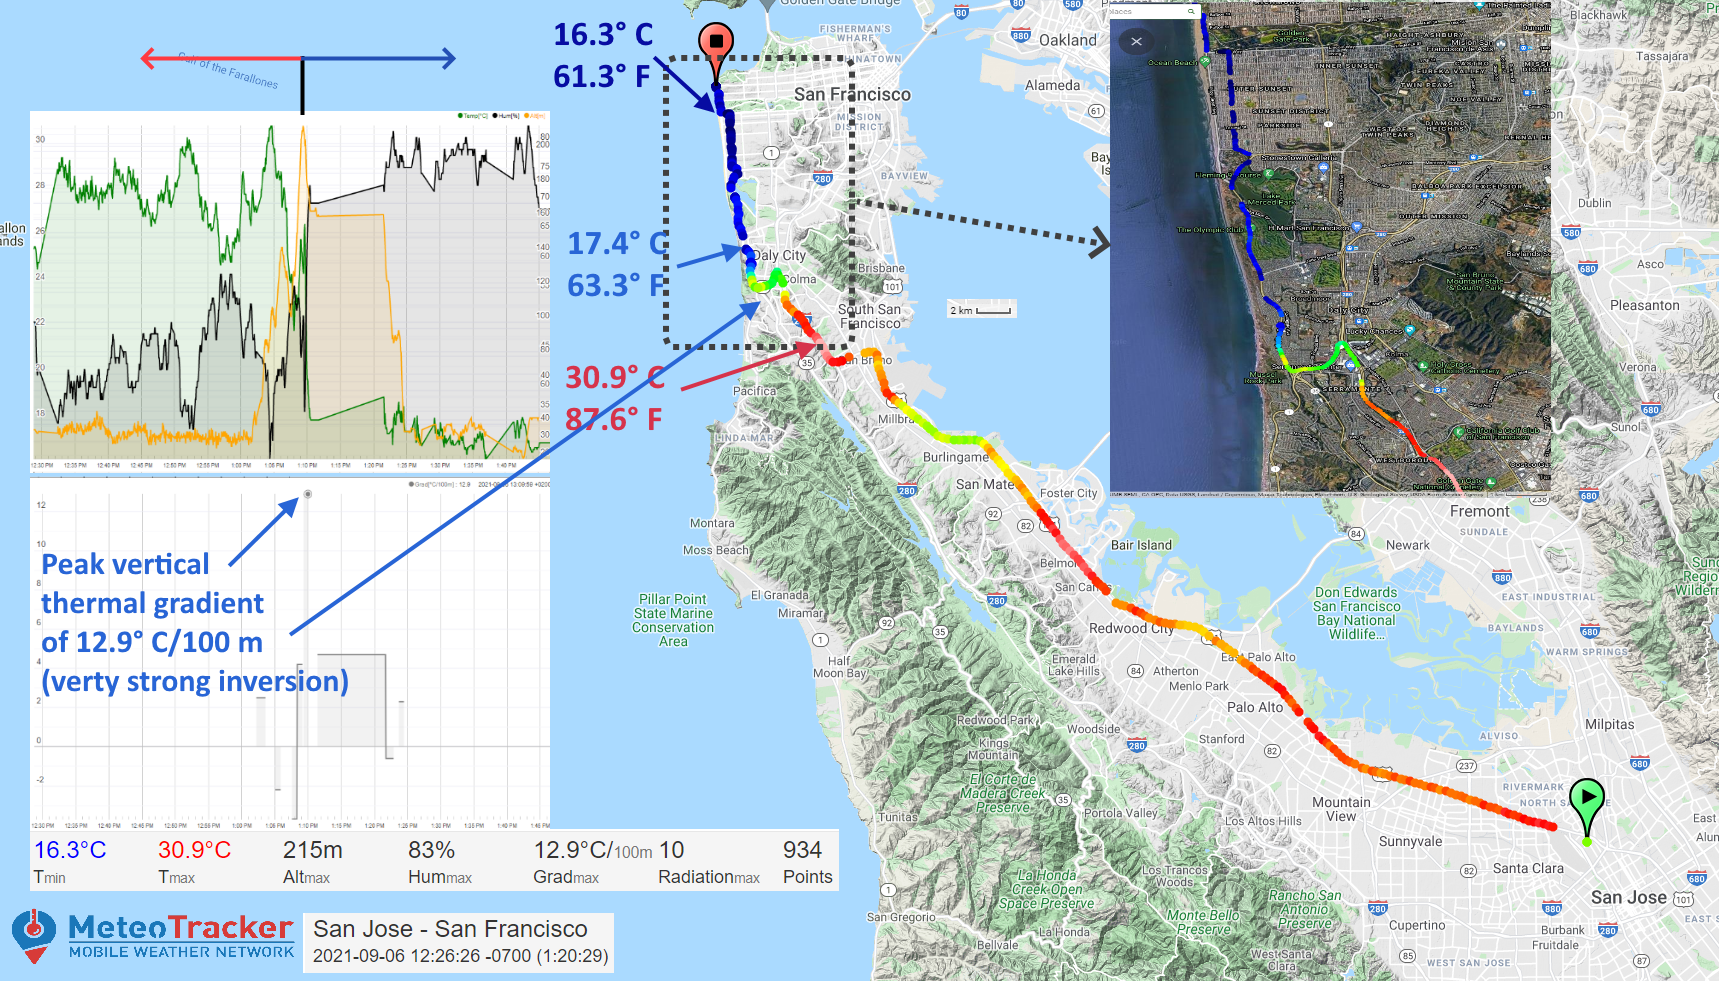
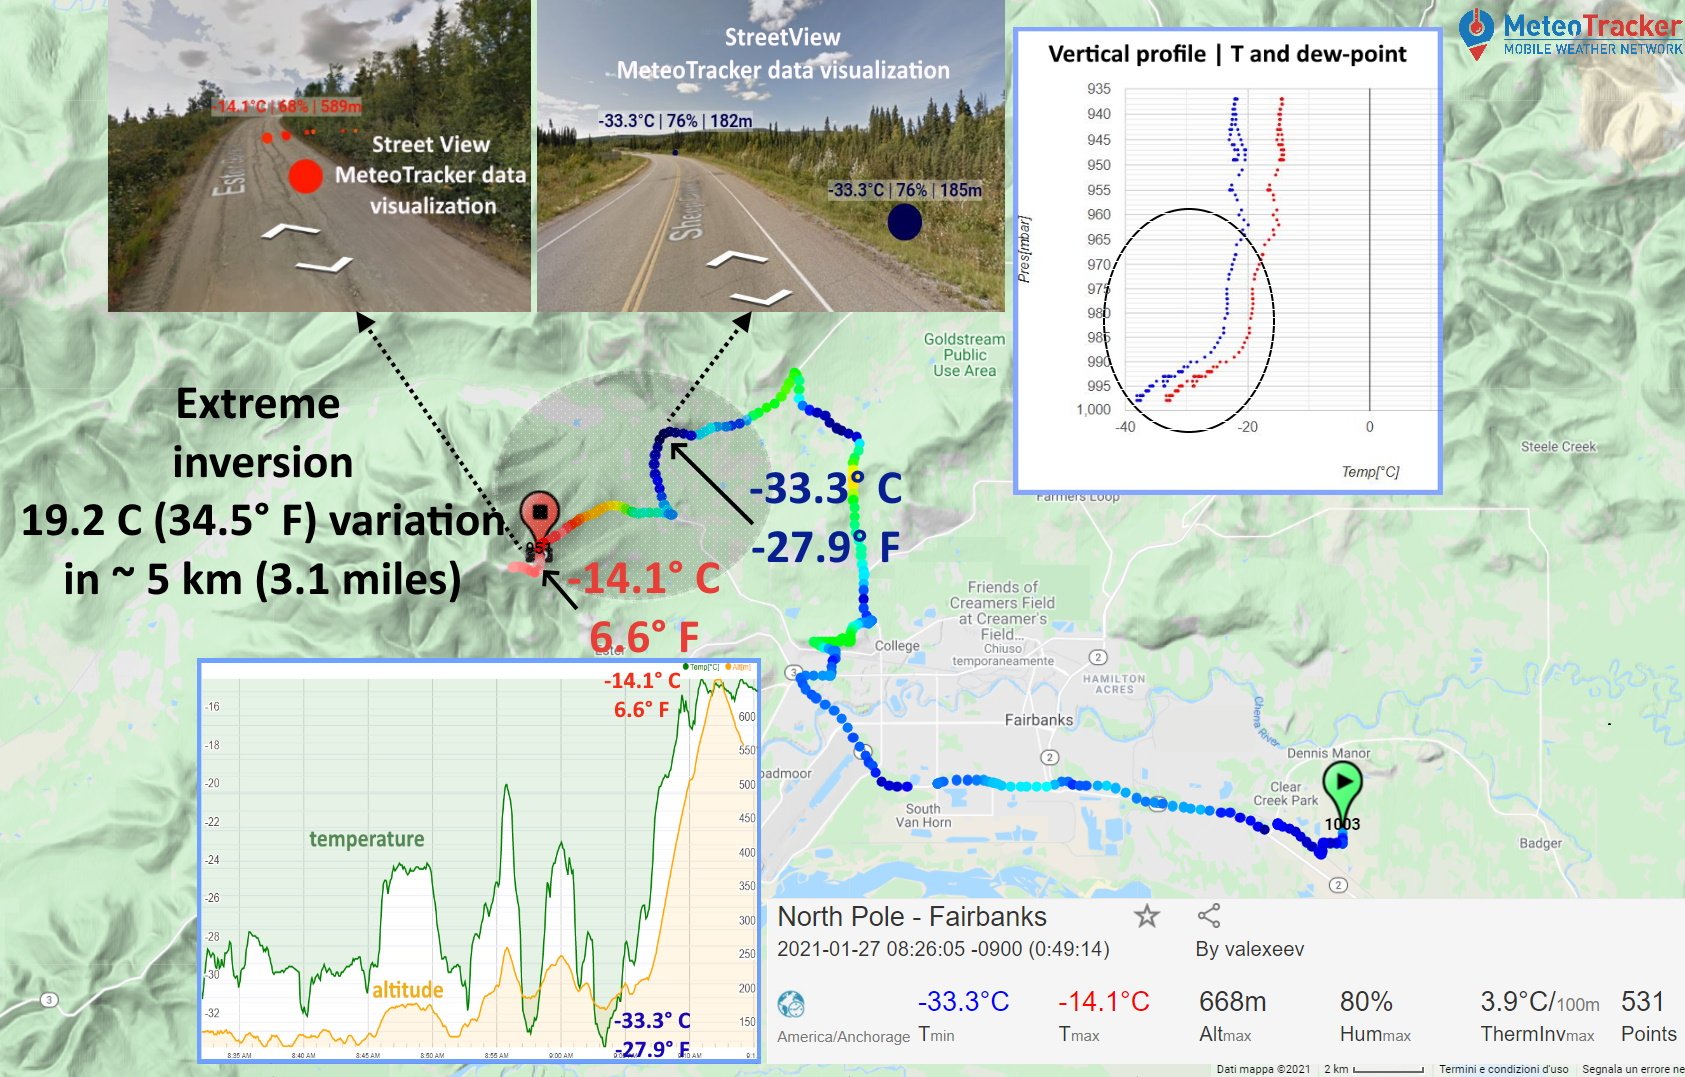
MeteoTracker now available on Indiegogo at promotional price (limited offer) *** New MeteoTracker low-record of -33.3° C (-27.9° F) and extreme inversion recorded during a MeteoTracker session in the Fairbanks area (Alaska) on January 26 2021! A difference of as much as 19.2° C (34.5° F) over a distance of approximately 5 km (3.1 miles), with an unbelievable temperature variation from -33.3° C (-27.9° F) to -14.1° C (6.6° F), was detected by Vladimir Alexeev (researcher of the International Arctic Institute, University of Alaska) at around 9 A.M. Alaska time. These are unprecedent measurements, for their systematicity and very high spatial resolution The data analysis performed on the MeteoTracker web platform (vertical profile graph and other tools) shows very well how strong the positive vertical temperature gradient was. Also, StreetView images with MeteoTracker data superimposed are available in the MeteoTracker web platform.
-
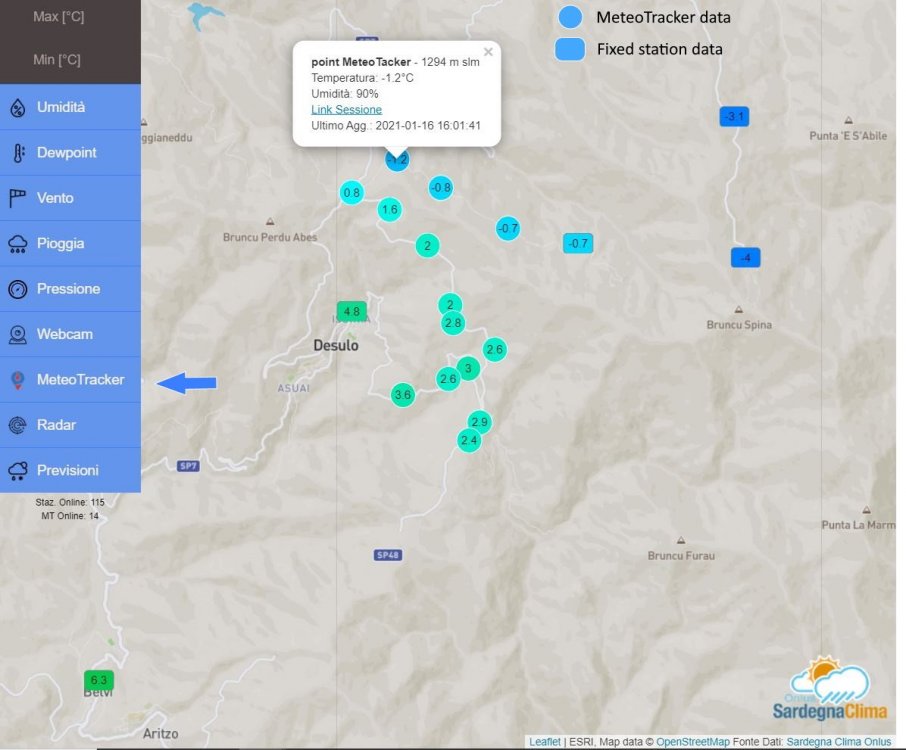
MeteoTracker API integration! First successful MeteoTracker data integration on a fixed station weather map (the Sardegna Clima Onlus stations network, the biggest in Sardinia). Thanks to the great work of our team, every weather network can now integrate MeteoTracker data in its weather map, adding a valuable insight into weather and climate knowledge of its region. The concept is to consider the data taken on the move as "temporary" fixed station, that "expires" after some time (30 minutes). So, in the map you can see the weatherpoints of the last 30 minutes (a weatherpoints is the geotagged set of temperature, humidity, pressure, altitude and dew-point), that progressively move as the vehicle proceeds (the "oldest" weatherpoints disappears and the latest weatherpoints appears in the map, so giving a dynamic representation in the a "fixed" context). Clicking on the weatherpoint, the complete session is displayed in the MeteoTracker platform (app.meteotracker.com). We think that there is huge potential for weather knowledge if the mobile approach is added to the "ordinary" static one (they complement perfectly each other). *** Only a few hours left for MeteoTracker pre-order at the special Kickstarter price http://e.fnd.to/meteotracker
-
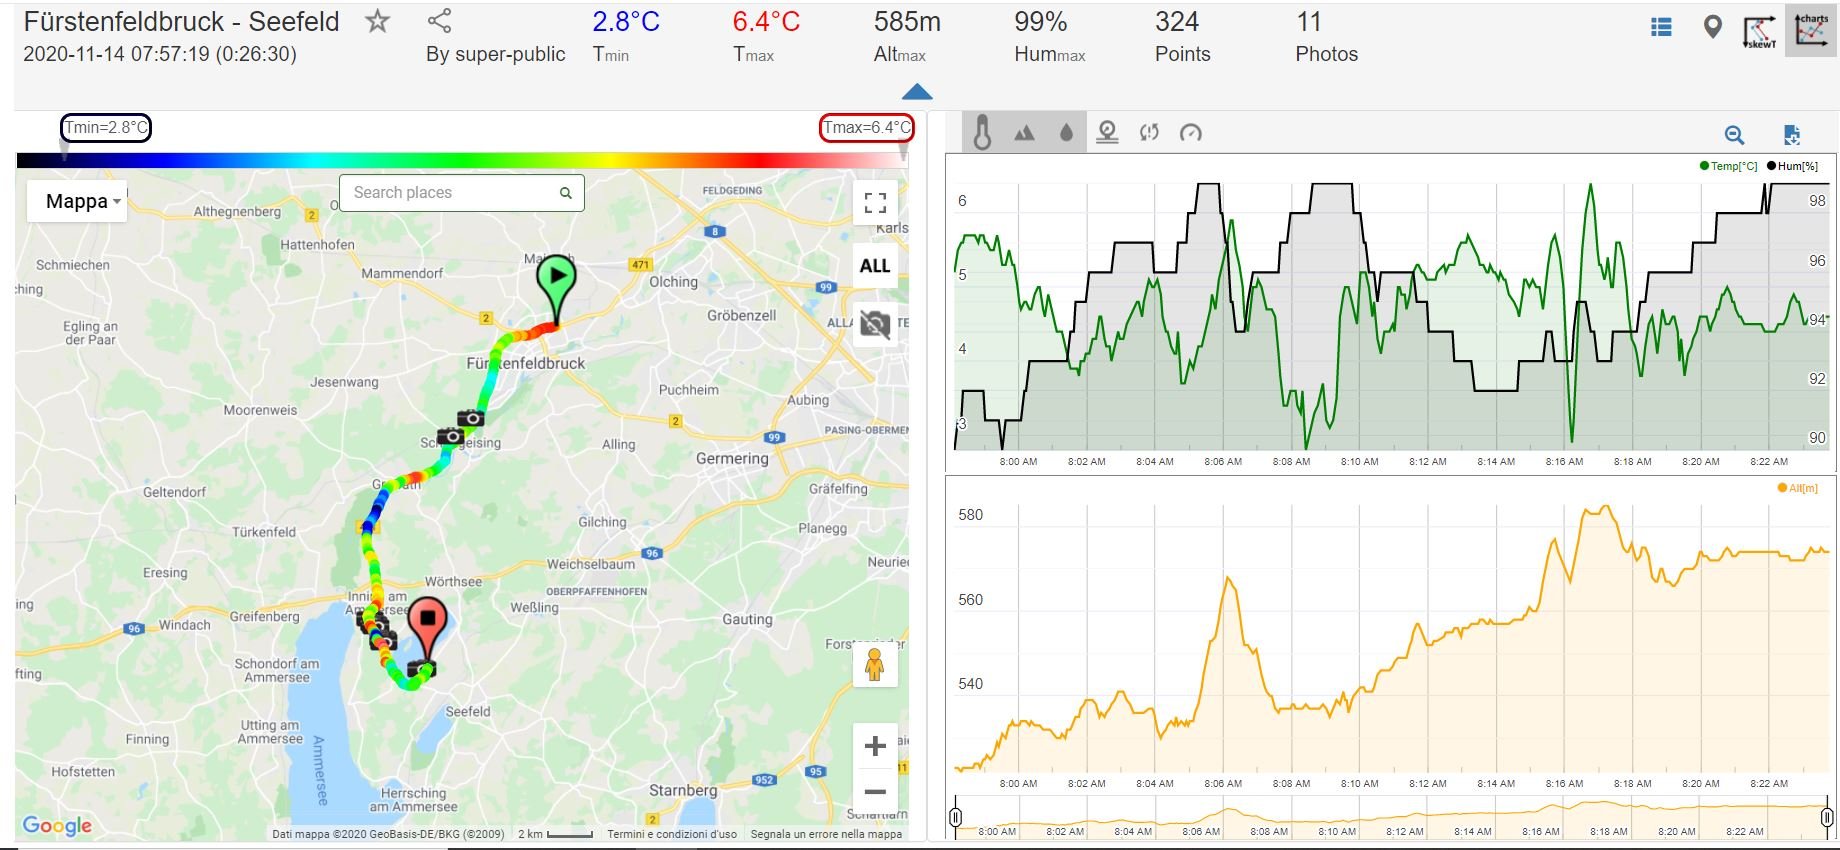
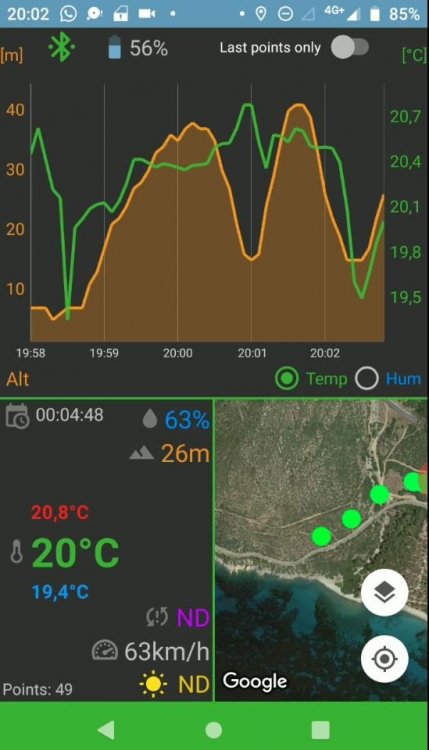
Hello everybody, we would like to respond to the requests for further information that a number of you have sent us regarding the App and the web platform. More info on Kickstarter, where MeteoTracker can be ordered with a 40% discount http://e.fnd.to/meteotracker IS THE DEW-POINT VISUALIZED ON THE APP? Yes, the dew-point is one of the parameters shown on the screen of the App. WHAT OTHER PARAMETERS ARE MEASURED AND SHOWN ON THE APP? Here is the complete list: Temperature (° C or °F, current value, highest and lowest value of the session) Relative Humidity (current value, highest and lowest value of the session) Pressure (current value, highest and lowest value of the session) Dew-point (current value, highest and lowest value of the session) Altitude vs. sea level - QNH (current value, highest and lowest value of the session) Vertical gradient indicator (current value, highest and lowest value of the session) Radiation Intensity indicator (under evaluation) Speed Number of weatherpoints collected Session start and arrival location, date, time and duration HOW IS THE ALTITUDE MEASURED? When the session starts, MeteoTracker measures the atmospheric pressure and correlates it to the altitude of that location, which is obtained by the App through a dedicated web service. Once the pressure-altitude correlation is set, every pressure variation is converted by the App to an altitude variation. Moreover, during the session the App periodically re-calibrates the altitude, in order to fix the accuracy degradation that may occur when travelling over long distances, due to possible barometric variations across the territory. HOW CAN I SHARE MY SESSION WITH MY FRIENDS? The App has a dedicated button that allows you to share the url of the session as well as any other link (by Whatsapp, email, Telegram, etc…). Sharing can be done on real-time (letting your friend share your weather travel) or for the archived sessions. Sharing is of course available on the web platform, too. WHAT PARAMETERS ARE VISUALIZED ON THE WEB PLATFORM? The same ones as those shown on the App. The web platform allows a deeper analysis of the weather data through advanced tools like map, up to 3 graphs with 2 plots each, numerical format, all (visually) correlated each other (selecting a point on the graph, the correspondent point in the map is highlighted and viceversa). Also, StreetView visualization with numeric values of the weatherpoint recorded in that point is implemented
-
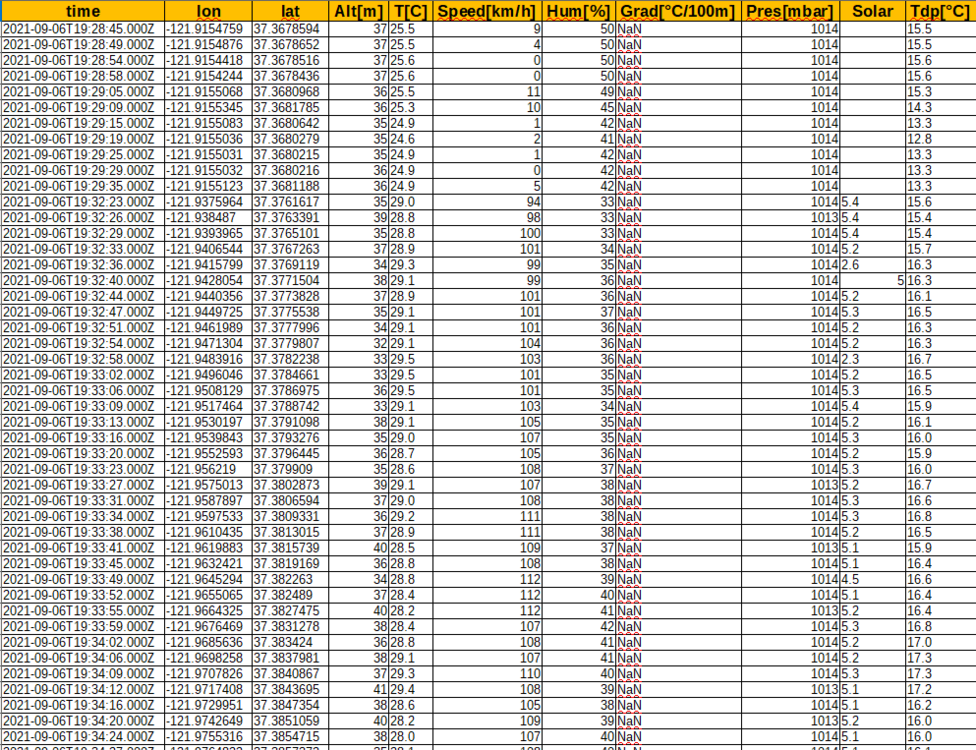
-32.9° C [-27.2° F] is the new lowest temperature measured by our mobile weather station network!It was recorded yesterday in Alaska, Fairbanks area, at 01:41:30 CET (15:41:30, December 18th Alaska Time).Data can be displayed on the MeteoTracker web platform on map, graph (including temperature vs altitude), numeric format and can be downloaded in CSV format.Also, Street View visualization allows to spot the exact point where the weatherpoint has been collected and by the MeteoPhoto feature a picture can be taken during a session, with the weather data taken at that instant superimposed on it.MeteoTracker’s Alaska campaign started on December 10th and is carried out by @Vladimir Alexeev, research professor at the International Arctic Research Center Alaska University (Fairbanks).A huge amount of very interesting data has been already collected, that is highlighting the very peculiar thermo/hygrometric distribution in the Fairbanks area, with up to 15° C temperature variation in very short distances.
-
A MeteoTracker technical review from a weather equipment professional https://www.kwos.it/joomla/it/articoli/154-meteotracker-the-weather-station-for-those-on-the-move **** MeteoTracker is on Kickstarter, here is the link for pre-ordering http://e.fnd.to/meteotracker
-
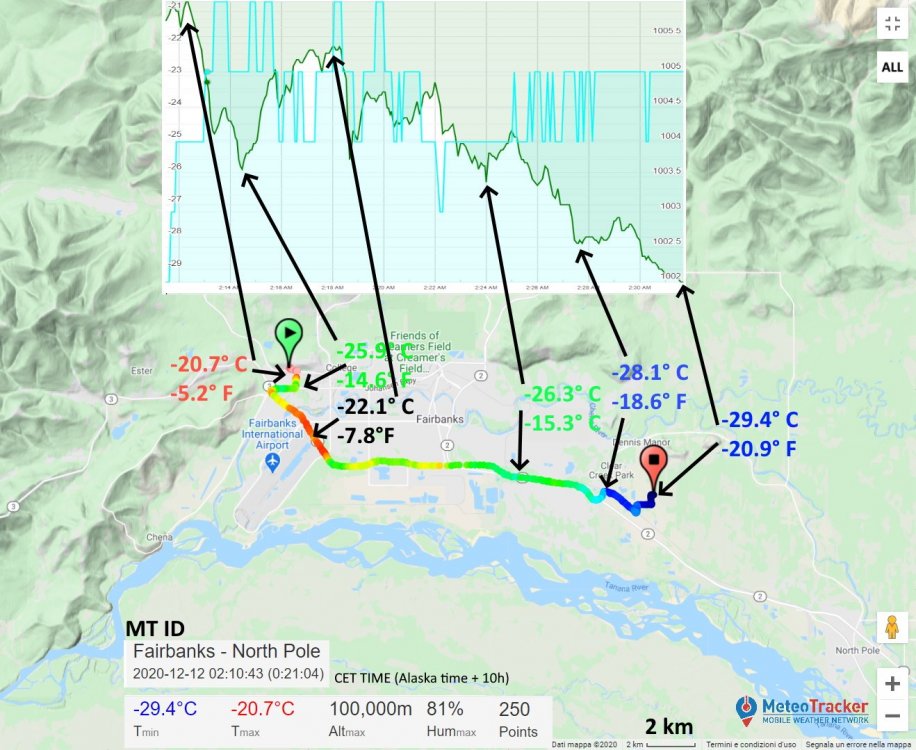
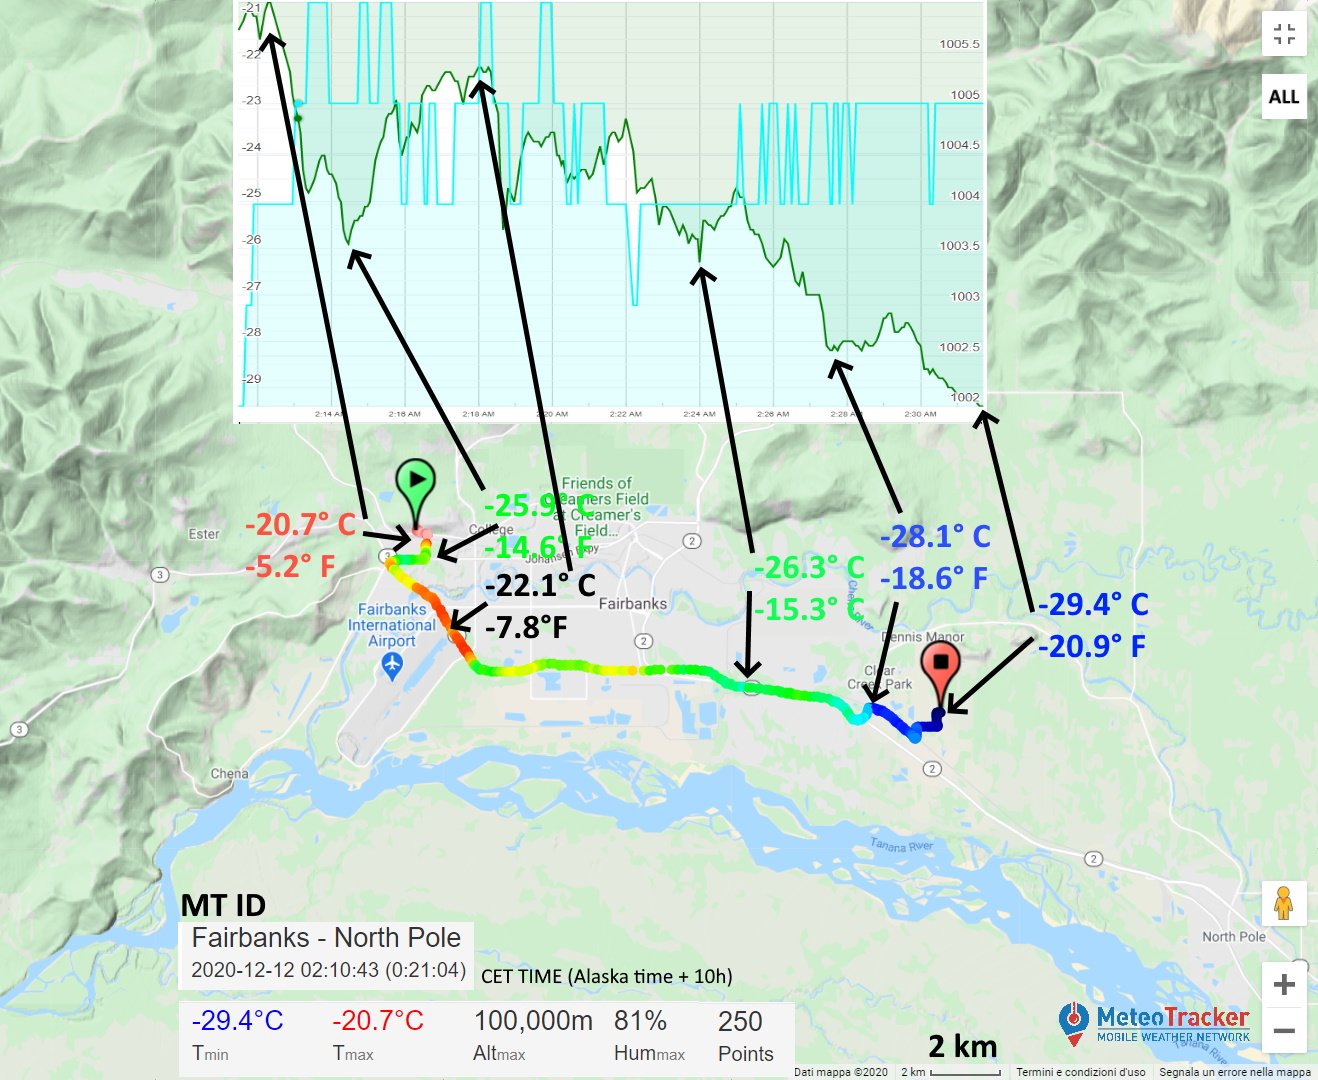
-29.4° C /-20.9° F. It’s the new lowest temperature recorded by MeteoTracker mobile weather network (the previous one was -10.0° C/14.0° F, measured in the Bavarian Forest, between Germany, Austria and Czech Republic). The new record has been measured in Alaska, close to Fairbank city, during a MeteoTracker session carried out as part of the campaign conducted by Vladimir Alexeev, research professor at the International Arctic Research Center (University of Alaska, Fairbanks). The relevant aspect is not the absolute value (which is in the normal range for the season) but the relevant thermal spatial variability, that in a few kilometers ranges from -20° C/-5.2° F to -29.4° C/-20.9° F. Thermal inversion phenomenon has a role in determining this thermal variation ratio even though from the altimetric profile cannot be seen a clear correlation between altitude and temperature. Next sessions will provide more insight on correlations between soil usage and typology, altitude profile, orography conformation and thermal/hygrometric profile.

-
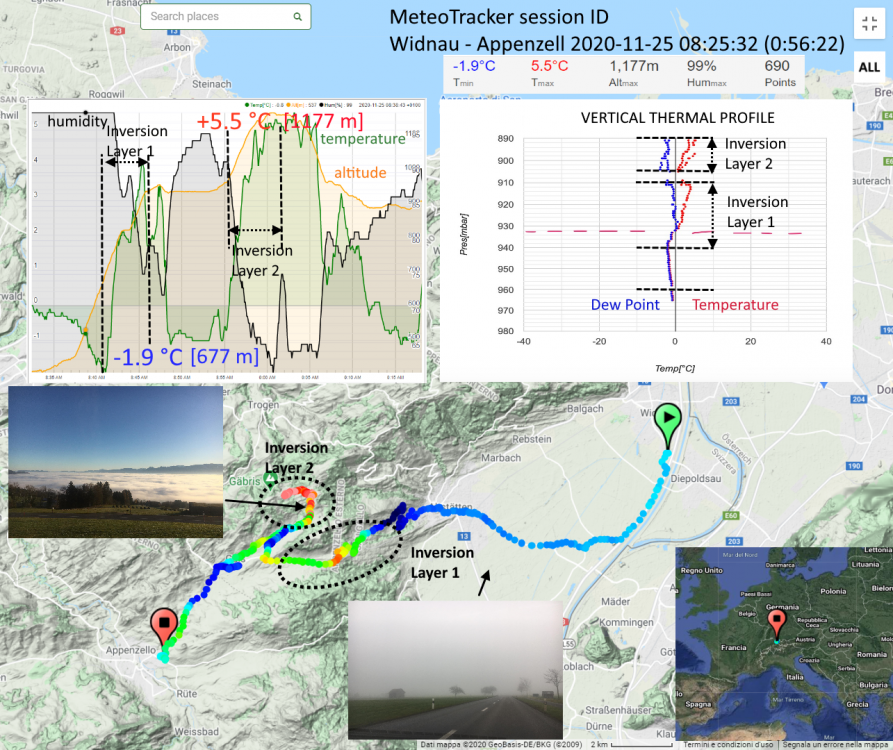
Another interesting session in strong thermal inversion
.thumb.jpeg.e60d0331efff579a39ac2cf3e0649bd3.jpeg)
-
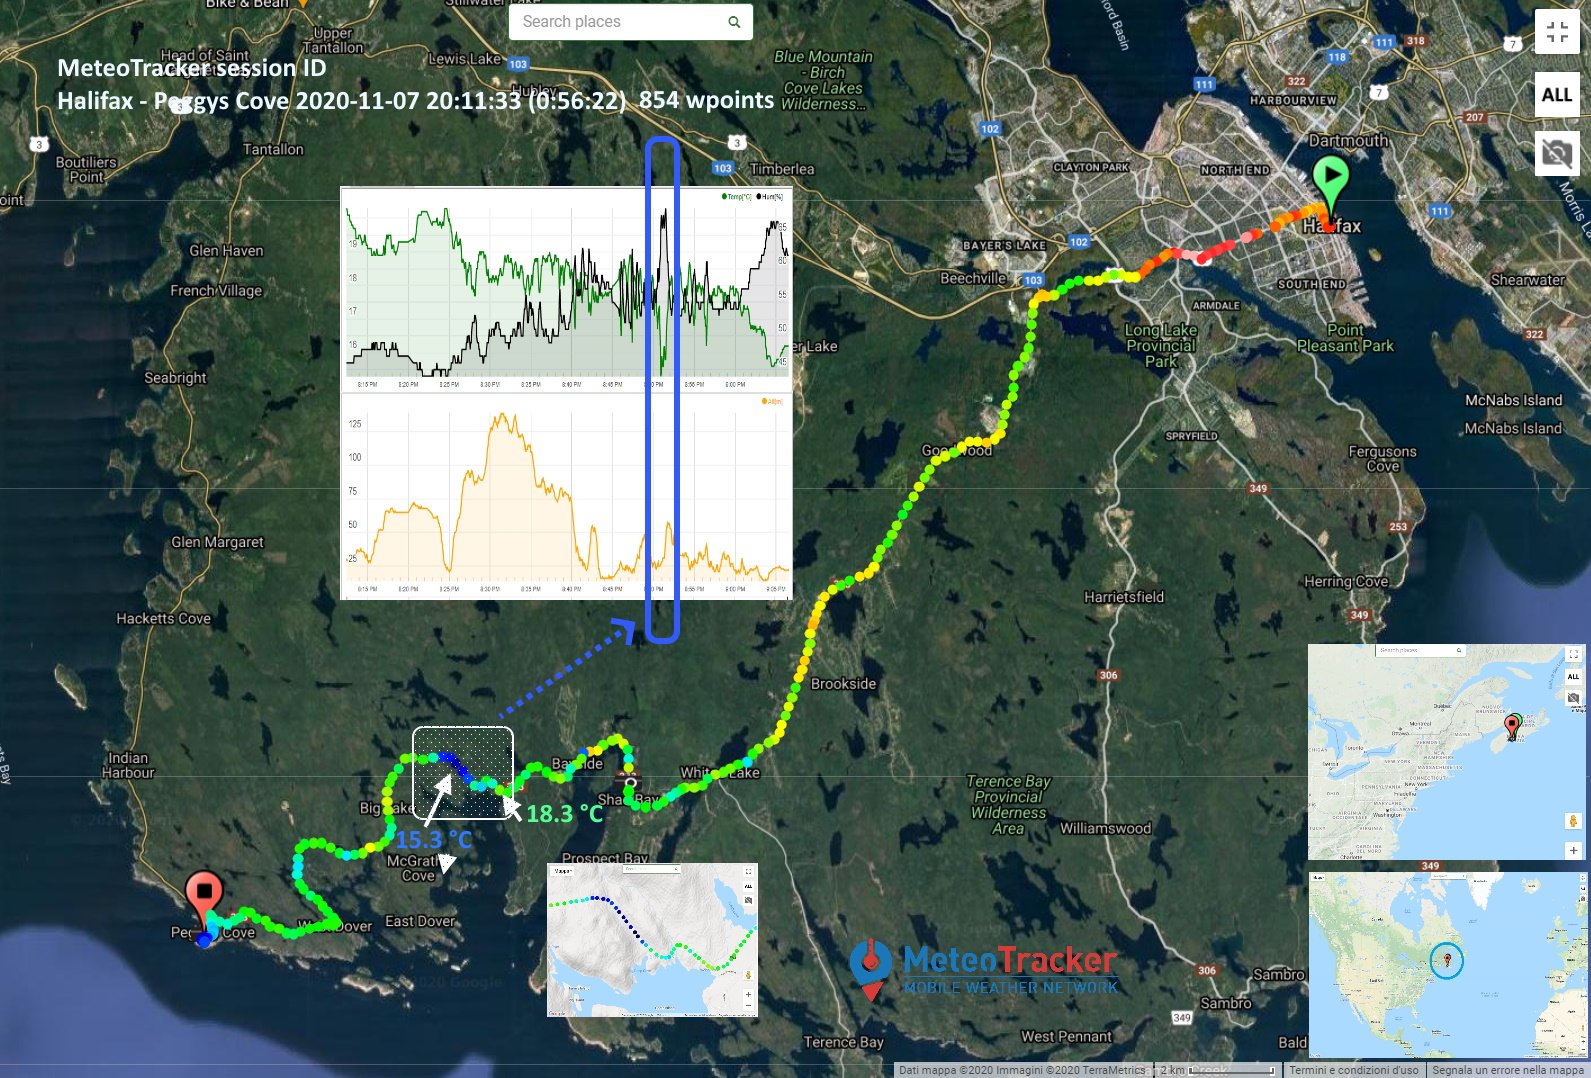
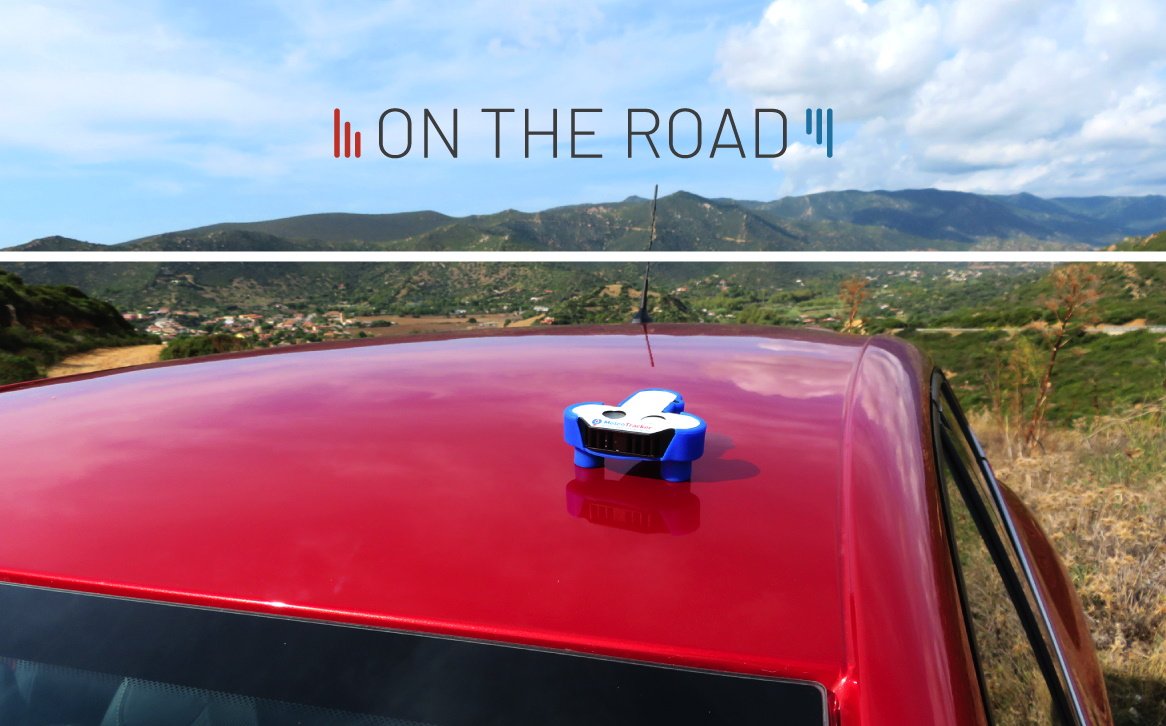
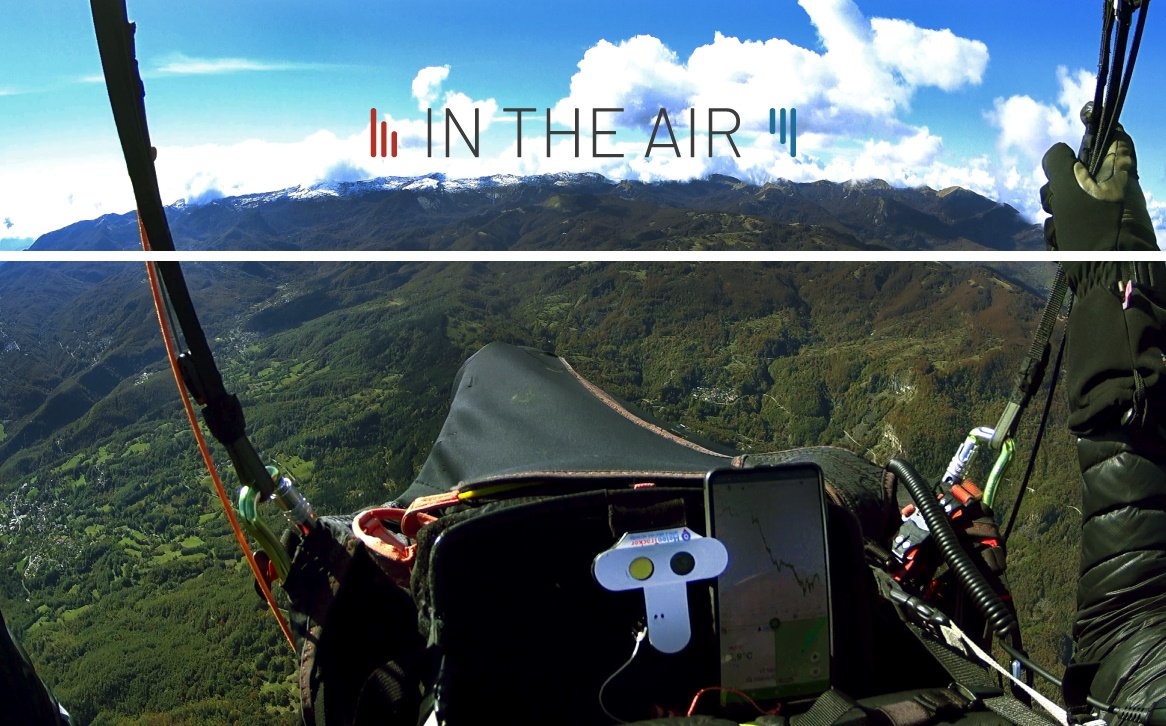
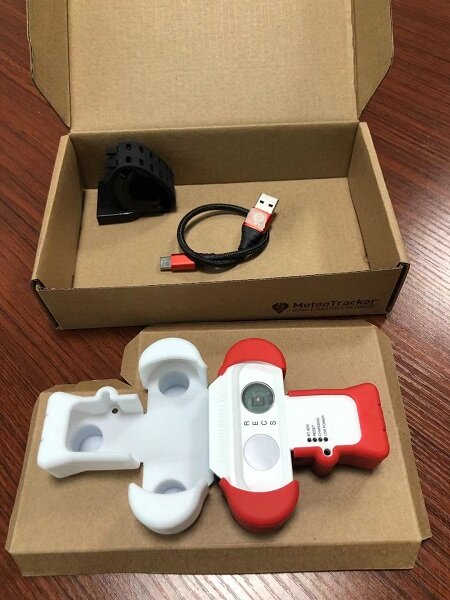
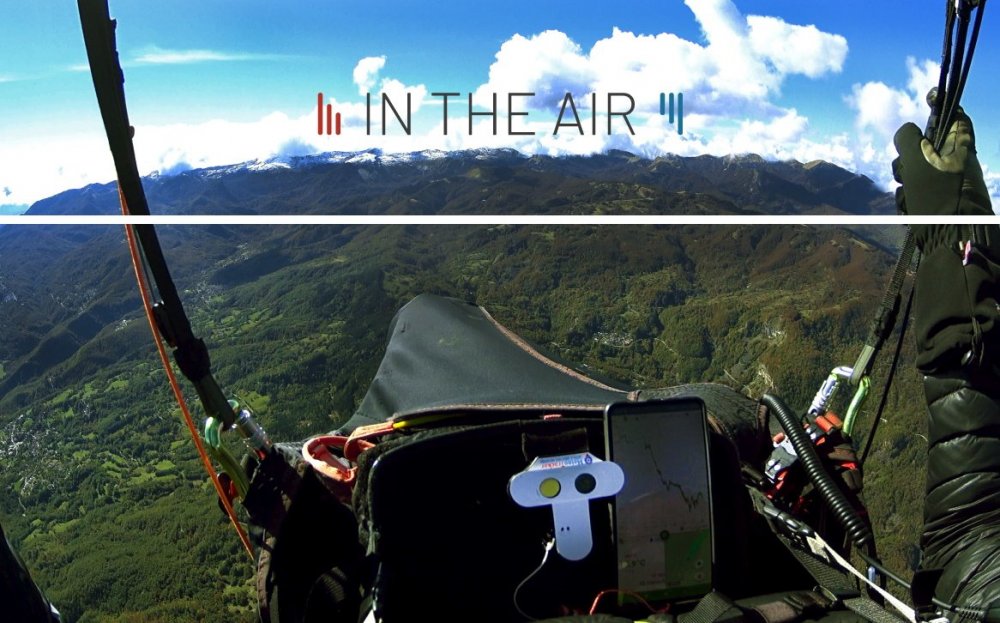
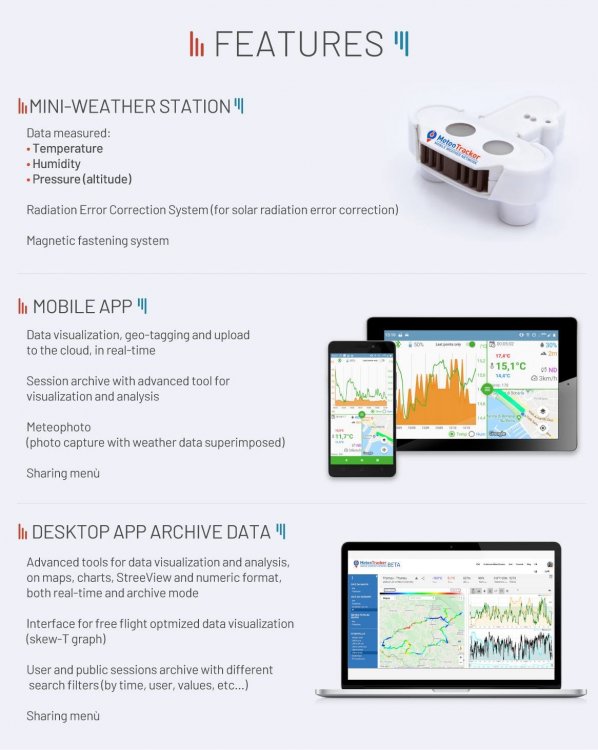
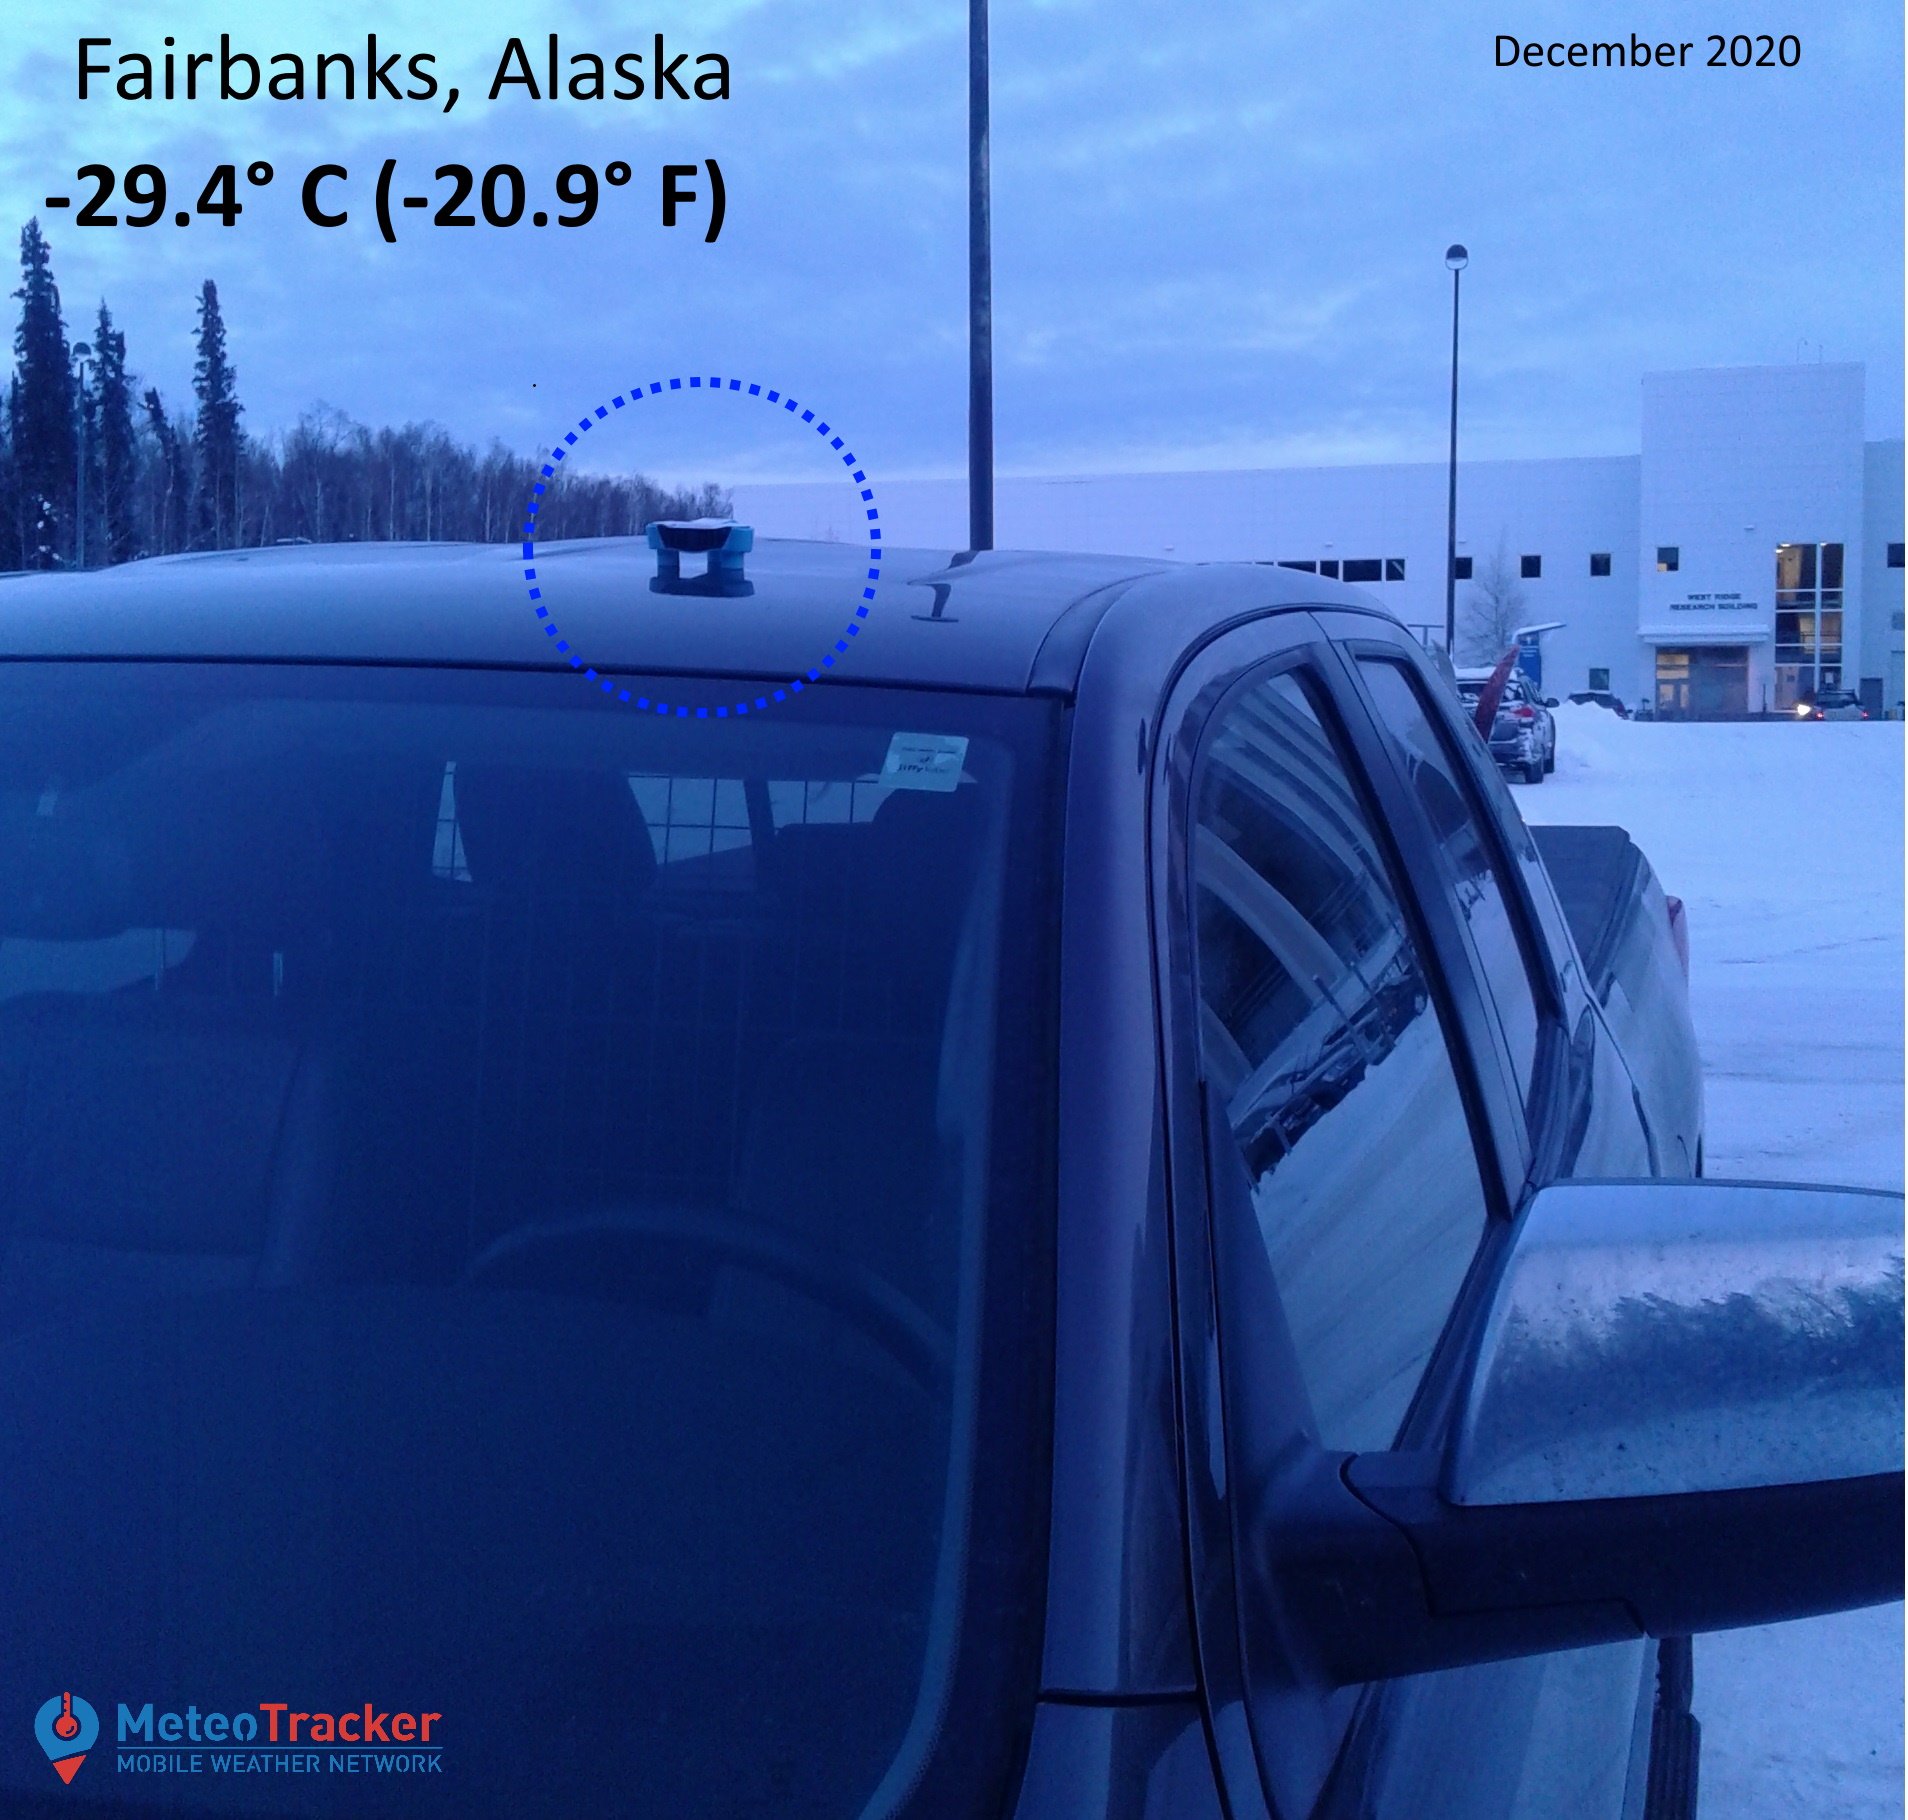
Hi everyone! MeteoTracker is a small (computer mouse size), portable weather station that attaches to the car rooftop (or any other vehicle) by its magnetic base and measures on the move ( with very high measurement speed), temperature, humidity, dew-point, thermal inversion index and pressure/altitude. The MeteoTracker App every few meters records, visualizes, geo-tags and sends the measured weather data to the cloud. The data are real-time visualized in the user smartphone and on a web platform, where they can be analyzed in depth by map, graphs and numeric format. The mini-station implements a patented system for solar radiation correction (RECS, Radiation Error Correction System), so that temperature measurements are very accurate even under strong solar radiation at very low speed. In turn, the absence of shielding structures allows the sensors ample exposure to ventilation and, therefore, very high measurement speed. This is essential for the correct measurement of sharp thermal variations typically encountered on the move. The operative range is -40 °C (-40 °F) 125 °C (257 °F). Here is a video on how a MeteoTracker session works Having completed the testing phase, which involved both enthusiasts and professionals, we've decided to move on to production. We'll leave you with some images of the MeteoTracker app and web platform and photos of the weather station and information on its functionalities. You can also analyze several of the sessions recorded by the MeteoTracker community at this link: app.platform.com. Below is the link to a session done on January 1st 2020 in the Bavarian Forest with temperature variation ratio up to 10.2 °C over 420 m distance. https://app.meteotracker.com/#!/shared/7h0ZMgulzPR3rWLujv%2BqJIyw1ukuofY8EvntGg8pcvM%3D Below is the link to a session done on January 1st 2020 in the Bavarian Forest with temperature variation ratio up to 10.2 °C over 420 m distance. https://app.meteotracker.com/#!/shared/7h0ZMgulzPR3rWLujv%2BqJIyw1ukuofY8EvntGg8pcvM%3D MeteoTracker is a project carried out by IoTopon, an innovative startup based in Italy and at the moment there more than 50 units in the field with more 1 million weathepoints already collected. You can support the project on Kickstarter: https://bit.ly/37sOkAg


.jpeg.6d8e1b47c3ad5e0fa90a62295ed08610.jpeg)