

aperson
-
Posts
44 -
Joined
-
Last visited
Content Type
Profiles
Blogs
Forums
American Weather
Media Demo
Store
Gallery
Posts posted by aperson
-
-
5 hours ago, f2tornado said:
This will not be a popular opinion here.
Hey dude it's really cool that you have an eidetic knowledge of long-tail events in Alabama but in the middle of your myopia you missed like twenty of the president's tweets where he was goading the media and sowing distrust in the NWS.
Anyway, if you have a better way to convey impacts in a tweet in response to the president's overblown impact assessment to Alabama that accurately conveys long-tail distribution outcomes to the general populace, I'd love to hear them!-
 1
1
-
 1
1
-
-
5 hours ago, f2tornado said:
This will not be a popular opinion here. The BMX tweet would have been the end of it however ABC Nightly News turned the tweet into a hit piece on the President in an effort to stick him with a gaff. The President then lashed out at the reporter and the pile on began. I have rarely seen this kind of media passion to turn a nontroversy into a controversy.
Consider the following published from BMX seven years ago
AREA FORECAST DISCUSSION
NATIONAL WEATHER SERVICE BIRMINGHAM AL
626 PM CDT THU AUG 23 2012

TROPICAL SYSTEMS ARE NEVER BORING OR EASY TO FORECAST AS ISAAC
CONTINUES TO CHALLENGE.
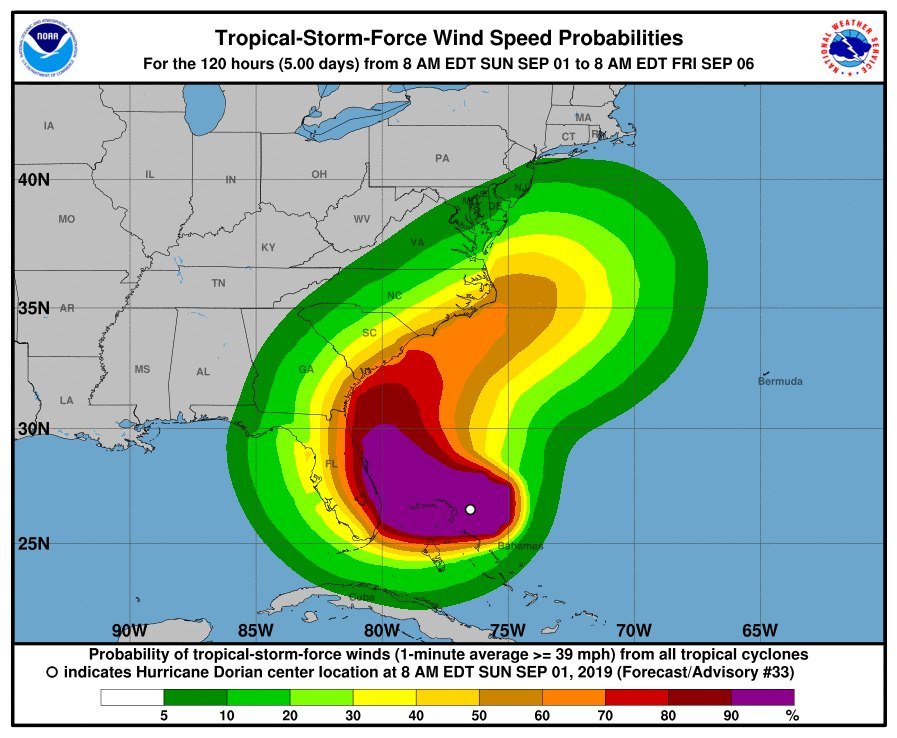
Kudos to the BMX forecaster who had the utmost confidence to publish an effective 0% forecast "no impacts... felt across Alabama" via Twitter in spite of the same office previously noting forecast difficulty with tropical systems. This conflicted, albeit slightly, with the NHC published probability distribution of TS winds covering a portion of AL. Further, it was somewhat inconsistent with the morning 9/1 Tallahassee AFD which covers southeast AL and stated, "The latest forecast for Hurricane Dorian from the National Hurricane Center continues to keep it east of the local area. While we still shouldn't let our guard completely down, the chance of impactful weather from Dorian occurring in our forecast area remains low".
BMX should be no stranger to forecast uncertainty. Take a look at the forecast cone for Hurricane Isaac (2012) that at one time was nearly centered over BMX. In fact, the entire state of Alabama was enveloped within the cone before none of the state was in the cone. It should be noted, even though the entire state of Alabama was outside the forecast cone toward landfall, the Mobile area did experience some TS force gusts and impact from surge. The cone only represents the storm center forecast track. This is why NHC storm wind probabilities are smeared well outside the cone with time and why forecasters should be cautious speaking in absolute terms, particularly when the average error for a tropical system is about 200 miles on day 5.
Hey dude it's really cool that you have an eidetic knowledge of long-tail events in Alabama but in the middle of your myopia you missed like twenty of the president's tweets where he was goading the media and sowing distrust in the NWS.
-
2
-
 3
3
-
-
6 hours ago, Windspeed said:
I feel like Ventrice busts a lot but I thought his posts on this domain were really interesting, especially given the timing and infrequency of SHem SSW events:
-
Can someone that knows the climatology of weenie meltdowns tell me where this one is on the list?
-
1
-
-
First I laughed then I cried because this is going to erode public trust in meteorologists so much more.
-
Just now, Will - Rutgers said:
Watching Ryan Maue defend this sharpie bullshit is actually more entertaining than the sharpie bullshit itself. He has a PhD.
Oh my god why didn't I think to check in on this thank you
-
2
-
-
On 8/30/2019 at 2:12 PM, bluewave said:
The dipole reversal around August 20th was one for the record books. We are not that far from the 2007-2018 NSIDC annual average daily minimum extent of 4.51 million sq km.The average minimum extent before 2007 was 6.18 million sq km from 1994 to 2005. Arctic amplification really took off once minimums began to regularly fall below 6 million sq km.


Don't look now or you may get whiplash. Energy from Lingling and Dorian in tandem with the current configuration look to constructively split the TPV and resume a +DA pattern.

-
3 hours ago, RevWarReenactor said:
On public property. Peaceful. Not harming anyone.
There are no broken laws there. The govt can't close public property and charge you with a crime. Its different if my presence could harm someone else (such as standing in the middle of an interstate).
What they do is unconstitutional. I have argued with people who've told me to leave beaches. They always tell me the cops will come and "take me away". Its all hot air. No cops ever show and if they did, they cant do anything. I've broken no laws.
I just checked the bill of rights and didn't see the clause about "Can assemble on public property unless it's a national security or traffic issue"
-
1 minute ago, hlcater said:
the point of my post is that dvorak blows and should only be used if there are literally no better alternatives
I agree with you 10000%. Although I do like its eye temp enhancement.
I've also been seeing posts on twitter talking about how strong Haiyan must be compared to Dorian at peak intensity because of how their dvorak presentation was different, so I have accumulated a bit of salt that I had to let out in a blaze of sarcasm. -
2 minutes ago, hlcater said:
Because everyone knows that Dvorak is the best intensity estimation method out there, firmly beating recon aircraft in every metric.
um actually that means it's even stronger than a major because dvorak underestimates atlantic basin cyclones due to tropopause heights
-
http://www.realclimate.org/index.php/archives/2019/06/unforced-variations-vs-forced-responses/QuoteUntil recently, the hypothesis that there are significant natural (unforced) ocean cycles with an approximate periodicity of 60-70 years had been widely accepted. The so-called Atlantic Multidecadal Variability index (AMV, sometimes called the AMO instead), but also the Pacific Decadal Variability index (PDV) have been touted as major factors in observed multidecadal GMST fluctuations (for instance, here). Due to the strong co-variability between AMV and GMST, both, the Early 20th Century Warming (1915-1945) and the Mid-Century Cooling (1950-1980) have been attributed to low-frequency AMV variability, associated to a varying degree with changes in the Atlantic Meridional Overturning Circulation (AMOC). In particular, the uncertainty in quantifying the human-induced warming fraction in the early 20th Century was still substantial.
In contrast to those earlier studies, we were able to reproduce effectively all the observed multidecadal temperature evolution, including the Early Warming and the Mid-Century cooling, using known external forcing factors (solar activity, volcanic eruptions, greenhouse gases, pollution aerosol particles). Adding an El Niño signal, we virtually explain the entire observed record (Figure 1). Further, we were able to reproduce the temperature evolution separately over land and ocean, and between Northern and Southern Hemispheres (NH/SH). We found equally high fractions of explained variability associated with anthropogenic and natural radiative forcing changes in each case. Attributing 90% of the Early Warming to external forcings (50% of which is due to natural forcing from volcanoes and solar) is – in our view – a key leap forward. To date, no more than 50% had been attributed to external forcing (Hegerl et al. 2018). While there is less controversy about the drivers of the Mid-Century cooling, our response model results strongly support the idea that the trend was caused by increased levels of sulphate aerosols which temporarily offset greenhouse gas-induced warming. -
6 hours ago, snowlover91 said:
There is plenty of research out there that suggests the arctic ice extent we see today is something that is cyclical and was also seen in the 1920-1950 period. My original statement was also correct; 2007-2018 has seen no discernible changes/trend in ice extent and recent years have seen slight increases compared to the 2007-2012 averages. People such as yourself take 30-40 years of data and assume that CO2 is responsible for everything we see without acknowledging or engaging in intelligent discussion of alternative possibilities that could explain some or all of the changes being seen. You said my 11 years of data is too short term and yet you want to take 38 years of data as sufficiently long enough? Ok then, double standard much?
Here's a VERY detailed article listing an abundance of information that indicates the ice levels in this period (1920-1950) were probably similar to what we see today (but not as low as 2007 and 2012). In other words, historically we may have seen ice levels nearly identical to what we are seeing now when the CO2 levels were much lower. This certainly indicates there are natural cycles and variations ongoing, contrary to your flawed assumption that CO2 must be the only possible explanation. https://judithcurry.com/2013/04/10/historic-variations-in-arctic-sea-ice-part-ii-1920-1950/
Reconstructions of the Arctic ice levels indicate some interesting details as well... but sure go ahead and ignore this scientific research since it obviously must be wrong since it disagrees with "consensus science" as you would say.
According to this new dataset, the recent period of Arctic sea ice retreat since the 1970s followed a period of sea ice growth after the mid 1940s, which in turn followed a period of sea ice retreat after the 1910s. Our reconstructions agree with previous studies that have noted a general decrease in Arctic sea ice extent (for all four seasons) since the start of the satellite era (1979). However, the timing of the start of the satellite era is unfortunate in that it coincided with the end of several decades during which Arctic sea ice extent was generally increasing. This late-1970s reversal in sea ice trends was not captured by the hindcasts of the recent CMIP5 climate models used for the latest IPCC reports, which suggests that current climate models are still quite poor at modelling past sea ice trends. Nor is it described in previous Arctic sea ice reconstructions such as the Walsh dataset or the widely used HadISST sea ice dataset, although some recent studies have noted similar reversals, e.g. Pirón and Pasalodos (2016) and Alekseev et al. (2016)." https://www.tandfonline.com/doi/pdf/10.1080/02626667.2017.1324974
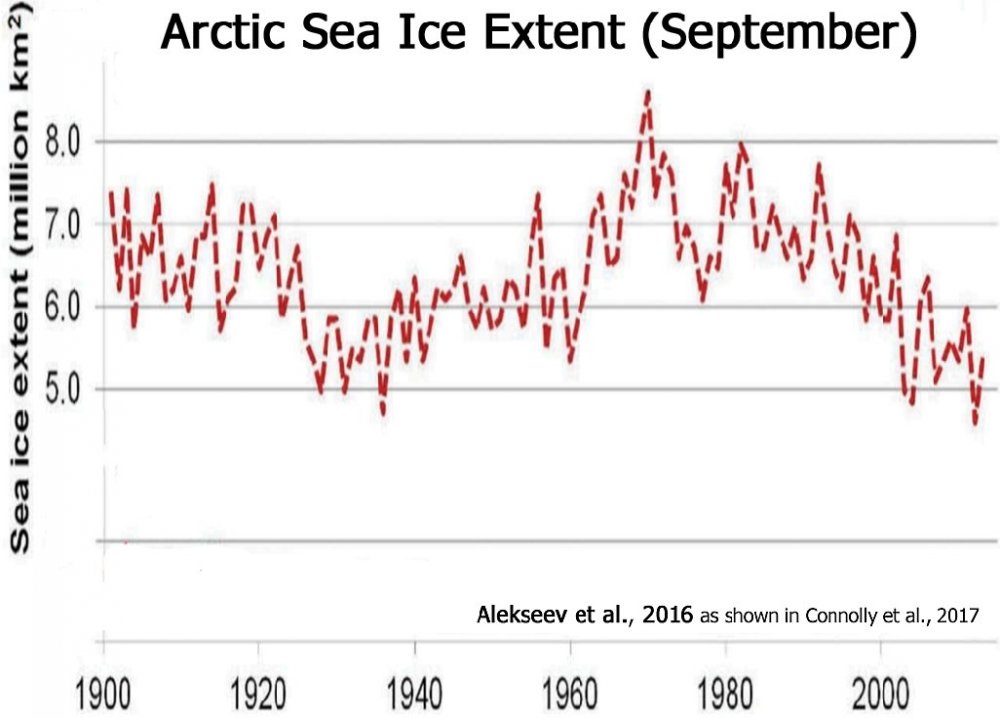
Connolly et al., 2017: https://www.tandfonline.com/doi/full/10.1080/02626667.2017.1324974
QuoteIndeed, Alekseev et al. (2016) recently used Arctic summer surface air temperatures as a direct (inverse) proxy for September Arctic sea ice extent by applying a simple linear regression relationship. Alekseev et al.’s approach bypasses the problems from the multiple data sources described above. It therefore offers a useful approximate estimate of Arctic September sea ice extent trends for the 1900–2013 period. However, because the Alekseev et al. (2016) reconstruction is essentially an inverse Arctic summer temperature index, it cannot be used for studying the relationship between Arctic sea ice extent and surface air temperatures outside the satellite era (as that would lead to circular logic). Also, it discards all of the pre-satellite era direct observations of Arctic sea ice incorporated in the Walsh and Zakharov datasets.
Emphasis mine.
Thus the Alekseev et al. 2016 data set cannot be used to refute the CO2 hypothesis impact on SIE, that is CO2 -> increased temperature -> decreased SIE, because doing so is a circular argument.The rest of your posting career is a similar abuse of scientific literature. People don't engage you because you're correct (you're delusional), they don't engage you because of the Bull**** Asymmetry Principle.
-
1
-

Arctic Sea Ice Extent, Area, and Volume
in Climate Change
Posted
JAXA is now in third place. You going to disappear like you usually do when things aren't going your way?
PS, I would love to see you post your verification report on the ASIF where you claimed in July that top 3 SIE/SIA was not happening and top 5 was unlikely.