

raindancewx
-
Posts
3,852 -
Joined
-
Last visited
Content Type
Profiles
Blogs
Forums
American Weather
Media Demo
Store
Gallery
Posts posted by raindancewx
-
-
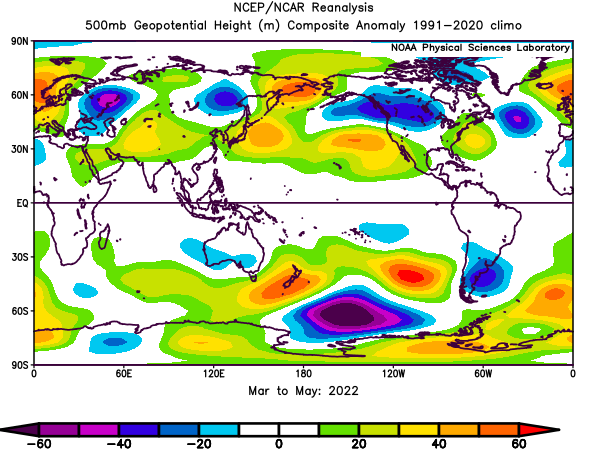
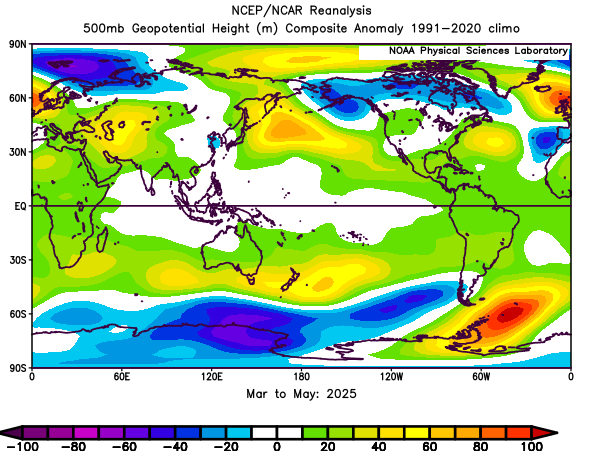
The Spring globally had at least a passing resemblance globally to 2022. That's consistent with my idea of a pretty wet Summer in the deserts of North America (MX/SW US). The big highs from Japan due east and off the SE US, with low pressure Aleutians to North Dakota are similar. Southern Hemisphere and Asian Plateau setups are pretty different but those aren't super important for us in the Summer in the US. MJO has a passing similarity for late May in 2022 v. 2025 in terms of the wind anomalies by the tropics at about a 1-2 week difference for timing (green on the images for 15N-15S)
-
 1
1
-
-
May 2025 has a decent resemblance to a blend of May 2007/2016 so far. Blazing heat north central us, some coolness south central us, and then muted anomalies by the coasts.
Monsoon development looks like it is on schedule in old Mexico. Models have had a cooler than normal Summer for the Southwest. On-time monsoon development is consistent with that idea.
Cold/Wet July tends to precede snowy December here. We really haven't had a big December in a while locally - since 2015. It is about due. Cool June is a decent indicator for out-of-winter heavy snow events locally, so will be watching that too. My hunch is we get a warm/wet winter, with cool Fall. But we'll see. Very early.
-
This is an image of the hail storm I was talking about the other day. Pretty amazing demarcation of white v. brown.

-
4
-
 1
1
-
-
We had a pretty impressive highly localized hail storm west of the city today. I had to walk through a parking lot to get to my car. The hail and the melt water were deep enough that the water level was above my ankles and fully flooded my shoes. I tripped on the ice about 40 stairs up on an exposed outdoor staircase and promptly fell to the bottom. But I was able to prevent my head from bashing into the ground with my hands. Less than a mile away, no evidence of hail. The storm was about 4-4:30 pm, and the hail has still not fully melted off the car as I look at it now at 10 past 7 pm. I would guess we had 5-7 inches of accumulation of nickel to quarter sized hail even though temps never dropped below the 50s. Hail is nasty business as the ten cuts on my hands will attest to.
I've had to get minor roof repairs four times in the 12 years I've owned my home here from hail damage.
The little snow event / rainstorm we had in April was nice after such a long, dry winter and early Spring. As always, severe cold shots/snow events here in mid-late Spring are highly tornadic systems down the road.
Monsoon looks like it will be active to me, and the long-term models are hinting at a relatively cool Summer here.
-
Good to see my analog method still works. I wasn't crazy for thinking the past winter would be like 2013-14.
I never showed my forecast here, but the idea was essentially a bunch of years with alternating waves of expansive record warmth, brief record cold, and more concentrated modest cold. So I expected the 2013-14 aspect of the pattern to persist with less consistency and severity but I expected that was the closest analog overall. Locally I forecast three weeks of severe cold and ten weeks of near-record to record warmth which worked pretty well.


-
The Euro plume last February had the correct idea for the Fall. Same simulation shows an El Nino Fall 2025. We're way way way overdue for a meaningfully wet year out here. I don't think we've had a 12 month period more than 10% above average for precipitation in over a decade.
When Nino 1.2 is in the opposite phase of the PDO, the PDO tends to decay toward Nino 1.2, so we've seen ongoing weakening of the -PDO, and that should continue. I don't really consider this event a La Nina. We had atmospheric La Nina conditions for small parts of the winter, but it never sustained from Fall to Spring like in a real event. This winter felt a lot more like a cold Neutral, in terms of where the cold and precipitation went. Cold neutrals tend to be very wet in the South, La Ninas tend to be very dry there. US also tends to have pretty cold winters around the major moves in the PDO cycle (2013-14, 2014-15 after a run of very -years, 1976-77, 1977-78, 1978-79, etc etc)


-
6
-
 3
3
-
-
These -10 to -20 dew points we've been seeing in New Mexico, + the arctic air are a pretty potent combination. I don't think the cold would have penetrated with mid-20s down to New Orleans and Pensacola without both. If anything resembling this level of dry air remains in the West when heat and moisture return from the Gulf in 4-8 weeks, it's going to be stupidly tornadic in the mid-south in the Spring.
-
On 8/31/2024 at 4:26 PM, raindancewx said:
My forecast calls for -3 to -5 for the Northeast this winter, with the first ever 0" snowfall season for the Boston area. Nothing but 37-42 degree rain, with storm after storm moving in during the 'just warm enough' afternoons but never at night. After each storm, a powerful cold front will drive through pushing temps well below average overnight. These cold fronts will also clear the moisture out of the air. So lows will be cold with highs near average. But timing will prevent measurable snow. You saw it here first.
Meanwhile due to slightly better timing, with storms arriving in the morning, Philadelphia and DC will be just cold enough for each system, and see 50-60 inches of snow. The South will be graced with ice and sleet, floods, tornado outbreaks, with the Plains and West alternating between brief record cold snaps and +10 readings for the rest of the winter.
Pretty historic south of I-10 snow in the South fits the bill. I'm sure the Don guy will complain the BAMWX only called for two inches in New Orleans in a couple days or something.

I liked 2013-14 in the fall for this winter as an imperfect guide to this winter for four reasons -
1) -WPO in Nov/Dec when it was pretty cold at times for a lot of the US like I expected this year. The idea was this year was a bridge pattern to a neutral/positive PDO future, as 2013-14 was.
2) For those of you in the NE, you didn't really have major storms in 2013-14. Just a lot of small events. Philly had 14 days with an inch of snow but only 5 of those 14 days had over 4 inches. Only 3 of 14 were over 6 inches. That's despite 68 inches of snow.
3) My research from prior winters still supported a lot of cold days (5F below average for the day or colder) in ABQ even with ACE getting higher in October. The data implied 22 cold days for Nov-Feb here. We're at 11 cold days in January following 7 total in Nov (6) and Dec (1). We actually may end on the high side of the correlation...although it does look much warmer after this cold snap. I believe we're seeing the coldest Jan 1-20 locally since 2013, and that's with very warm days in the 60s early month. In Dec 2013 we had 8 or so cold days, and I assumed everything would be delayed a month or so v. 2013, and blended in with the other similar years.
4) The US tends to see one pretty cold winter 0-18 months within both the top and bottom of the solar cycle. Think 2009-2010 and 2013-14 or 2014/15 last time. 1995-96 and 2000-01 or 2002-03 before that. More recently 2020-21. You can go further back - 1976-77 and 1981-82, it holds up in nearly all the cycles.
The Bering Sea Rule that I use for 17-21 days lead times on the WPO implied a very -WPO look for most of January would fade late month based on NE Asia storm tracks in December. CPC now has the SW US cold in the 6-10 and 8-14 period, with the East & Plains warm. For Feb-Apr that's the pretty canonical +WPO look, particularly since the breakage of the -WPO should accompany wetter conditions for California. Also forecast now. It's not really -PNA dominance, that's coldest NW and dry in the SW US.

-
1
-
2
-
-
On 8/31/2024 at 4:26 PM, raindancewx said:
My forecast calls for -3 to -5 for the Northeast this winter, with the first ever 0" snowfall season for the Boston area. Nothing but 37-42 degree rain, with storm after storm moving in during the 'just warm enough' afternoons but never at night. After each storm, a powerful cold front will drive through pushing temps well below average overnight. These cold fronts will also clear the moisture out of the air. So lows will be cold with highs near average. But timing will prevent measurable snow. You saw it here first.
Meanwhile due to slightly better timing, with storms arriving in the morning, Philadelphia and DC will be just cold enough for each system, and see 50-60 inches of snow. The South will be graced with ice and sleet, floods, tornado outbreaks, with the Plains and West alternating between brief record cold snaps and +10 readings for the rest of the winter.
This may actually work out pretty well. I was only half kidding when I wrote it.
-
 3
3
-
-
No idea if it will hold, but my basic premise since Summer has been a 2013 / 2021 lag approximating 2024 based on different MJO progression timing. The alignment and magnitudes are not perfect, but it's damn close over a long period for a simple blend with some pretty impressive changes and flips in patterns.
Sorry, just got sick of all the stupid bickering with none of you having viable combinations for the winter. I finished my forecast 10/10 like I always do...just decided not to share it. Anyway - since no one is going to do what I asked and delete my profile here I might as give some clarity as I see it.
August 2013/2021 v. Sept 2024 - maybe add a degree


Sept 2013/2021 v. October 2024


Oct 2013/2021 v. Nov 2024


Nov 2013/2021 v. Dec 2024 - we'll see if this holds.


January would go back to a -PNA look based on Dec 2013/2021, with cold north and west. February would be a repeat of Dec - cold east, warm west. March/April then see the Plains pretty cold.
-
2
-
2
-
1
-
 1
1
-
-
I'm completely serious. I want out. I've been trying to delete this for days.
-
Can someone delete my account? I'm done with this site. Thanks.
-
1
-
 2
2
-
 1
1
-
 2
2
-
-
WPO was extremely positive in 2022-23. Looks very negative on the Canadian. Models are garbage at this range. But the WPO was very positive in 2022 in October. Doesn't look like it will be very positive this month. Almost impossible to get record heat in CA/NV in Fall or Spring when the WPO is positive.
-
1
-
-
I don't know why you're so adamant about this. My point for months has been that the North Pacific would look different than prior years, and the models do show that.
Look at Oct 2021, which +1.7 for the index. https://psl.noaa.gov/data/correlation/wp.data
You're supposed to have low pressure north of high pressure in the NW Pacific for a +WPO.

Now look at the forecast. You have generalized high pressure everywhere. Again, it's 25-40N v. 50-70N. If you smooth out the reds, there isn't much of a difference between the two, which means the index isn't going to be positive. It's nothing like 2021 or 2022 if the forecast is anywhere near right.

-
1
-
-
I don't think the WPO is going to show up positively on the index in October. The type of huge heat we're forecast to see in the West in October is antithetical to +WPO conditions in Fall/Spring.
From what I can see there are also three major problems with 2022-23:
- It rapidly collapsed into an El Nino in Feb-Apr 2023. Not looking likely with this event.
- It was much weaker than the prior two La Ninas. Y/Y warming in Nino 3.4 favors Western cold. There are exceptions after two El Ninos in a row (1959/1978/1988/2016/2020) but it does generally hold up. We have massive y/y cooling.
- MJO/harmonics timing features are off on everything. ITCZ placement, monsoon development, hurricane activity timing - all the stuff triggered by waves from the tropics is off a bit. 2022 was pretty active for Atlantic hurricanes in September, and it had a very strong monsoon in MX and the SW US as a few examples. Getting MJO phase 5 or whatever 30-days off from 2022 would be a different pattern.
In a more mechanical sense the SST profile is much colder in the MJO 4-6 zones, North Atlantic, North Pacific, and tropical Atlantic. On the flip side, the La Nina development is way behind. With the tropical Atlantic and Indonesian waters colder, I'd also imagine the RONI effect is diminished since it is subtracting out global tropical heat content as a global warming signal.

-
4
-
2
-
-
Honestly the WPO definition is 50-70N minus 25-40N for 140E-150W. It doesn't look negative for October but what the CFS shows is neutral. You have a mix of strong heights and neutral heights in the north and then consistently low heights to the south.
I'm still expecting a mixed bag of WPO conditions in the winter. I don't think its very likely we see the Feb/Mar 2023 type of WPO without a transition to an El Nino. So my guess would be +/= WPO early in winter then =/- later on.
-
1
-
-
The low Atlantic ACE thing in a September La Nina (it tends to be around 60) is interesting to look at. I know you all like 2022. But we had major cold waves in the West in November. Don't really expect that this year. But I do see evidence for a lot of cold days again (relatively) for a La Nina locally with ACE remaining low. This is mostly because our dew points have been consistently running much lower than in 2022 so lows should get very cold at times.

If you notice six of the nine the inactive Septembers for Atlantic ACE in La Ninas tend to follow El Ninos (1983, 1970, 1973, 2016 2007, 1954).
You can see that Jan/Feb are the most likely months to see a lot of cold days in a low Sept ACE / 70-130 ACE type hurricane season. September ACE has fairly weak correlations to monthly highs in La Nina here. But it does correlate somewhat strongly with January (r-squared is about 0.3). It's actually been quite a while since we've had a La Nina with an inactive September. In 2022, September was pretty active.
October actually looks pretty different from 2022 anyway. It's going to be pretty warm down here if you buy into the models in October. In 2022 it was warmest in the Northwest not the Southwest. The cool/average spot shown on the CFS is also fairly off from 2022 when it was chilly in the South.
-
2
-
-
Atlantic still has a long way to go to be anywhere near average for ACE. We're running more than 20% below average still and that's after a very fast start. The season after Beryl has been extremely inactive. It's Beryl and then less than 40 ACE otherwise.
Isaac & Joyce will both die Sunday/Monday. Neither is going to add very much ACE in the short term. The formula is sustained winds in knots squared measured every six hours (UTC time) divided by 10,000. You're looking at 3-5 ACE per day for another two days or so from those storms. At that point we're around 80 ACE with 94 as average through 9/30. It doesn't look like there is anything that will be strong enough imminently to bump up ACE quick after Isaac dies. So entering October we probably start to fall behind relative to average again. Early October still sees ACE go up by 1 point or so per day.
October averages 20-25 ACE so even in a bit of a dead season you should see some tropical activity.
My general rule is September + 60 ACE is a pretty safe ceiling. It's very rare to get anywhere near 60 ACE in Oct-Nov. So we're almost certainly looking at 80-140 for the season. Still think we could finish as low as 90 ACE but 100-110 is probably a better bet now. Since 1850 (170+ years) it's like seven hurricane seasons with 60+ ACE for Oct-Nov. Even for the 1991-2020 period which is mostly the warmed up, warm AMO, it's still only 2005, 2016, 2020 (3/30 years) or 10%. The 2016 season had Matthew (cat 5) and Nicole (cat 4) form in late Sept/early Oct and carry on for a while after an inactive start. Matthew was a 4/5 in October for like five days which is nuts. That's probably the best case for those of you who want the hyperactive ACE totals. But I don't expect to see multiple long-duration cat 4+ storms in early October this year.
-
3
-
-
He's just using the SST matching tool from Tropical Tidbits but this is similar overall to my thoughts on the winter. Haven't written my forecast yet though. I do think the Atlantic ridging will setup somewhat west of where he shows it though.
https://www.tropicaltidbits.com/analysis/hsanalog/

I don't like 2017 as an analog - it's the most active September hurricane season since 1850, with low solar and weakly positive PDO conditions. The other years are high solar, and less active hurricane seasons with more -PDO conditions. ACE has to be 50% above normal for the rest of the season to catch up to normal. My rule is ~95%+ of seasons will finish between June-Sept and June-Sept + 60 ACE. To me it's about 50/50 that we'll hit 90 ACE.
-
3
-
-
1 hour ago, donsutherland1 said:
The NOAA has an interactive map where one can look up sea rise scenarios up to the year 2100.
One can look up local scenarios based on 2017 and 2022 projections. Afterward, one can also look up the degree of flooding at various locations based on the extent of sea level increase. Neither Miami nor New York City is projected to be underwater anytime soon. Even by 2100, at the high projection, much of NYC is not flooded. No serious climate scientist is calling for either city to be flooded in the near-term (next few decades). The incidence of flood events (sunny day and during storms is expected to increase).
Must be a wonderful life you have, with all of your time on the internet spent telling people they are wrong. After all, everyone loves being told they are wrong and stupid all the time.
-
 3
3
-
2
-
1
-
-
The seasonal models are dumpster fires for winter forecasts at this range. I haven't even really tested the 2013-14, 2021-22 blend yet. It just looks like the SST pattern and seems to have some matching tendencies to recent US conditions. But I haven't subjected the various blends I'm looking at to rigorous testing yet.
-
2
-
1
-
-
It's always amusing how no matter what I say on here the most extreme warm/cold case is what people latch onto. When I talk about 2013-14, it's only as a blend with 2021-22 that I'm interested in it. I don't expect the winter to be very much like 2013-14 by itself. The bulge in warmth isn't quite south of Alaska, it's to the West by the dateline which probably favors more cold Plains than Midwest.
Look at the blend.


That's fairly close to what I expect at 500 mb, although I reserve the right to change my mind by the time I put out my forecast.

-
3
-
-
Least active September hurricane seasons are an interesting group if we hold on. Especially in direct opposition to years like 2017 which saw extraordinary activity in September.
Arizona should see quite a bit of rain with Ilena once it dies. Don't think we'll get much at all here.
-
I don't like 2007-08 much as an analog but this is what snow looks like.


-
2
-
2025-2026 ENSO
in Weather Forecasting and Discussion
Posted
MJO looks like it is 1/2 to 2/3 magnitude of this time of year in 2022, and off by about 8-12 days for timing. So it's not perfect. It's not like the years have been super different and just snapped into place. Jan 2022 and Jan 2025 both finished super cold, even though the cold entered the US from slightly different origins, and again the timing is off.