
Blizzard92
-
Posts
533 -
Joined
-
Last visited
Content Type
Profiles
Blogs
Forums
American Weather
Media Demo
Store
Gallery
Posts posted by Blizzard92
-
-
3 minutes ago, RU848789 said:
I'm assuming that's subsidence - we're stuck in it too
Yep, same here, just light snow in Plainsboro, NJ for the last hour or so.
-
 1
1
-
-
2.0 inches in Plainsboro, NJ... was hoping for a bit more, but can't complain I guess!

-
On 9/20/2023 at 3:29 PM, bluewave said:
Thank you very much for posting that great information. I updated the title of this thread to incorporate this new and important study. If there is any way for you to post the full paper beyond the abstract I would really appreciate it. The beauty of science is that our understanding of things can grow based on new research.
A cooling trend in summer (May-August) daytime temperatures since the mid-20th Century over the central United States contrasts with strong warming of the western and eastern U.S. Prior studies based on data through 1999 suggested this so-called warming hole arose mainly from internal climate variability, and thus would likely disappear. Yet it has prevailed for two more decades, despite accelerating global warming, compelling reexamination of causes that in addition to natural variability could include anthropogenic aerosol-induced cooling, hydrologic cycle intensification by greenhouse gas increases, and land use change impacts. Here we present evidence for the critical importance of hydrologic cycle change resulting from ocean-atmosphere drivers. Observational analysis reveals the warming hole’s persistence is consistent with unusually high summertime rainfall over the region during the first decades of the 21st Century. Comparative analysis of large ensembles from four different climate models demonstrates that rainfall trends since the mid-20th Century as large as observed can arise (though with low probability) via internal atmospheric variability alone, which induce warming hole-like patterns over the central U.S. Additionally, atmosphere-only model experiments reveal that observed sea surface temperature changes since the mid-20th Century have also favored central U.S cool/wet conditions during the early 21st Century. We argue that this latter effect is symptomatic of external radiative forcing influences, which via constraints on ocean warming patterns has likewise contributed to persistence of the U.S. warming hole in roughly equal proportion to contributions by internal variability. These results have important ramifications for attribution of extreme events and predicting risks of record-breaking heat waves in the region.
I believe the paper should now be open access - sorry for the issues! https://journals.ametsoc.org/view/journals/clim/36/20/JCLI-D-22-0716.1.xml
-
2
-
 1
1
-
-
-
While land surface feedbacks are certainly playing a role, we recently reinvestigated this issue and found that ocean-atmosphere interactions can also force this area of cooling:
Eischeid, J.K., M.P. Hoerling, X.-W. Quan, A. Kumar, J. Barsugli, Z.M. Labe, K.E. Kunkel, C.J. Schreck III, D.R. Easterling, T. Zhang, J. Uehling, and X. Zhang (2023). Why has the summertime central U.S. warming hole not disappeared? Journal of Climate, DOI:10.1175/JCLI-D-22-0716.1 https://journals.ametsoc.org/view/journals/clim/aop/JCLI-D-22-0716.1/JCLI-D-22-0716.1.xml
-
14 hours ago, so_whats_happening said:
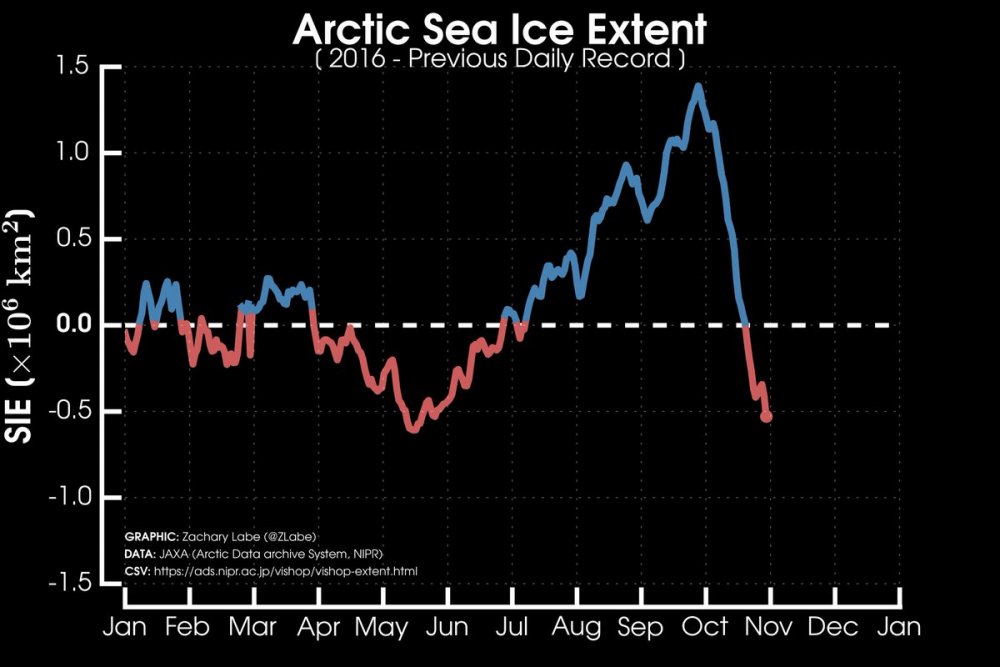
The Arctic seems off 2012 was the min so it should show the most anomalous not 2020. The bolded is very interesting had not thought of it in that manner and major fluctuations make sense in it being signs of a tipping point. It would be something if the Antarctic over the next 10-20 years sees similar degradation to what the Arctic had and the Arctic just does a slight recovery, not in the sense it goes back to 1970s and 80s levels, just a more inline with the levels of what could be allowed in a positive year with as much warming that has occurred (hope this makes sense). I would think maybe something like 2000s average may be the upper echelon (maybe 90s levels if we get lucky but dont think it is possible with how much warmer oceans are) before another potential tipping point is reached type of deal.
Hi! The graphs are mine - the data is not off, and the x-axis is the same for both graphs. Note that this is showing the daily sea ice anomalies (which set a new record in 2020 in terms of the absolute magnitude compared to the 1981-2010 average). This is demonstrated more clearly here. This is not showing the actual extent, which did of course reach a minimum in 2012.
-
My family just 2 miles west of Linglestown is reporting hail larger the golf balls.
-
My family in Linglestown received 2.90" of rain last night from those thunderstorms.
-
There are numerous studies (older and more recent) that detail the Arctic warming in the early 20th century:
i.e., Delworth and Knutson, [2000], Bengtsson et al. [2004], Serreze and Francis, [2006]
There is also a fairly nice and concise overview from Skeptical Science.
Changes in sea ice are driven by far more than surface temperature. For example, a significant portion of 2016's melt season was forced by bottom melt and increased SST/oceanic heat.
-
2 hours ago, blizzard1024 said:
The AMO has been in the warm phase since the late 1990s so little by little sea ice coverage shrinks. Then this year we had a strong El Nino and hence a low sea ice year. We only have about 40 years worth of reliable sea ice coverage data and the satellite monitoring began during a known cool period in the 20th century when sea ice likely was at a maximum in coverage. So we are seeing the downward trend of a cyclical process. And the Vize, Russia observation is just weather, not climate. There has been tremendous cold in Asia this fall. The average global temperature from the satellites is around +.4C which is not that big of a deal and we are in a cooling trend as the effects of the strong El Nino fade. There is nothing unusual about our current climate. CO2 may be leadling to some of the observed warming but climate scientists, in my opinion, underestimate the natural variability of our climate system.
This is just not true. Most of us studying sea ice - atmospheric interactions spend the majority of our time trying to understand and quantify natural climate variability in the context of a long-term record. There is a plethora of peer-reviewed work to showcase the current/recent sea ice anomalies are particularly unusual.
-
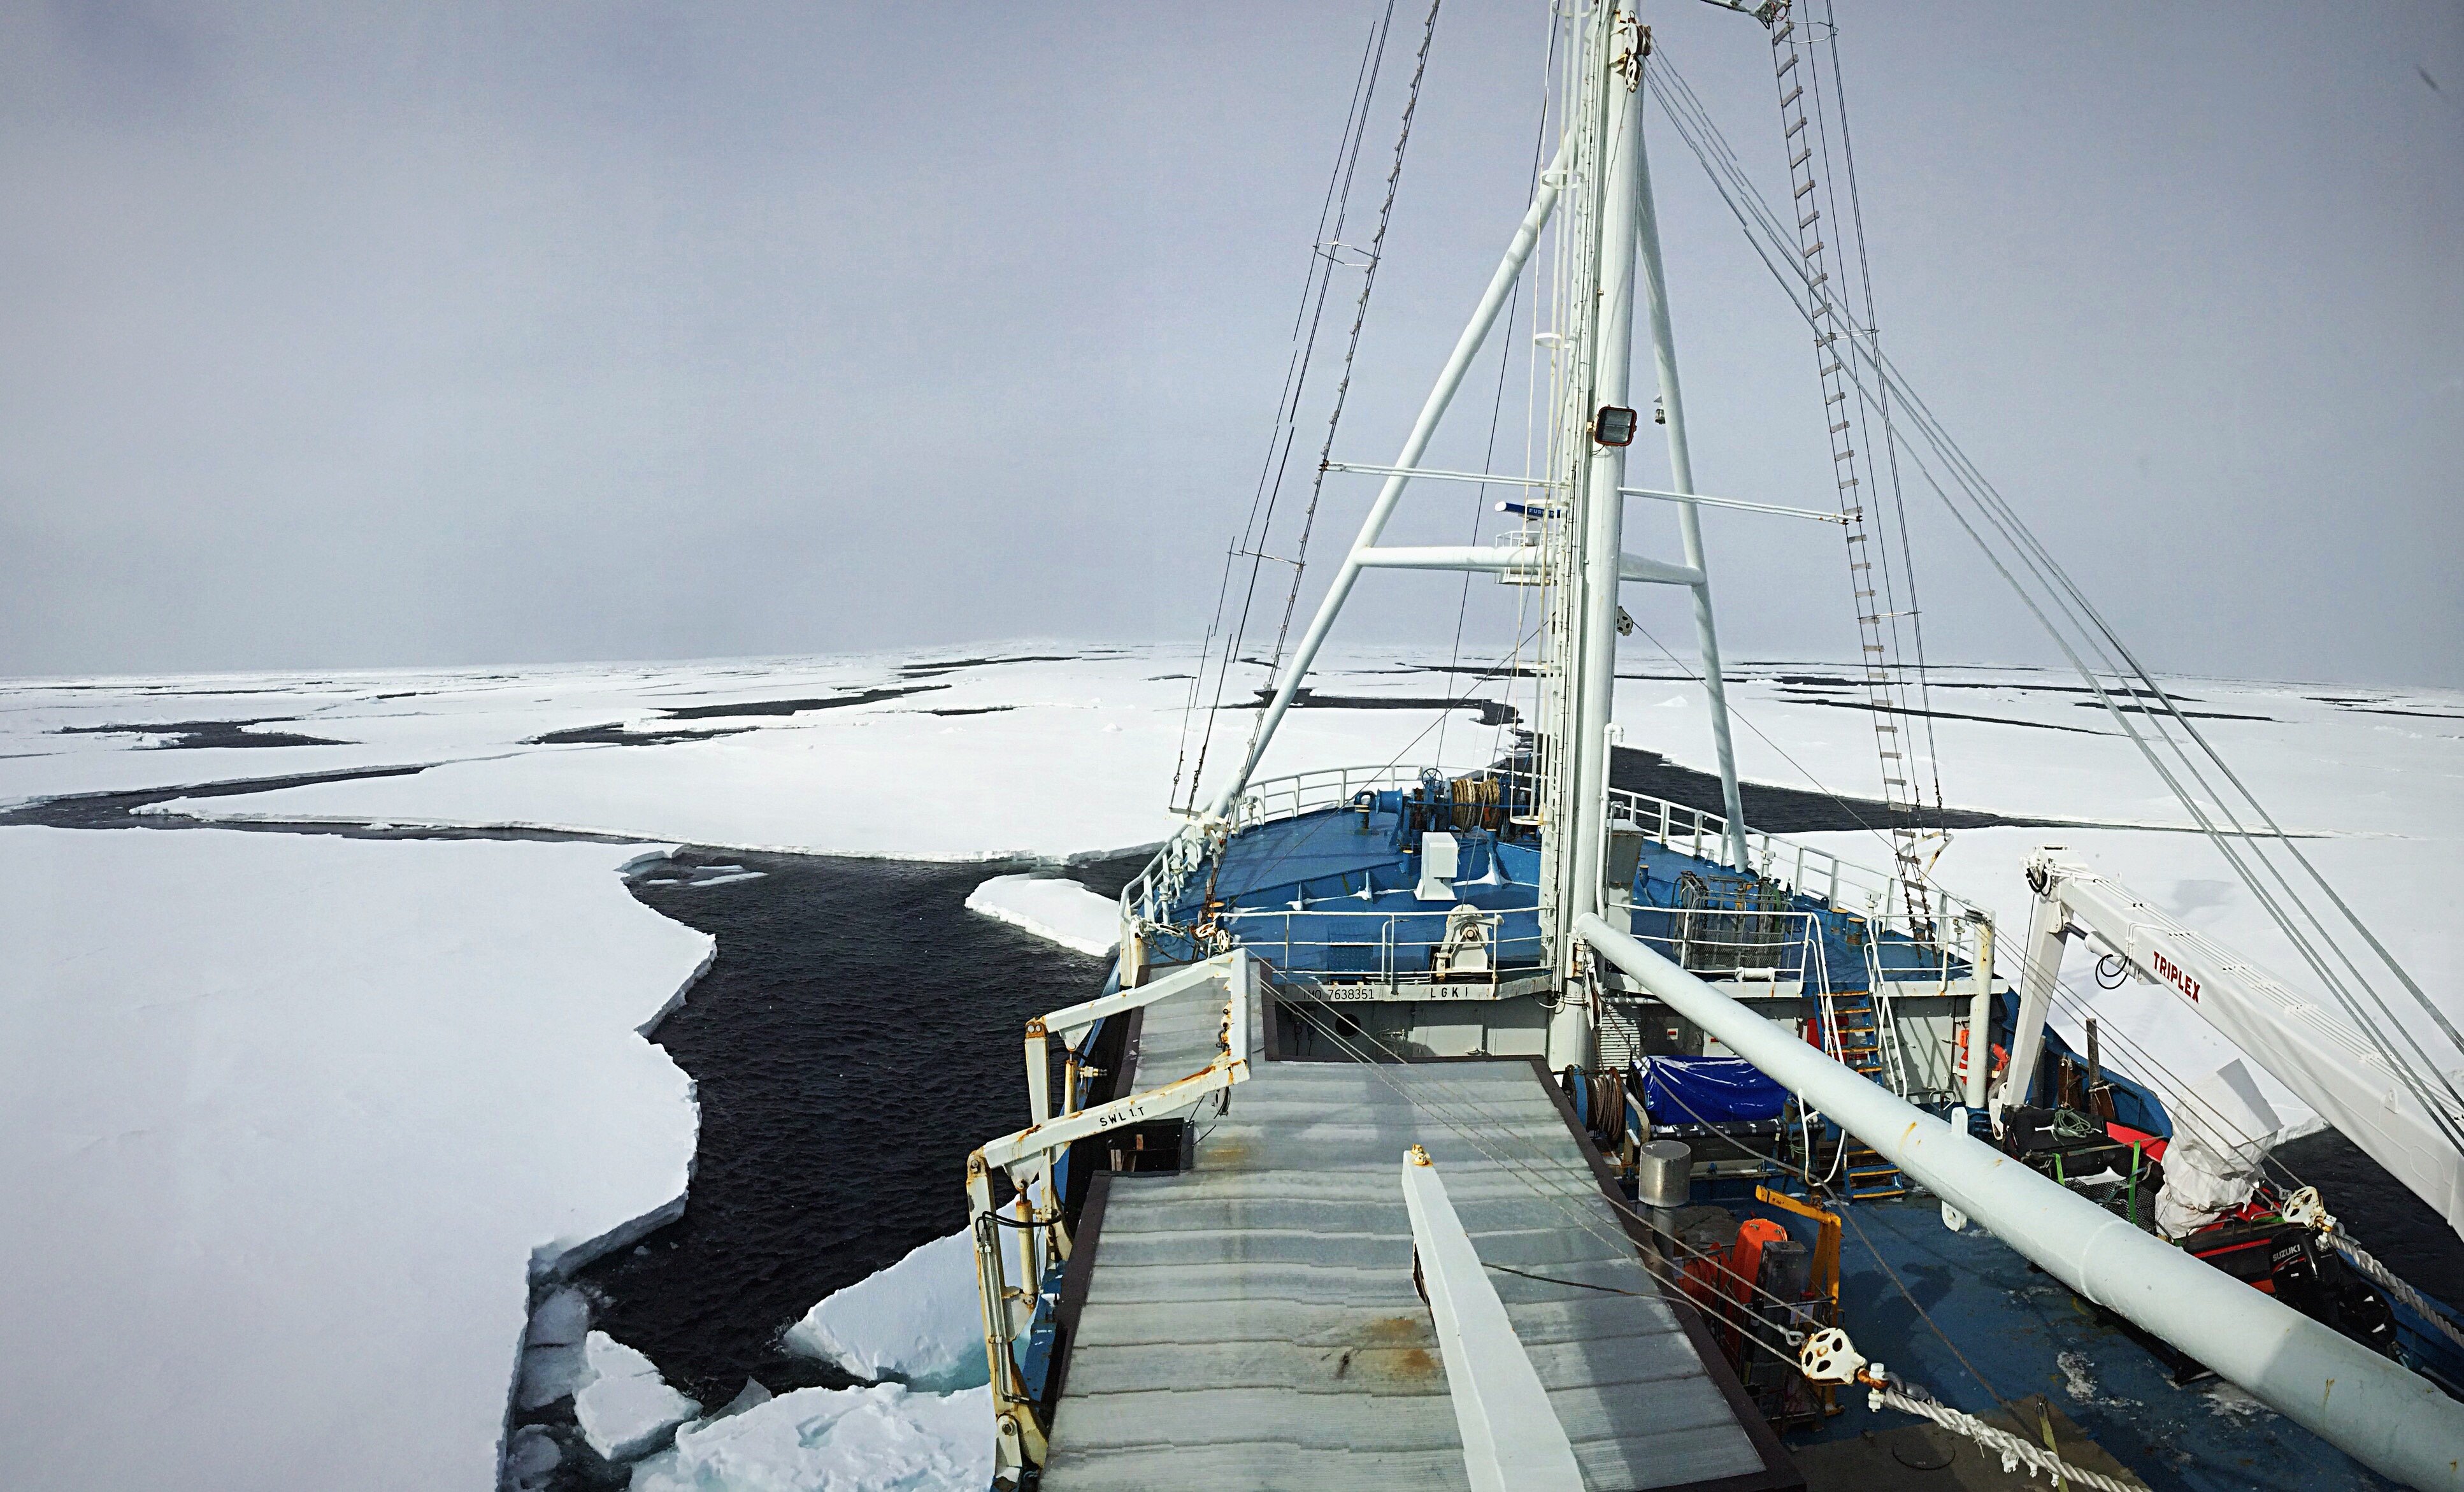
I think this speaks for itself... (from Twitter)
-
30 minutes ago, forkyfork said:
IMO what's happening right now is just as wild as the 2012 min
Definitely agree. I think it will be particularly interesting to see the PIOMAS volume/thickness numbers for October. Although now we can get a glimpse at the CryoSat-2 season: http://www.cpom.ucl.ac.uk/csopr/seaice.html
-
Does the university of your undergraduate degree assist in any advantage in job prospects?

Central PA Winter 23/24
in Upstate New York/Pennsylvania
Posted
My family is reporting about 6 inches near Linglestown from last night.