

PhillipS
-
Posts
1,210 -
Joined
-
Last visited
Content Type
Profiles
Blogs
Forums
American Weather
Media Demo
Store
Gallery
Posts posted by PhillipS
-
-
It's easy to just focus on the recent melt seasons but I got a jolt when I looked at the PIOMAS sea ice volume plot. The SIV is currently around 6.75K km3, just behind 2012 as ORH reported above, but the 1979-2001 average for this time of years is almost 17,000 km3, more 10,000 km3 greater than today - a loss I find sobering.

-
10 hours ago, Jack Frost said:
I agree generally with your post.
Please engage with Dr. Berry.
Dr Barry is welcome to come here to engage.
-
29 minutes ago, Newman said:
Could Someone explain why Greenland ice is at a record level with regards to surface mass balance? If there is any sign for this to decrease and get back to normal levels, what is it?
More open Arctic ocean -> increased evaporation -> increased water vapor -> increased precipitation.
But GIS Surface Mass Balance is only half of the situation. It does not include dynamic GIS processes such as glacial calving, basal melting, or meltwater runoff. Look at the Total Mass Change data for the complete situation.
 As you can see, the GIS has lost around 3,600 km3 (3,600 Gtons) of ice since 2003.
-
Here is the CH4 in-situ hourly average data at the Barrow AK observatory. There does appear to be a plume of CH4 in recent months.

Looking at just the 2014 to present data makes it clearer.

It looks like a series of CH4 events starting last Fall.
-
I think most readers on this forum have read the recent reports of large craters being found in Siberia, and the discussion of their origin. There was a post on the IFLScience website [link] that may be of interest. Here is an excerpt:
An expedition from the Scientific Center of Arctic Studies found methane concentrations of 9.6% at the bottom of the crater – 50,000 times the atmospheric average. The possibility that methane released by melting permafrost produced the crater had been a favored hypothesis from its discovery in mid-July. Nevertheless, plenty of other theories were circulating, and scientists urged caution before leaping to conclusions.
The extraordinary concentration of methane, on the other hand, seems unlikely to be a coincidence, particularly since methane is slightly lighter than air. The 2012 and 2013 summers on the Yamal peninsular, where the crater is, were around 5°C warmer than normal.
Expedition leader Andrei Plekhanov told Nature that the high temperatures probably thawed the permafrost to the point where it collapsed, releasing the trapped methane.
If my math is correct, 9.6% is 96,000 ppm, or 96,000,000 ppb (which is how atmospheric CH4 is usually measured). Current CH4 readings at Barrow are around 1880 ppb so the crater levels are alarmingly high. And given that CH4 is lighter than air, those levels aren't the result of CH4 pooling in the deep craters.
I think that it would be interesting to monitor the levels on a periodic, say, weekly, basis to learn if the concentration is rising, falling , or stable.
-
There is a good column on the Shakova paper and global methane trends at RealClimate. The take-away, in my opinion, is that global methane concentrations aren't rising fast enough to be alarming at this time. The rate of methane increase is at least an order of magnitude smaller than what would be needed to significantly affect climate. Here is the conclusion from the column:
Shakhova et al (2013) did not find or claim to have found a 50 Gt C reservoir of methane ready to erupt in a few years. That claim, which is the basis of the Whiteman et al (2013) $60 trillion Arctic methane bomb paper, remains as unsubstantiated as ever. The Siberian Arctic, and the Americans, each emit a few percent of global emissions. Significant, but not bombs, more like large firecrackers.
So it appears that methane, including arctic methane, is something that we should be concerned about enough to study closely, but it is not alarming as several other AGW effects such as droughts, extreme weather, rising sea levels and ocean acidification.
-
There is a new report from Dr Shakova about increased arctic methane releases - that the rate of methane release from subsea permafrost has accelerated to 17 teragrams (17 megatons) per year. [Discovery article]. I'll try to track a link to the paper itself.

Methane gas bubbles rising through Arctic Ocean water, seen by a remotely operated vehicle.
-
6-8k years ago the oceans were still rising, and had been for 5k years(at a much faster rate). This gives little time for shallow hydrate formation, and the rising ocean stabilizes the deeper hydrates.
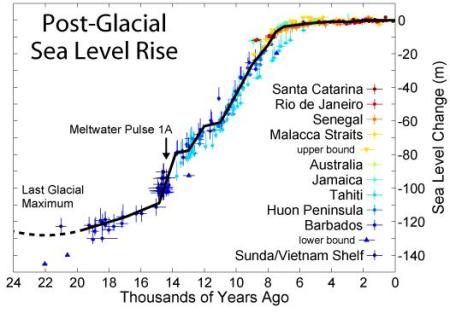
edit: That is to say the top of the hydrate stability zone(where it is relatively easy to destabilize), would have hardly any hydrates to destabilize.
Blizzard should keep in mind, too that CO2 levels during the HTM never rose above about 280 ppm. As we approach 400 ppm (on our way to 500 ppm or greater) we are pushing the climate into conditions not seen for millions of years.

[source]
If one understands the GHE and the properties of CO2 and other GHGs it is hard to hope that some unknown 'braking effect' will appear and save us from the consequences of BAU.
-
6-8k years ago the oceans were still rising, and had been for 5k years(at a much faster rate). This gives little time for shallow hydrate formation, and the rising ocean stabilizes the deeper hydrates.
edit: That is to say the top of the hydrate stability zone(where it is relatively easy to destabilize), would have hardly any hydrates to destabilize.
Blizzard should keep in mind, too that CO2 levels during the HTM never rose above about 280 ppm. As we approach 400 ppm (on our way to 500 ppm or greater) we are pushing the climate into conditions not seen for millions of years.
[source]
If one understands the GHE and the properties of CO2 and other GHGs it is hard to hope that some unknown 'braking effect' will appear and save us from the consequences of BAU.
-
These articles really do damage to the chicken or the egg co2 arguement in past warming from ice cores.
Did co2 cause the warming or did warming cause the co2.
Dispute my hypothesis.
Your hypothesis is the logical fallacy known as a "False Dichotomy" - asserting that something must be either A or B when the real world is more complex.
CO2 is a GHG whose warming effect (the magnitude of its radiative forcing) on the Earth is dependent on its concentration in the atmosphere. The more CO2 in the atmosphere, the warmer the globe. Any argument?
But CO2 is not the only phenomenon that can warm, or cool the Earth. Any argument?
Cold seawater can hold more dissolved CO2 than warm sea water - warming cold seawater can result in the release of CO2. So the ocean can be either a source or a sink for CO2 - depending on conditions. Any argument?
The ocean is not the only source for CO2. Volcanism, fires, anthropogenic burning of fossil fuels, thawing of permafrost and other processes all effect the carbon cycle. Any argument?
So there are multiple factors, including CO2, that affect the Earth's energy balance. And there are multiple sources of atmospheric CO2, including the oceans under some conditions.
So where is the chicken and egg paradox?
-
Bumped for some truly crummy news:
http://www.bbc.co.uk...onment-19410444
I sure hope this paper (the Nature paper that is the source of the article) turns out to be another case of Nature's famous "molecular memory" paper, where some people diluted a solution to nullity and claimed that the solvent "remembered" the solute.....................
Interesting article. After reading it I did a quick google scholar search of the authors of the Nature paper and found several related papers by Dr Wadham - so she has been researching this topic for a while.
What I am skeptical of is the huge reservoir of organic carbon they claim underlies the Antarctic ise sheet. The reason I"m leery is that glaciers, and ice flows within ice sheets, are very good at bulldozing underlying strata down to bedrock. So most of whatever organic material was present in the distant past was over time scraped into the ocean surrounding Antarctica.
But I may be completely wrong and their study will be corroborated by additional research.
-
Doesn't methane break down in 10yrs in the atmosphere?
A fast google search got the values of 10 - 12 years residency for methane.
-
Maybe I'll get some insight on this at some point. Off hand I'd suggest that before going too far with the conspiracy theories there have been lots of issues with budget cuts in our lab. It would be interesting though to find out the rationale for the details of these cuts. Additional email inquiries might be useful potentially as well.
If you think emails to NOAA and our senators and congressmen might help, well, that's easy to do. Sadly, the Texas Senators are in the pocket of the fossil fuel contingent, but my congressman has a good track record with environmental issues.
-
This was during the annual GMD conference held in the building where I work. I think this desire for more obs has been expressed a number of times over the years. Curiously I didn't much see much reference to the Arctic Ocean and ESAS methane in this conference program.
DO you have any insight into why the in-situ CH4 program was shut down at Barrow yet is still on-going at Mauna Loa? I would think Mauna Loa would be an ideal site for flask sampling - it is thousands of miles from the major sources of release so the GHGs are well mixed by the time they reach the observatory. There is a very good match between the flask data and the in-situ data which to me indicates that the two programs are somewhat redundant.
By comparison, Barrow is ideal for in-situ sampling because it is very close to areas of concern such as the Alaskan permafrost, the Siberian permafrost, and the ESAS. That's what we should be monitoring in near real-time. We know from the data record that the in-situ monitoring picks up event very quickly. If a large release takes place I don't think it's helpful to wait several weeks to find out about it after the lab analyses the flask samples. The NOAA decision is like being concerned about a rumbling volcano but putting the sensors thousands of miles away and getting results by snailmail. WTF are they thinking?!
-
These folks, also from ESRL/GMD are mentioning the value of in-situ measurements...
Interesting timing since that was distributed just two weeks before they pulled the plug on in-situ monitoring of CH4 at Barrow.
-
There is a recent development in NOAA's monitoring of CH4 levels in the arctic - a development which took place without any notice that I am aware of. I believe most of the readers here are familiar with NOAA's ESRLand with the CH4 monitoring program they have had for years at observatories around the globe. Barrow Observatory is one of two in the arctic region and is the closest to the ESAS area where potential CH4 releases are predicted. Any plumes of CH4 released from the ESAS are likely to be detectable at Barrow soon after they occur.
Here is the full plot of the hourly CH4 data from Barrow:
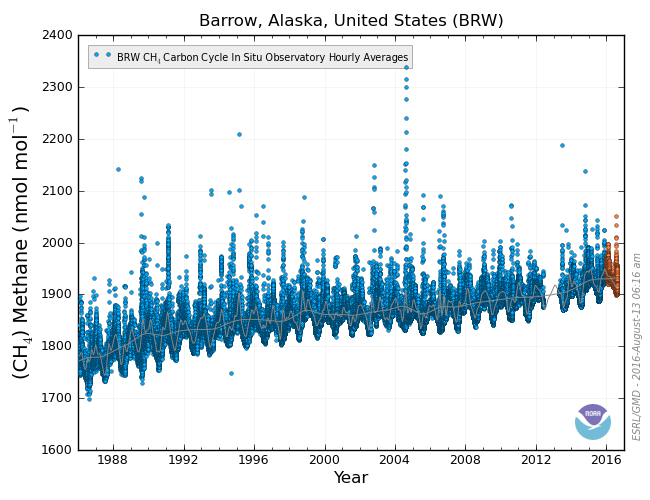
About 26 years of data that shows the slowly rising average CH4 levels as well as the transient spikes of much higher concentrations. When I looked at the 2012 plot I noticed something odd:

Do you see it, too? I don't mean the dropping concentration, that's just the annual cycle in which CH4 levels drop in the spring before rising again in the summer and fall. And I don't mean the spike to about 2500 ppb in the spring (though that is pretty alarming). The oddity is the record halting in June. I emailed the NOAA POC, Kirk Thoning, to ask for info to understand why the data wasn't being displayed and got this reply:
Due to budget constraints, the in-situ methane measurement system at Barrow was shut down on June 1.A program that's been in place for a quarter of a century shut down just as its data is sorely needed. Curses! But the CH4 flask sampling program is still active. Trouble is, flask sampling lacks the temporal resolution of in-situ sampling making it less likely to detect transient phenomena and there is a lag of several weeks in seeing the data because the flasks have to be shipped to labs for analysis. Here is the 2012 flask record for CH4:

The flask sampling program is much like a rear-view mirror - it shows you where you've been, not where you are. But I suppose it is better than no data at all. And the in-situ CH4 sampling program is still active at Mauna Loa so we should be able to observe any CH4 released from melting of the Hawaiian permafrost.
-
I'd like to know how the Greenland Ice cap farts - at least the southern part. Isn't it too soon to see any kind of melt there? Or is it now supporting CH4-producing bacteria that can be metabolically active below freezing and beneath this last winter's snowpack.
Inquiring minds, you know......
Also, those images would impress me more if they extended the scale beyond 1870ppm
I agree that the scale needs extending, particularly since the typical arctic CH4 readings are currently around 1900 ppm, and transient readings have gone as high as 2500 ppm this year. Here is the Barrow Obervatory in-situ hourly averagereadings for 2012:
It will be interesting to see if the summer melt season brings more evidence of undersea CH4 releases.
-
Here are links to two research papers I came across in learning more about the physical processes involved with undersea methane release. The first is an older article: Giant sea-bed pockmarks: evidence of gas escape from Belfast Bay, Maine - Kelley et al 1994 link Here is the abstract from that paper:
Circular depressions, or pockmarks, cover the sea floor in many estuarine regions of the western Gulf of Maine. In Belfast Bay, Maine, they are found in densities up to 16/km2, are up to 350 m in diameter and 35 m in relief, and are among the largest and deepest known. The pockmarks appear to form from the escape of biogenic natural gas and pore water and are far larger than features associated with thermogenic gas elsewhere. These pockmarks are thought to have formed (1) catastrophically during earthquake, tsunami, or storm, or (2) slowly over thousands of years. Recent observations of bubble releases suggest continuing activity and potential geologic hazard. The pockmarks involve a poorly documented coastal process of sediment redistribution and methane release, largely unrecognized an the rock record but widespread in middle- to high-latitude embayments.The paper is an easy read and has some great sonar images of these gas escape features.
The second paper is paywalled, so only the abstract is available for all, but it more directly deals with methane release and climate change.
Atmospheric methane from organic carbon mobilization in sedimentary basins — The sleeping giant? Kroeger et al 2011 link And its abstract:
The mass of organic carbon in sedimentary basins amounts to a staggering 1016t, dwarfing the mass contained in coal, oil, gas and all living systems by ten thousand-fold. The evolution of this giant mass during subsidence and uplift, via chemical, physical and biological processes, not only controls fossil energy resource occurrence worldwide, but also has the capacity for driving global climate: only a tiny change in the degree of leakage, particularly if focused through the hydrate cycle, can result in globally significant greenhouse gas emissions.To date, neither climate models nor atmospheric CO2budget estimates have quantitatively included methane from thermal or microbial cracking of sedimentary organic matter deep in sedimentary basins. Recent estimates of average low latitude Eocene surface temperatures beyond 30 °C require extreme levels of atmospheric CO2. Methane degassing from sedimentary basins may be a mechanism to explain increases of atmospheric CO2to values as much as 20 times higher than pre-industrial values. Increased natural gas emission could have been set in motion either by global tectonic processes such as pulses of activity in the global alpine fold belt, leading to increased basin subsidence and maturation rates in the prolific Jurassic and Cretaceous organic-rich sediments, or by increased magmatic activity such as observed in the northern Atlantic around the Paleocene–Eocene boundary. Increased natural gas emission would have led to global warming that was accentuated by long lasting positive feedback effects through temperature transfer from the surface into sedimentary basins. Massive gas hydrate dissociation may have been an additional positive feedback factor during hyperthermals superimposed on long term warming, such as the Paleocene–Eocene Thermal Maximum (PETM). As geologic sources may have contributed over one third of global atmospheric methane in pre-industrial time, variability in methane flux from sedimentary basins may have driven global climate not only at time scales of millions of years, but also over geologically short periods of time. Earth system models linking atmospheric, ocean and earth surface processes at different timescales with the sedimentary organic carbon cycle are the tools that need to be developed in order to investigate the role of methane from sedimentary basins in earth's climate.I'm too cheap to pay for the article but if anybody has it I'd love to read the whole thing.
-
I understand. You moved the goalposts when you realized how ridiculous the statement was.
I've only used the term in one context so no goalposts were moved - you are the one has been playing semantic games trying to move the goalposts. Instead, why don't you spend your time and energy providing links to research to back up your claims - or at least read some of the papers and come back better informed.
-
I see so now a small percentage equals "a large portion"
In the context of methane release - yes. Why is that so difficult for you to understand?
-
"Large Portion" isn't any different.... You were the first to use the verbiage.
again, nothing suggests that a "large portion" (did I get it right this time?) is in danger of being released in the next 100 years. You shouldn't have suggested such a thing if you weren't willing to take the heat for such a ridiculous statement. Why would you talk about a "large portion" being released in the next 100 years if it's accepted that it won't happen?
Is English not your native language? I don't see any other way you can so wildly misconstrue the term "large portion" - it is a relative quantity, not an absolute quantity. For example, if I eat a half pound of BBQ brisket, I've eaten a large portion even though the cow it came from weighed about half a ton. Similarly, if I eat an entire Snickers bar I have eaten a large portion of chocolate. The meaning of the term has to be taken from the context it is used in.
As I explained in my earlier post, I meant 'large portion' as being enough CH4 to have serious climate effects.. What that amount would be depends on a number or factors, including rate of release, but all research I've seen indicates that the release of even a small percentage of the vast reservoir of CH4 locked up in permafrost and methane hydrates would be very serious. There have been ample links to peer-reviewed research supporting that concern.
So keep on playing your semantic games - it is clear to anyone who speaks English that you're just being foolish.
-
You haven't showed me what I asked for. You don't read very well. I'll ask again.
You are the only person on this thread, or any other thread, who has used the terms "most" or "majority" in reference to the emission of arctic methane. If you had actually read any of the papers that have been referenced you could have learned that release of even a small percentage (much less than half) of the methane reservoir will have serious climate impact.
By continuing your rant you are making yourself look silly and are trashing what little credibility you have.
-
I wasn't talking about a minority amount and neither was the guy's post I was originally responding to. So the answer appears to be there is not peer reviewed papers that suggest a majority of the methane in the ESAS is in danger of being released in the next 100 years.
As the poster you responded to - I can safely say that a 'large portion' does not have to mean 'most', it simply means enough to be problematic. I'll grant that I should have been more exact. But as others have pointed out, the peer-reviewed research says that release of even a small percentage (are you happier with that term?) of the CH4 reservoir will have severe climate impacts.
If you, and other pseudo-skeptics, were the only ones affected by the risks and consequences of BAU (much like smokers or motorcyclists who ride without helmets) I'd say "your risk, your choice.". But our atmosphere and our climate are the common property (though perhaps legacy would be a better term) of everyone. The actions of anyone inevitably impact others. It sounds like you're claiming the right to pollute to your heart's content and the rest of the world be damned. But mindreading isn't a skill I'm good at (just ask my ex-wife) so I'll ask in all seriousness - do you feel an individual or group or nation has innate or imposed limits on what they can do?
-
I missed the part that suggests a large portion of the methane trapped in the ESAS will be released in the next century.
Nobody is saying the dangerous amounts of CH4 will, for certain, be released - what I, and others, have said is that dangerous amounts may be released, and that BAU with its inevitable warming increases the likelihood of that happening.
Here's another peer-reviewed paper on the topic - Gas Hydrates: past and future Geohazard? Here's the paper's abstract:
Gas hydrates are ice-like deposits containing a mixture of water and gas; the most common gas is methane. Gas hydrates are stable under high pressures and relatively low temperatures and are found underneath the oceans and in permafrost regions. Estimates range from 500 to 10 000 giga tonnes of carbon (best current estimate 1600–2000 GtC) stored in ocean sediments and 400 GtC in Arctic permafrost. Gas hydrates may pose a serious geohazard in the near future owing to the adverse effects of global warming on the stability of gas hydrate deposits both in ocean sediments and in permafrost. It is still unknown whether future ocean warming could lead to significant methane release, as thermal penetration of marine sediments to the clathrate–gas interface could be slow enough to allow a new equilibrium to occur without any gas escaping. Even if methane gas does escape, it is still unclear how much of this could be oxidized in the overlying ocean. Models of the global inventory of hydrates and trapped methane bubbles suggest that a global 3°C warming could release between 35 and 940 GtC, which could add up to an additional 0.5°C to global warming. The destabilization of gas hydrate reserves in permafrost areas is more certain as climate models predict that high-latitude regions will be disproportionately affected by global warming with temperature increases of over 12°C predicted for much of North America and Northern Asia. Our current estimates of gas hydrate storage in the Arctic region are, however, extremely poor and non-existent for Antarctica. The shrinking of both the Greenland and Antarctic ice sheets in response to regional warming may also lead to destabilization of gas hydrates. As ice sheets shrink, the weight removed allows the coastal region and adjacent continental slope to rise through isostacy. This removal of hydrostatic pressure could destabilize gas hydrates, leading to massive slope failure, and may increase the risk of tsunamis.Speaking only for myself, I find that alarming. Of course, the only way to be totally certain about the risk is to pull that trigger and see if the gun is loaded. That's the approach to risk that many renowned Darwin Award winners have followed.
Arctic Sea Ice Extent, Area, and Volume
in Climate Change
Posted
Apologies if I'm splitting hairs, Bluewave, but August didn't see an increase in Arctic SIV, it saw a decrease in the anomaly. Arctic SIV continued to drop, albeit at a slower rate.