

FreeRain
-
Posts
545 -
Joined
-
Last visited
Content Type
Profiles
Blogs
Forums
American Weather
Media Demo
Store
Gallery
Posts posted by FreeRain
-
-
About 7.5" in N. Syosset.
-
48 minutes ago, mikem81 said:
really very little sleet here in Western Nassau. Smaller flakes with little sleet since the mega bands pushed north and west. Radar trying to redevelop some bands to the SE from coastal...
Had no sleet here in N. Syosset. About 13.5 inches so far. Visibility is about 2 to perhaps 3 blocks tops.
-
 1
1
-
-
Measurements between 5.7 and 6.0 inches.
-
1
-
-
In which way? Please elaborate on your above statement.
There has been questions raised in recent years about the Hockey Stick Graph. Some have called it inaccurate.
-
Mann was among the team of scientists who established the well-known "hockey stick graph," which reconstructed 1,000 years of global temperature trends and illustrated rapid warming since the industrial age.
http://www.latimes.com/science/sciencenow/la-sci-sn-global-warming-hiatus-20150226-story.html
Claiming to be the author of the "hockey stick graph" is not a good thing or at least it raises a reasonable doubt.
-
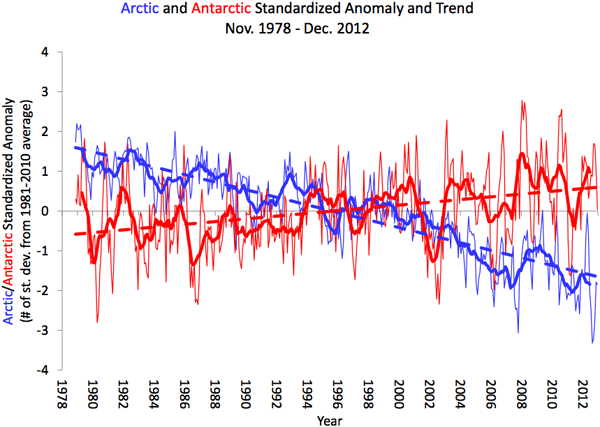
Why are you cherry-picking data? November has the highest trend in antarctic sea ice growth. Averaged throughout the year, antarctic sea ice extent is changing not nearly as fast as Arctic sea ice and has not increased significantly in the last decade.
Don't know what you mean by your reference to "November" and "cherry picking data". The graph that I posted is for a 12 month running mean.
And speaking of things that haven't "increased significantly in the last decade", that would be the earth's temperature as seen with real RSS data.
-
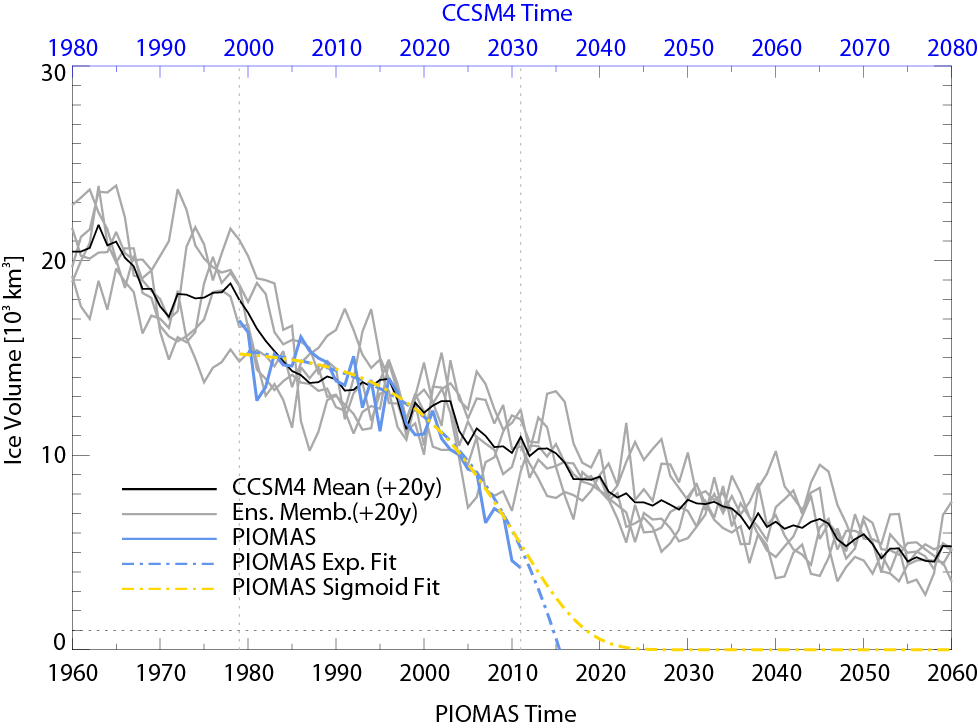
I do not know, i'm not a mind-reader. He's probably just extrapolating from recent research and theories that have not yet been fully reflected in the IPCC report. Case in point, the ice-free state in September was not expected until the 2080's in the 2007 IPCC report.
Right now there is data to back up Obama's claims but you will not find it in UN IPCC. The most recent iteration IPCC 2013 does little to address key issues and non-linear responses.
Sorry, but "probably" doesn't mean definitely, and one shouldn't have to be a"mind reader" to find out the supposed "source" of a president's data...especially on such an important subject...and especially since this president already has a credibility problem.
Your graph seems to be dated(2010) and it only covers one pole and it of course only covers a limited amount of time during several active solar cycles.
Here are two poles.
-
Politicians are not scientists and generally have a poor understanding of the processes that warm the planet. Using the IPCC as a reference is kind of a strawman because they are generally unrealistically conservative but more-so in the short-term and do not factor in non-linear climate effects.
I have a hard time seeing how the Earth warms more than 5c in 100 years (some have proposed up to 26c runaway venus conditions), however if things are already bad at 0.8c then that gives you an idea of what we are facing.
What reference is Obama using?
-
Senator Inhofe says Obama ‘just made up’ claim that ‘the climate is warming faster than anybody anticipated five or ten years ago’
OBS and nowcast Thursday morning 2/18 - 11PM Friday 2/19/21
in New York City Metro
Posted
At the end of that loop you can see the trail of moisture extending all the way from Lake Huron, to Lake Ontario and then across the Sound.
A couple of snow flurries just just passed through here in N. Syosset. No accumulation that I can see.