

Heat_Is_On
-
Posts
4 -
Joined
-
Last visited
Content Type
Profiles
Blogs
Forums
American Weather
Media Demo
Store
Gallery
Posts posted by Heat_Is_On
-
-
18 hours ago, blizzard1024 said:
It's not CO2 entirely.CO2 always lags T in ice cores. It never drove the climate in the last 2.6 million years with the present ocean currents and geography. Why would it all of the sudden change? That's not physics. There is more to the climate system and we just don't understand enough about natural processes. But we shouldn't be polluting our atmosphere, so in the long run we need to go to renewables and cleaner energy sources. CO2 is a weak GHG. That is basic physics. The feedbacks can't be significantly positive or our climate would have gone off the rails a long time ago and it simply didn't. You need major positive feedbacks and high climate sensitivity. The observations are not showing this. If you pick warm biased data sources you get 2C per century or so. UAH is 1.4C per century. So split the difference... 1.5C to 2.0C increase over 1880 leads to another .5C to 1C for a doubling CO2 assuming the climate was in stasis in the 1800s. This is a BAD assumption since we were coming out of a global LIA. It is very possible that much of the 20th century warming is natural with some smaller CO2 component. Climate models are tuned to be sensitive to CO2 and have positive feedbacks which in nature likely doesn't exist. See Spencer's work on ERBE satellite data. Anyway, I am done. I don't buy your CAGW. It is hype. I see modest warming. I am finished here. You got your wish. No dissenters, no debate. No learning. Have a nice life.
Well I think Blizzard is done here. I had popcorn and was enjoying the back and forth especially between him/her and skierinvermont. Will one or both of these users be banned? should they? or is this discourse allowed. It was entertaining.... anyway.
Is this stuff quoted true? First is CO2 really a weak greenhouse gas? Isn't it the dominate GHG? Also being from a physics background, does CO2 really lag T in ice cores. I find it hard to believe that such data up to 400 thousand years ago could be resolved to such a degree. If CO2 rises and falls lag temperature changes, a layperson in climate science like myself could be confused and think it is not important. Also if CO2 is a weak greenhouse gas again one can see why there is confusion with people. Also was there a little ice age and medieval warm period? I always thought there was and if so, one can see that natural effects can be also at work. Again this can confuse a non climate scientist.
So is this blizzard just outright lying? please advise. I really though they figured all this stuff out and we are warming tremendously. I have heard that even our day to day weather especially storms are supercharged by CO2. Of course I take what the media says with a grain of salt since they often overdo stuff. thanks all.
-
 1
1
-
-
On 11/28/2019 at 7:31 AM, bluewave said:
https://www.nature.com/articles/s41586-019-1764-4- Article
- Published: 27 November 2019
Twofold expansion of the Indo-Pacific warm pool warps the MJO life cycle
Nature volume 575, pages647–651(2019)Cite this article
Article metrics
-
23 Altmetric
Abstract
The Madden–Julian Oscillation (MJO) is the most dominant mode of subseasonal variability in the tropics, characterized by an eastward-moving band of rain clouds. The MJO modulates the El Niño Southern Oscillation1, tropical cyclones2,3 and the monsoons4,5,6,7,8,9,10, and contributes to severe weather events over Asia, Australia, Africa, Europe and the Americas. MJO events travel a distance of 12,000–20,000 km across the tropical oceans, covering a region that has been warming during the twentieth and early twenty-first centuries in response to increased anthropogenic emissions of greenhouse gases11, and is projected to warm further. However, the impact of this warming on the MJO life cycle is largely unknown. Here we show that rapid warming over the tropical oceans during 1981–2018 has warped the MJO life cycle, with its residence time decreasing over the Indian Ocean by 3–4 days, and increasing over the Indo-Pacific Maritime Continent by 5–6 days. We find that these changes in the MJO life cycle are associated with a twofold expansion of the Indo-Pacific warm pool, the largest expanse of the warmest ocean temperatures on Earth. The warm pool has been expanding on average by 2.3 × 10⁵ km2 (the size of Washington State) per year during 1900–2018 and at an accelerated average rate of 4 × 10⁵ km2(the size of California) per year during 1981–2018. The changes in the Indo-Pacific warm pool and the MJO are related to increased rainfall over southeast Asia, northern Australia, Southwest Africa and the Amazon, and drying over the west coast of the United States and Ecuador.
-
Fig. 1: A twofold expansion of the warm pool.

-
Fig. 2: Changes in the MJO life cycle.

-
Fig. 3: Correlation between MJO phase duration and ocean–atmosphere conditions.

-
Fig. 4: Changes in global rainfall in response to the changes in MJO phase duration.

-
Extended Data Fig. 1 Typical life cycle of the MJO.

-
Extended Data Fig. 2 Annual average period of MJO events.

-
Extended Data Fig. 3 Warm pool area in multiple datasets and breakpoint analysis.

-
Extended Data Fig. 4 Correlation between MJO phase duration and ocean–atmosphere conditions, without removing the trends.

-
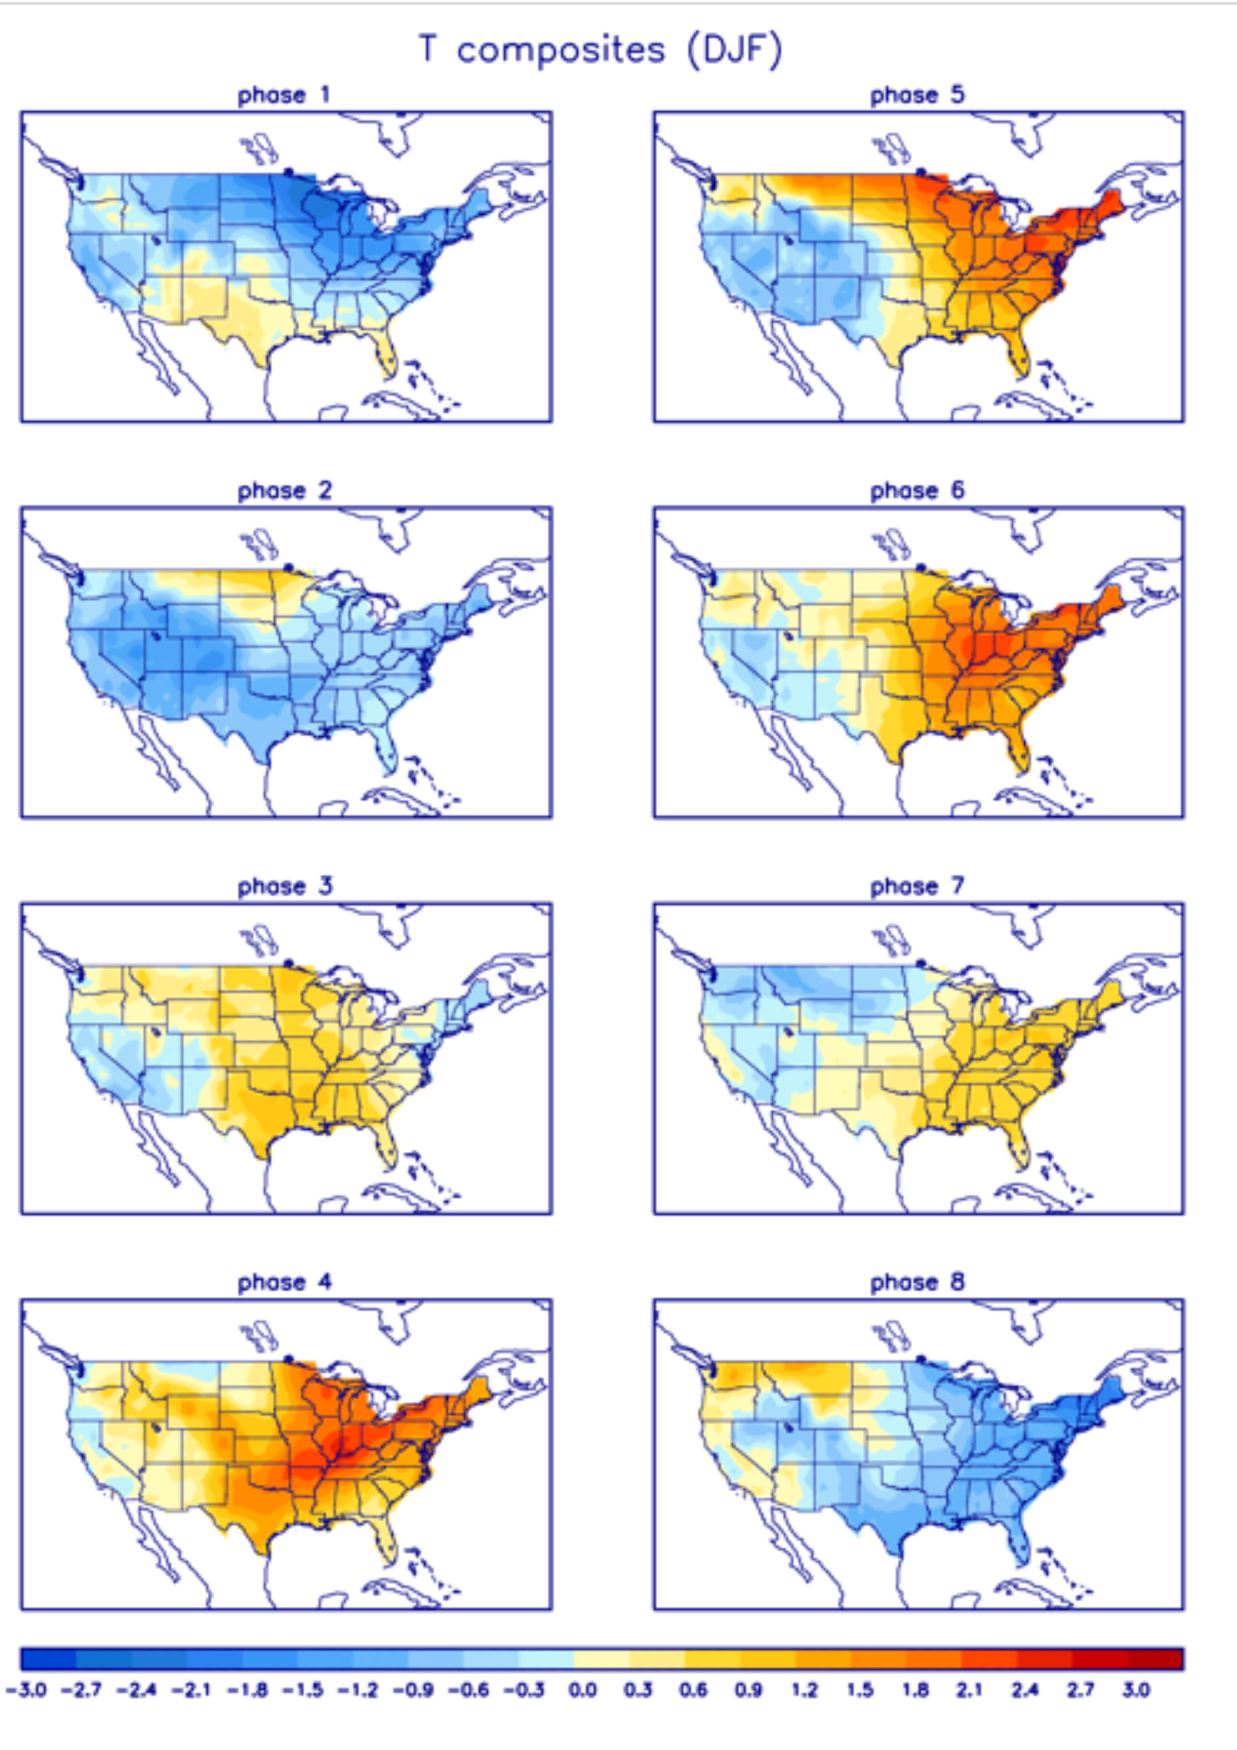
This is bad news for eastern winters. These are warm phase for the eastern U.S winters. Shucks. It seems that we get cold at times but then blowtorch out of late. shucks. see below.

-
This study suggests the feedbacks are at least double (roughly) and more likely triple from doubling CO2. Doesn't the CMIP6 have a even higher range of temperature change for doubling of CO2 than CMIP5? Why does the IPCC still hold on to the 1.5C to 4.5C range it has had for decades? This is a big range. You would think they could have narrowed it down by now.
Increase In MJO Maritime Continent Phases With Climate Change
in Climate Change
Posted
Oh boy. I LOVE winter and snow. This is NOT good....