

forecasterjack
-
Posts
108 -
Joined
-
Last visited
Content Type
Profiles
Blogs
Forums
American Weather
Media Demo
Store
Gallery
Posts posted by forecasterjack
-
-
Just now, Ginx snewx said:
Pivotal is high resolution now, weather .us is too
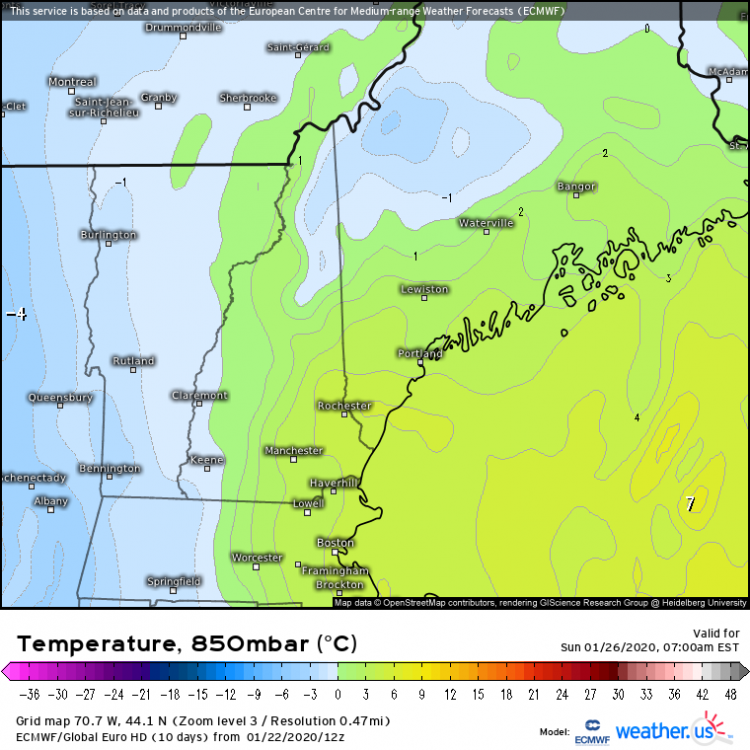
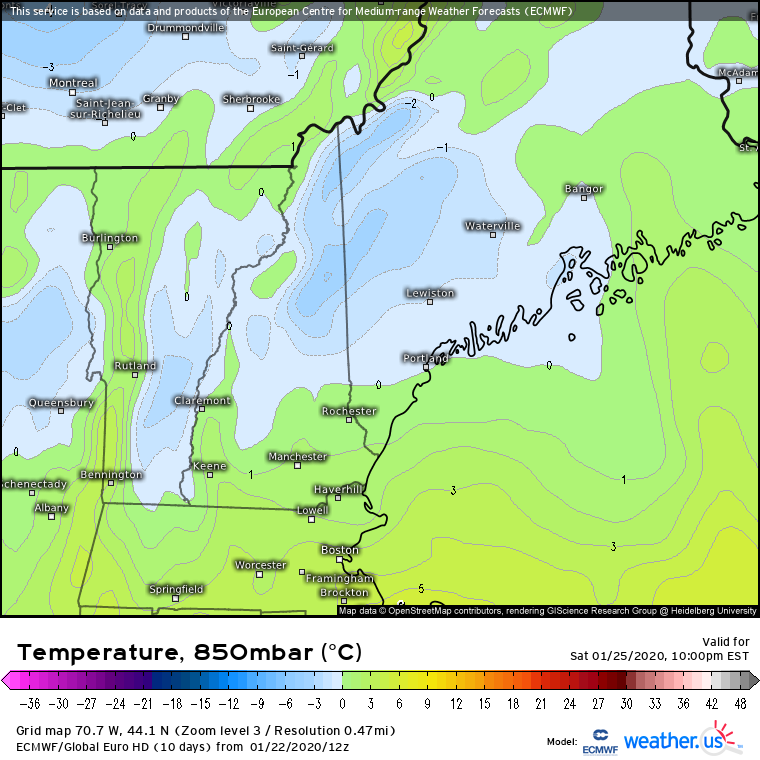
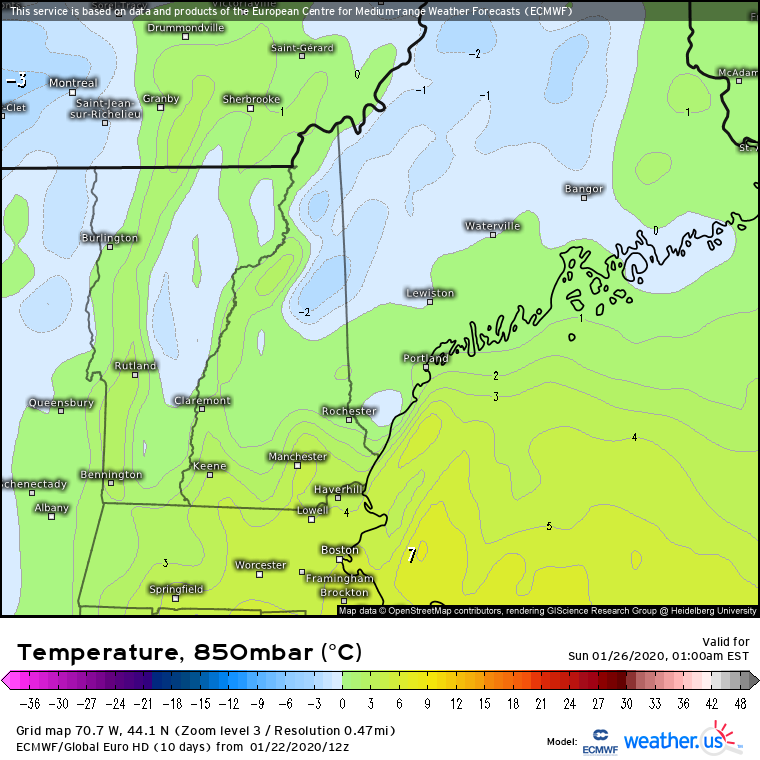
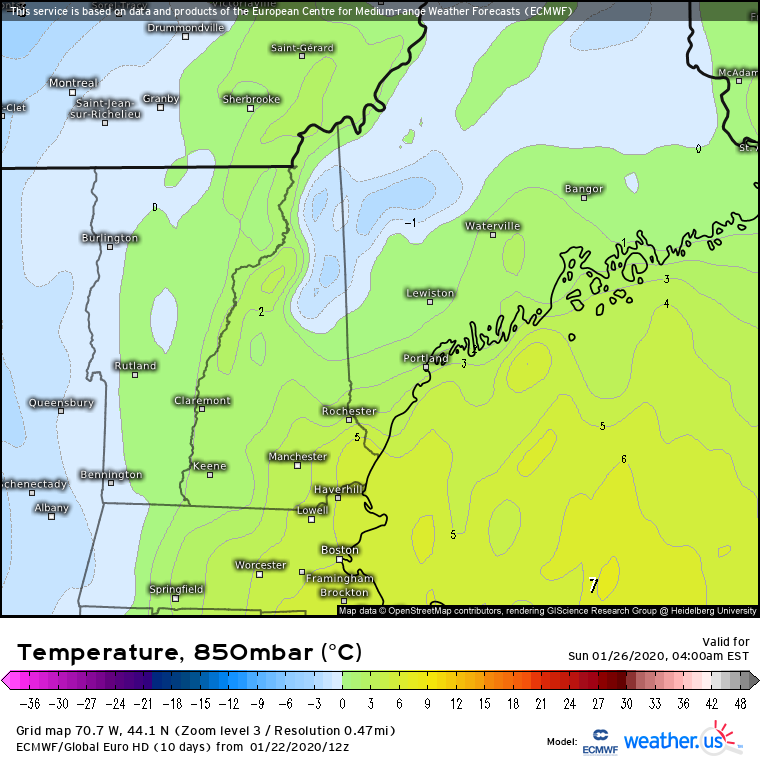
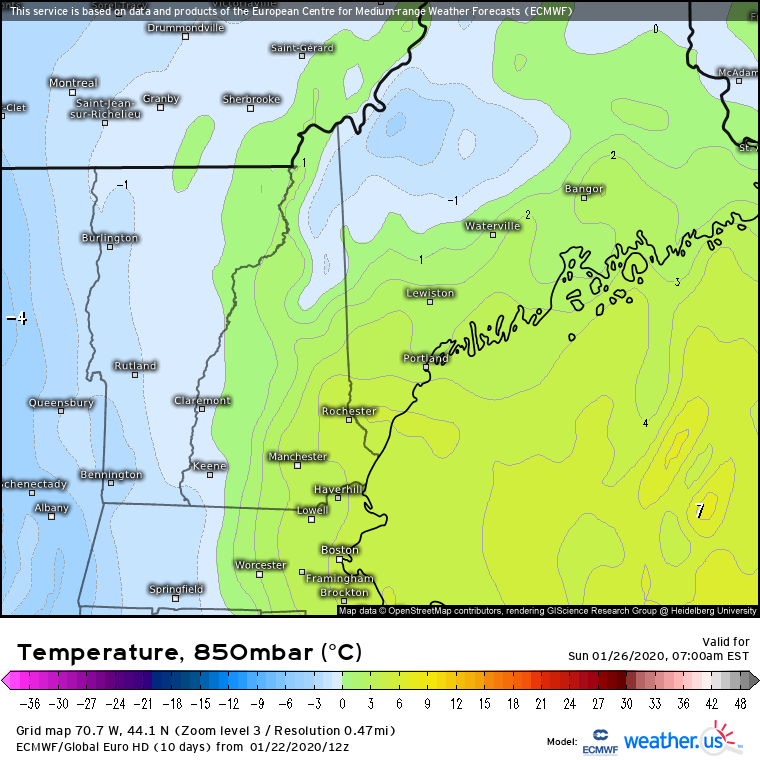
yep the high res makes a big difference, as does being able to zoom in. ME/NH stay <0C at 850mb for the duration of the event https://weather.us/model-charts/euro/707-w-441-n/temperature-850hpa/20200126-0300z.html


-
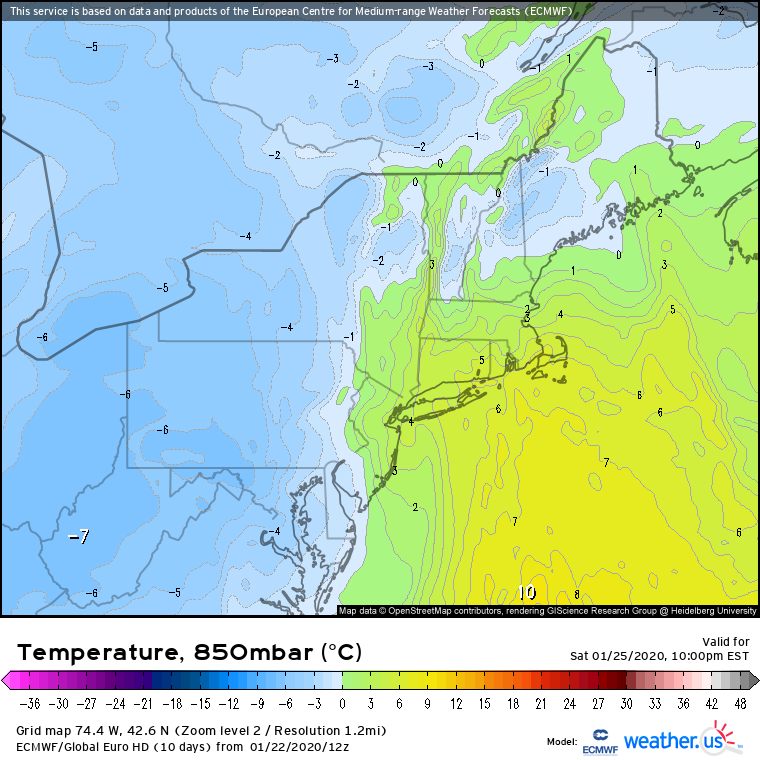
FWIW, here's the ECMWF's forecast for the snow line on Saturday night. It reads out the topography where snow is falling, which is why the whites/greens/dacks show up even though it's cold enough for snow there.
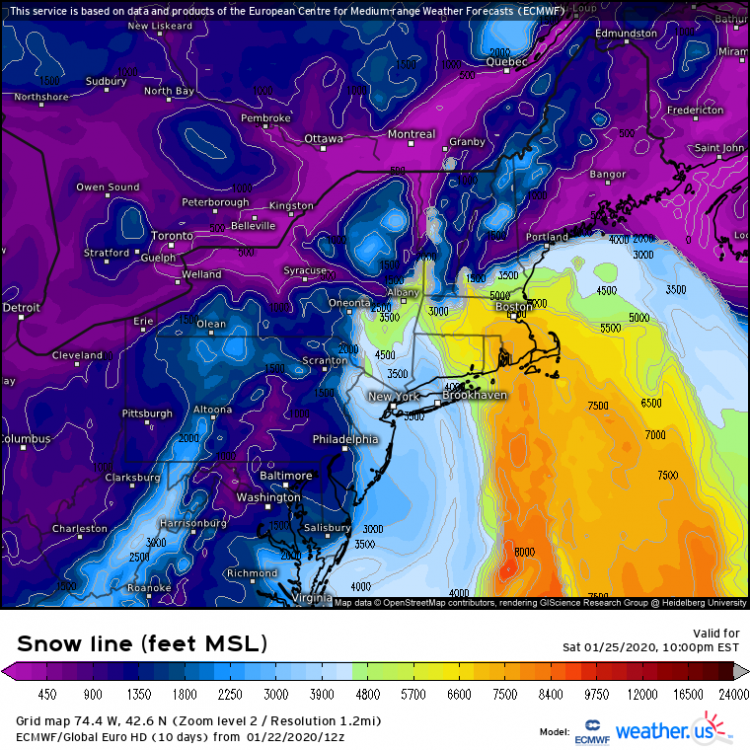
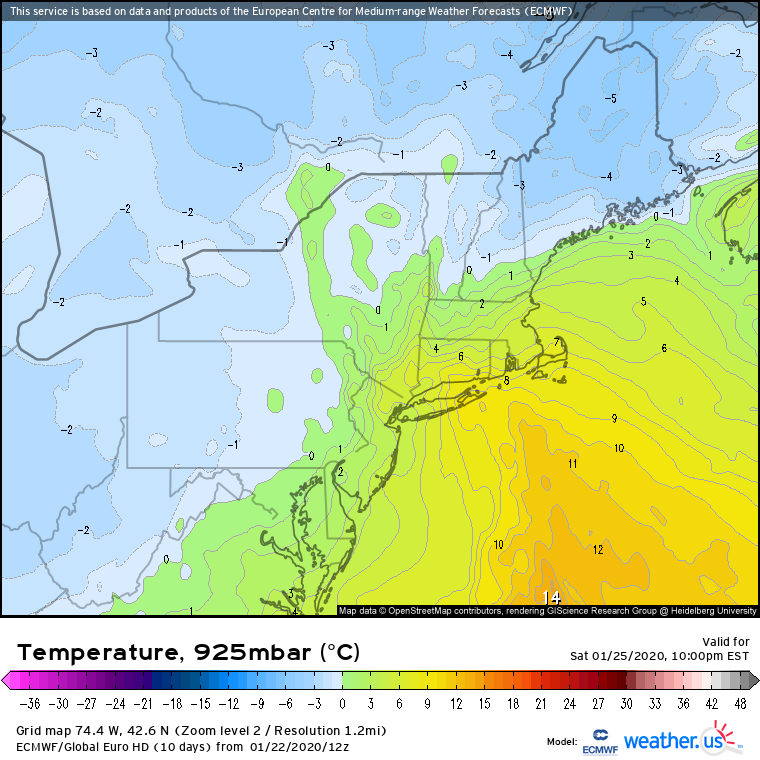
The bottom of the warm layer is still pretty darn high (3000-7000ft) over SNE. Even over the Catskills, it's >4000ft (higher than the terrain there).
Checking lower level temps (sfc-850mb), we see that the warm layer is pretty warm and pretty deep until you hit NH/VT/ME or the NY Thruway


Gonna be hard to punch through that, even if you get intense lifting.
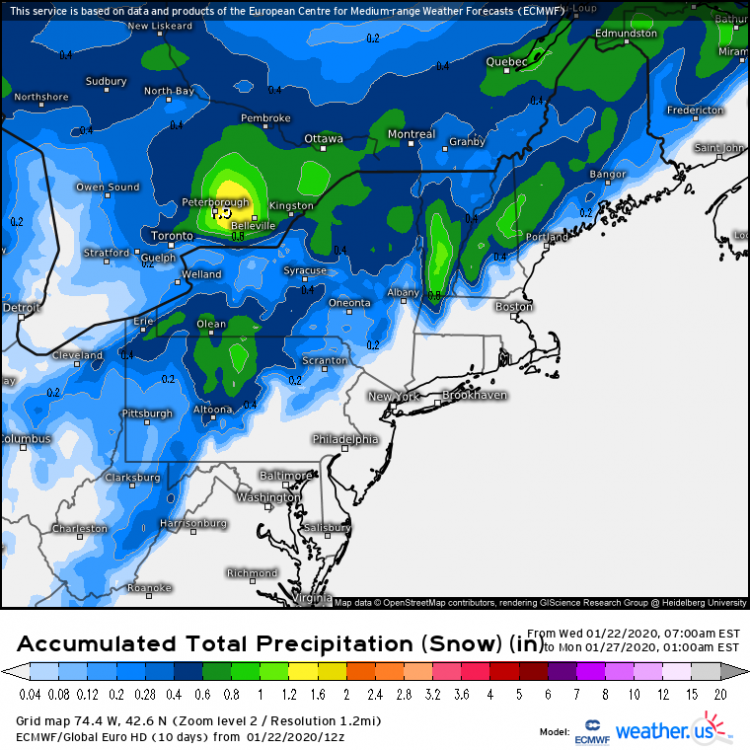
The ECMWF's QPF-falling-as-snow forecast I think does a pretty good job with the spatial extent of who is snow and who is rain. Multiply by a ratio of your choice at your own risk haha, even in the Greens/Whites, warm temps into the 700mb layer should do a number on our ability to grow dendrites efficiently
-
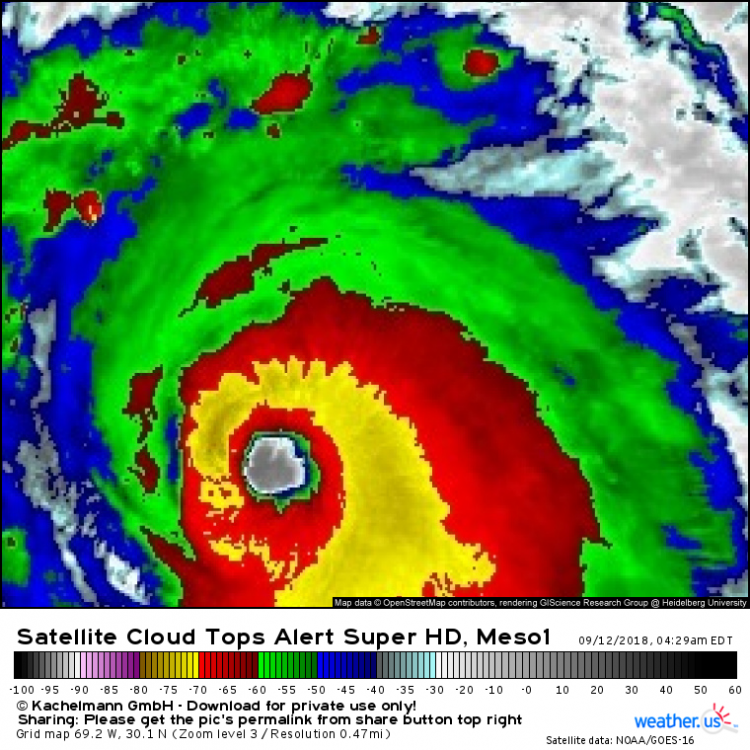
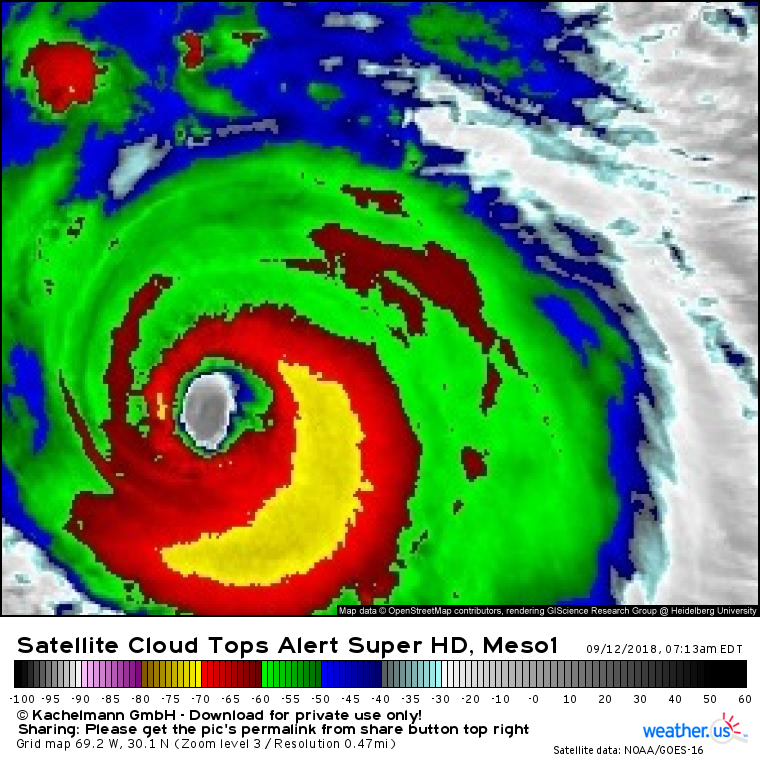
Had a few minutes there where the convective appearance seemed for the first time so far to be A+. But thankfully, we're back down to a degraded and lopsided storm. -70C tops are to the SE, with the -60 ring barely hanging on in the NW quad. Perhaps an artifact of Florence moving too fast, a la Gordon in the GOM? Watching closely (1min GOES-16 link in case you don't already have one or are looking for a new one: https://weather.us/satellite/692-w-301-n/top-alert-superhd-1min.html#play2)

-
If we can get this ring of -70C cloud tops to close off and maintain itself around the eye, and if we can eliminate that dry air on the western side, whoever finds the core is gonna have some big time troubles down the line. Right on the cusp of taking it to the 'next level' IMO, we'll see if it actually happens. Link to where I got this image from: https://weather.us/satellite/692-w-301-n/top-alert-superhd-1min.html#play2
-
 1
1
-
-
Some pretty wacky solutions mixed in here. Stall/loop or retrograde SW/onshore is the basic idea. But that could take a lot of different forms http://wx.graphics/models/eps_florence.png
.thumb.png.86ded6e83c5c83fd7a563d9850dd3f86.png)
-
Latest EPS (http://wx.graphics/models/eps_florence.png) lot of members doing the stall. One lone recurve
.thumb.png.769ea9eba4cd654abcbbfe2c0fddcf47.png)
-
6 minutes ago, seether said:
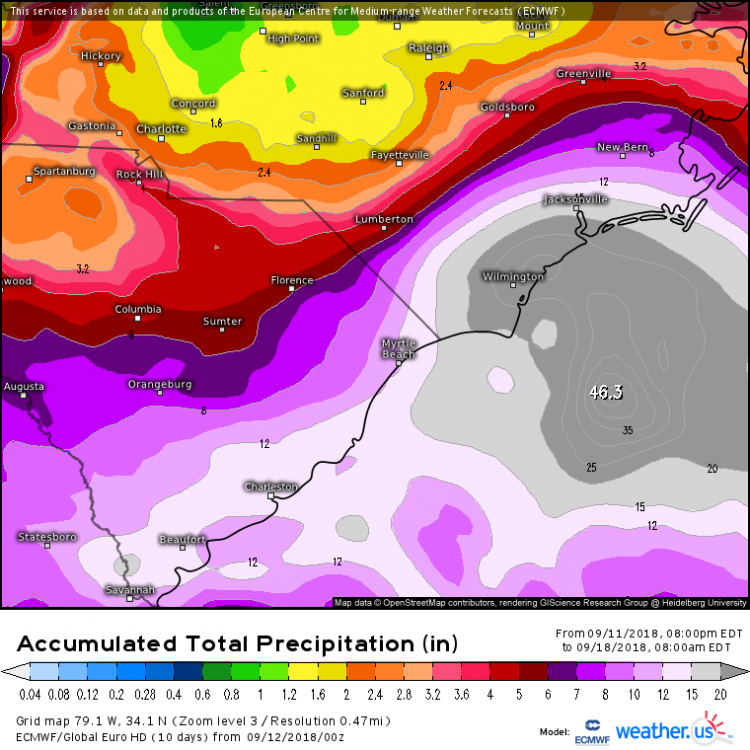
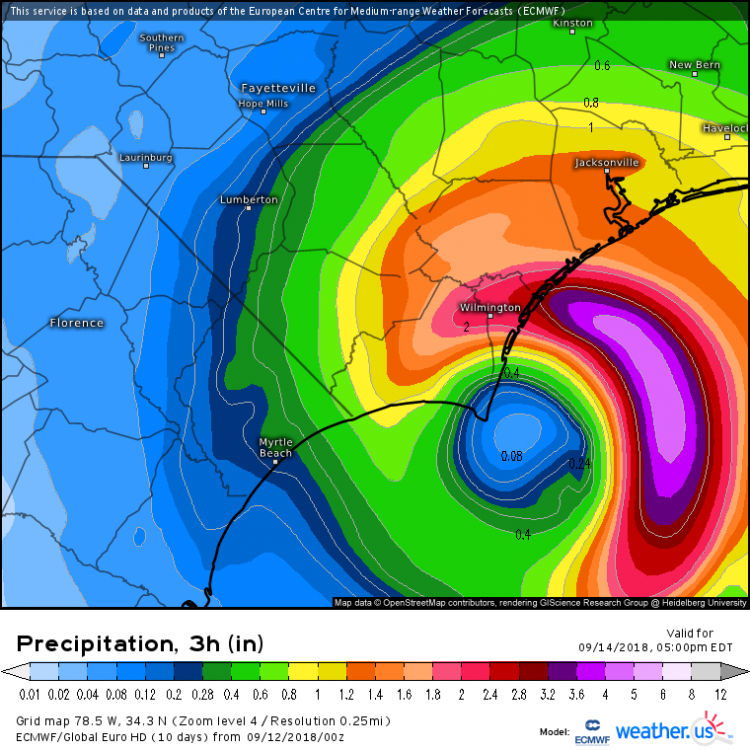
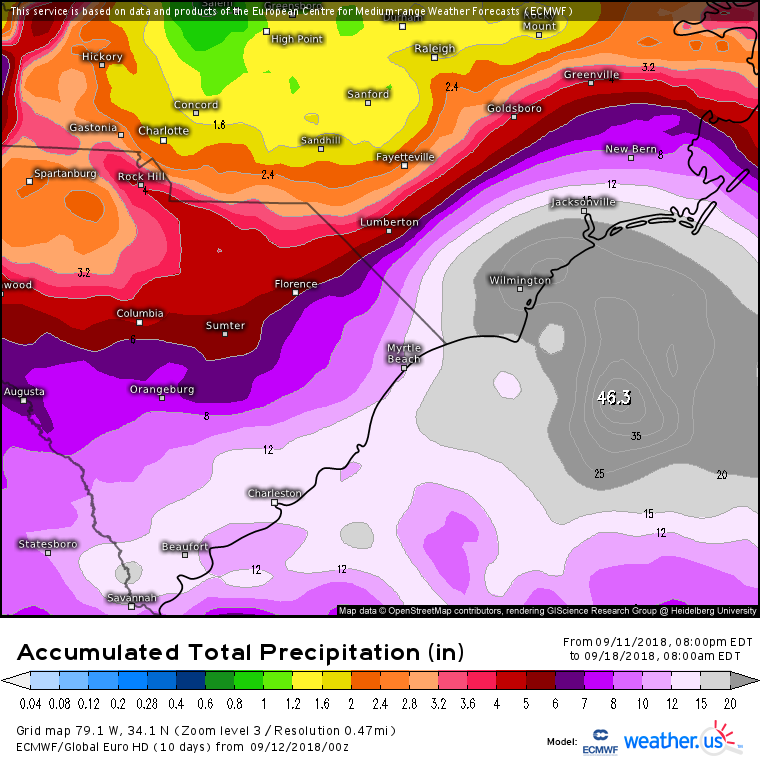
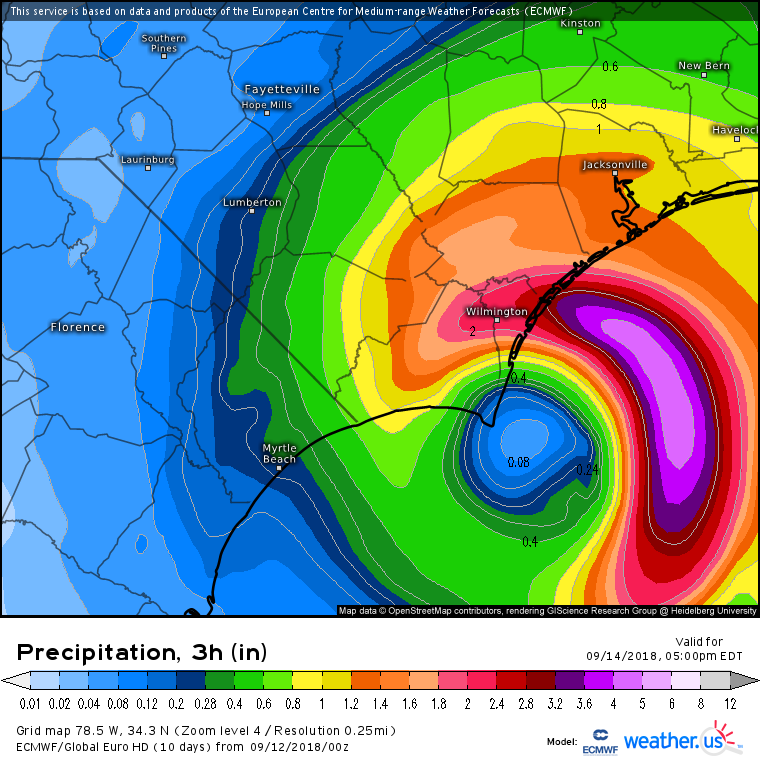
Anyone have the precip map for the euro?
Check it out: https://weather.us/model-charts/euro/791-w-341-n/acc-total-precipitation/20180918-1200z.html
-
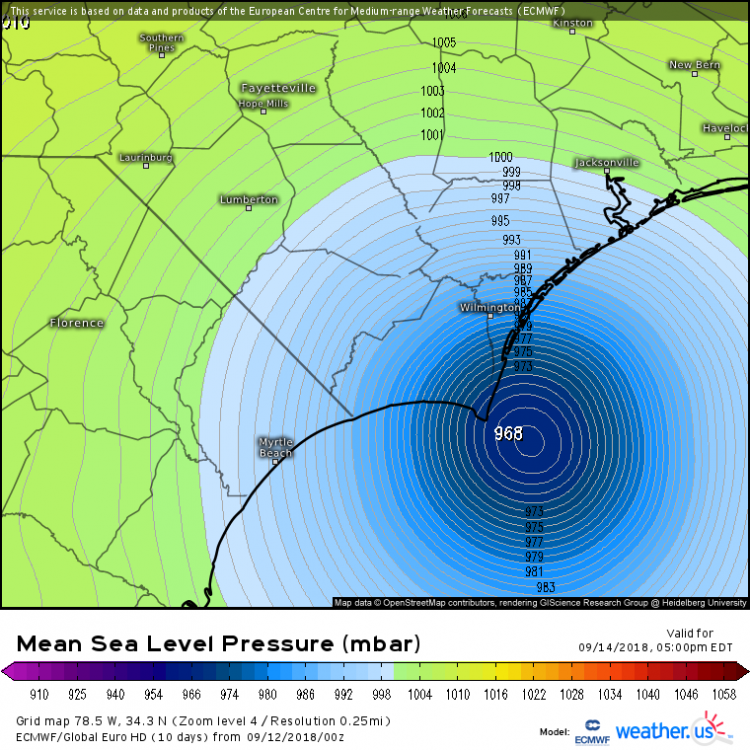
Another pretty crazy Euro run with the center meandering 5-10 miles offshore, while the NE quad scours the coast from Jacksonville to Wilmington and then beyond. Storm a little weaker on its SW drift compared to yesterday, probably reasonable given upwelling. Free/sharable ECMWF via https://weather.us/model-charts/euro/785-w-343-n/gusts-3h-mph/20180914-2100z.html
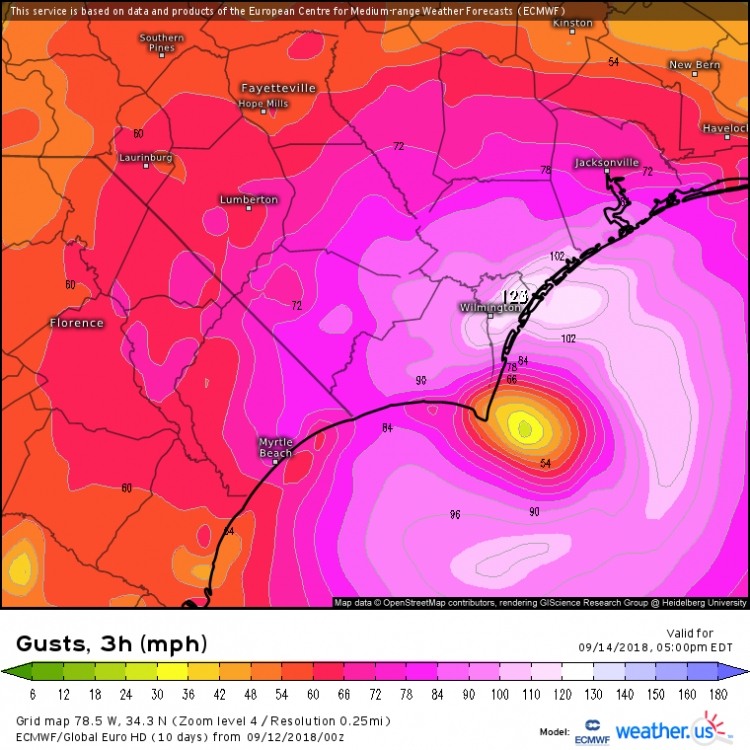

.thumb.png.d5bc0aedfa3bb0bce2daf7c0bb8f9da3.png)
-
1 minute ago, Buddy1987 said:
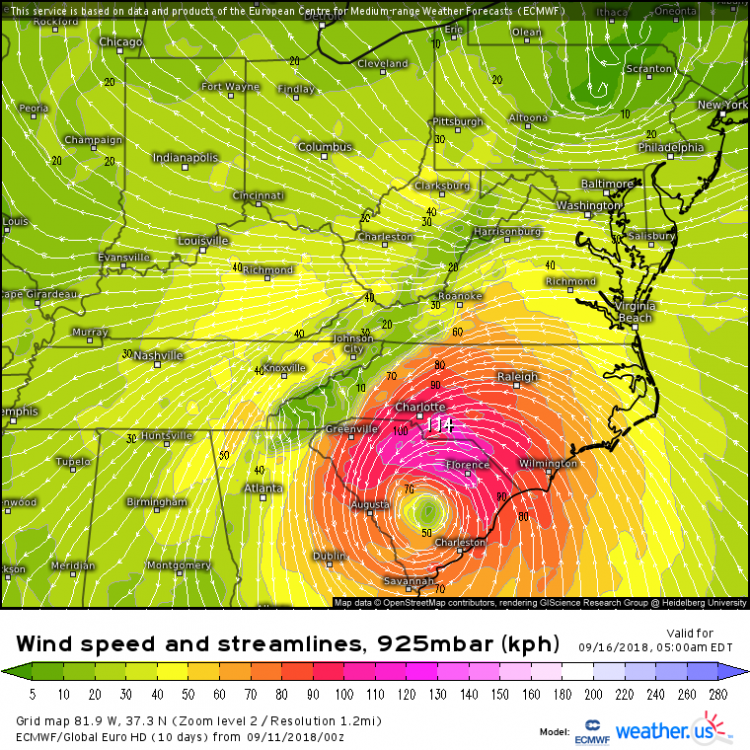
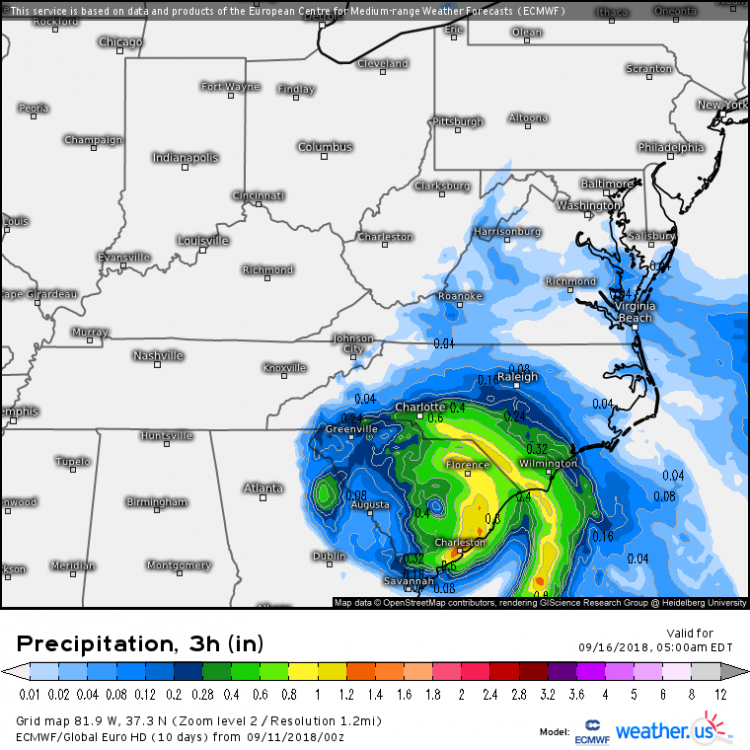
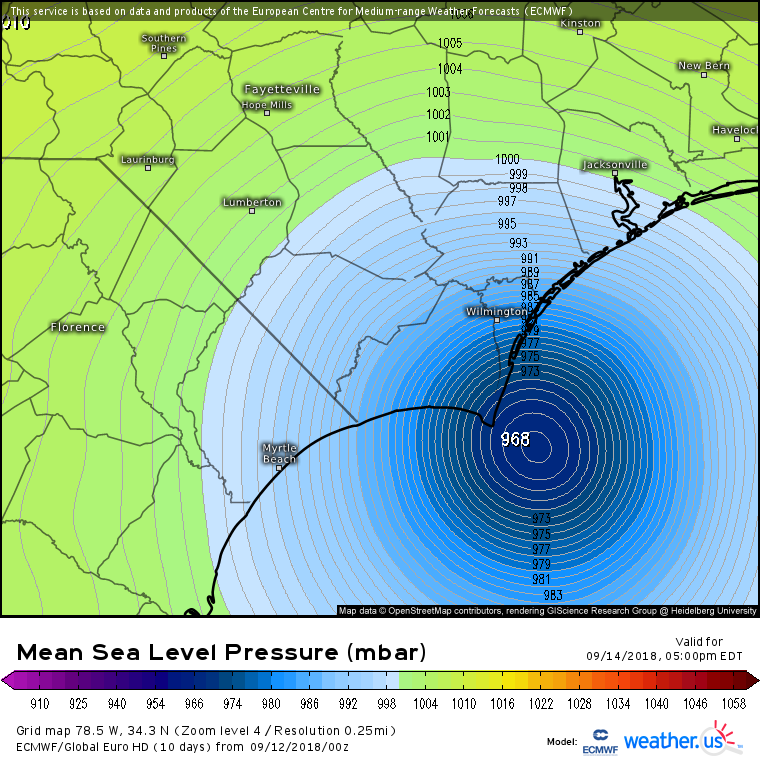
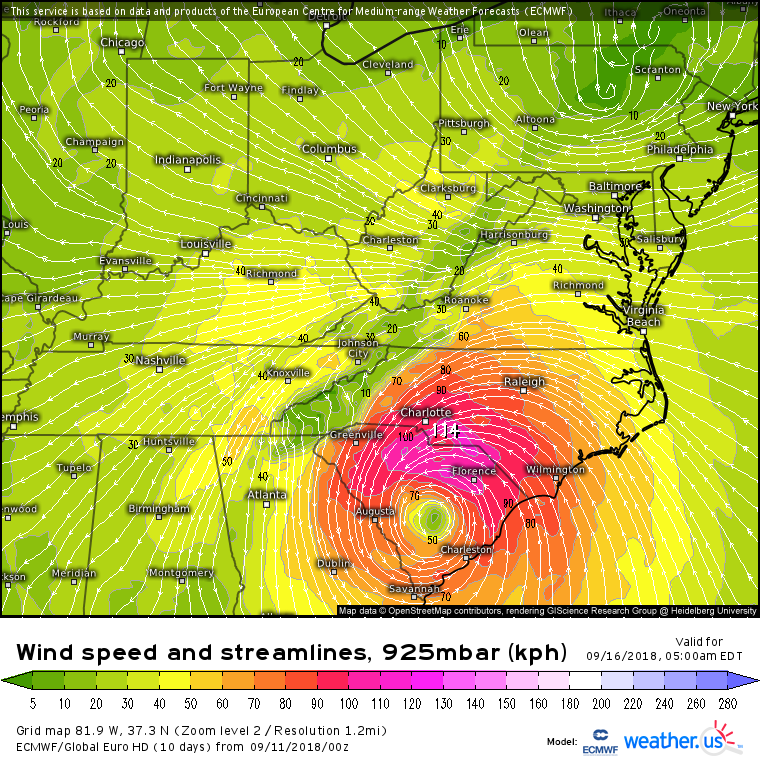
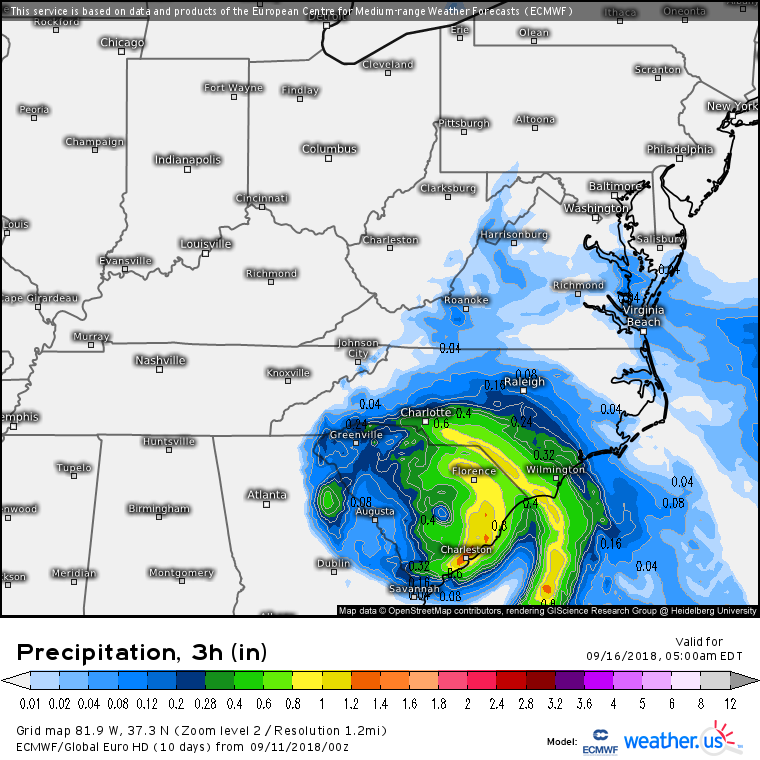
To one of the pros that frequent the board. This is for VA/NC mountains. If the system stalled let’s say over south central SC, wouldn’t that still create a ton of lift and add to a southeast component streaming straight from the Atlantic? Long story short would some of the QPF be under-modeled potentially along the spine of the Blue Ridge?
Not necessarily a pro, but yes upslope flow would enhance rains with SE winds. However, a storm stalled over SC would produce N/NE winds over the VA/NC mountains. See graphics below for illustration. (full res ECMWF maps free from https://weather.us/model-charts/euro/819-w-373-n/wind-925mb/20180916-0900z.html)
-
1
-
 1
1
-
-
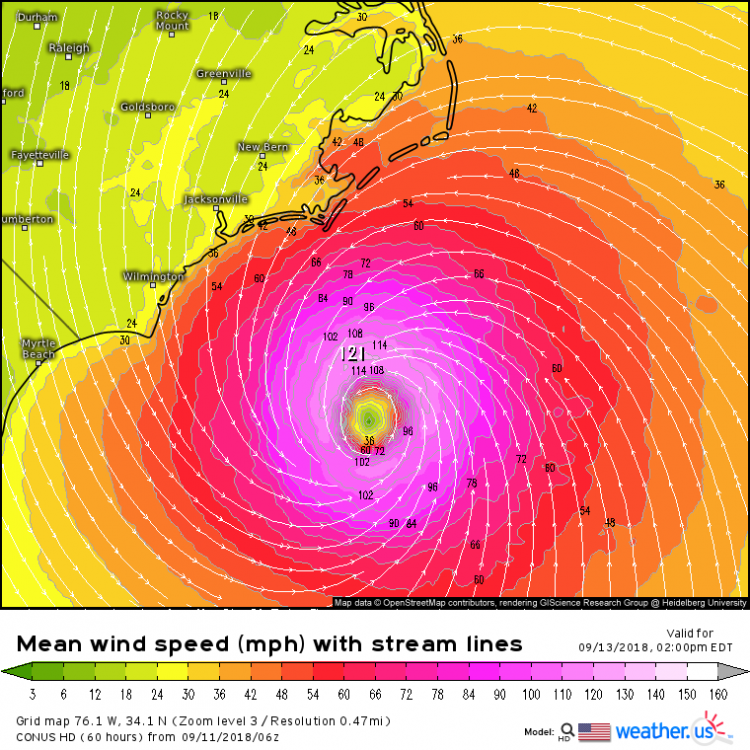
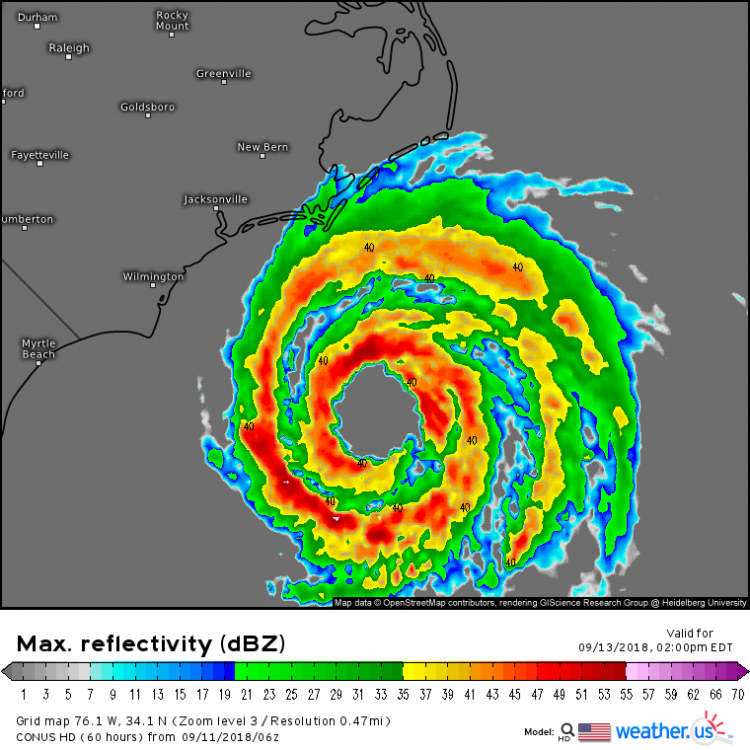
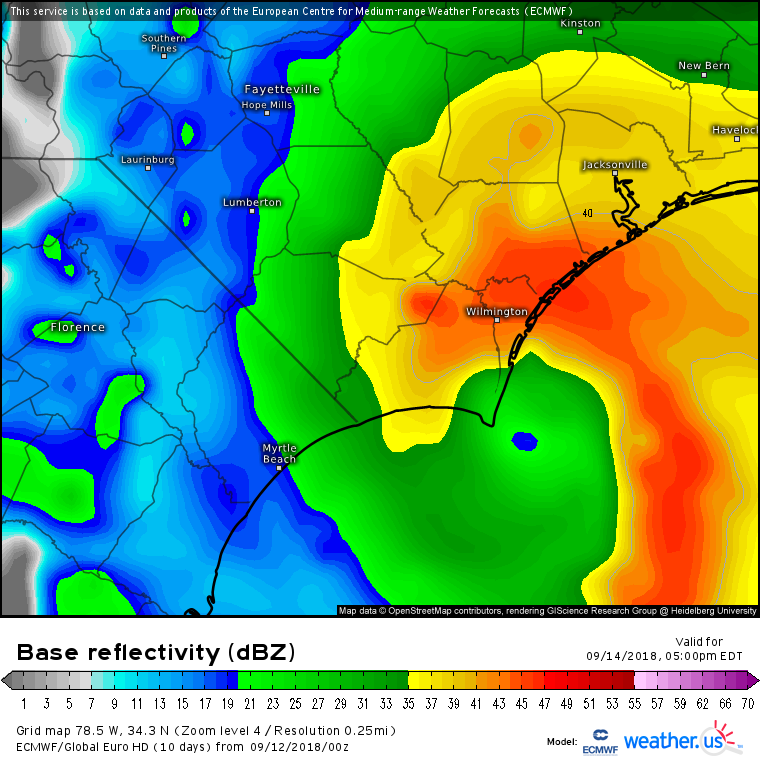
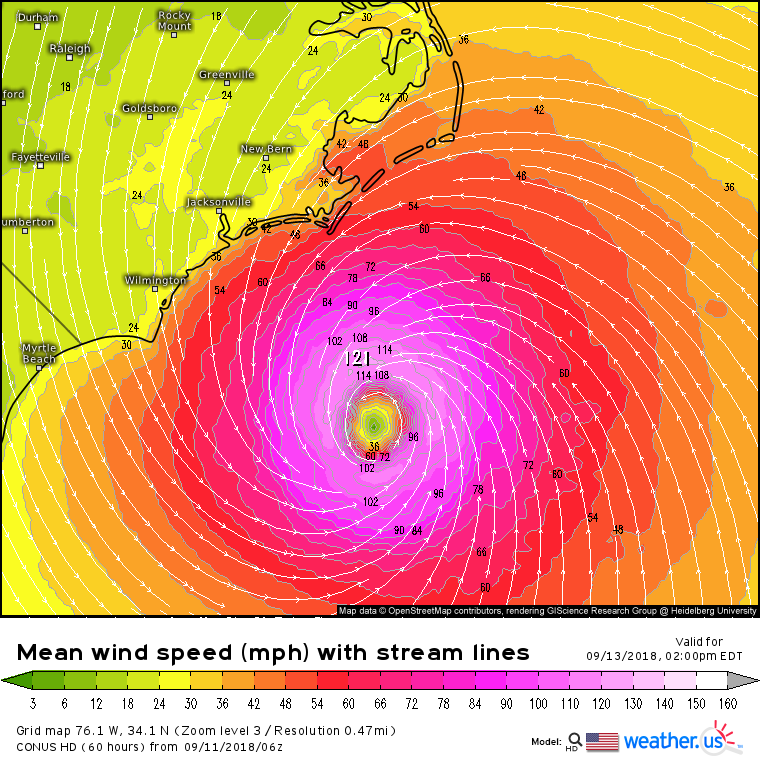
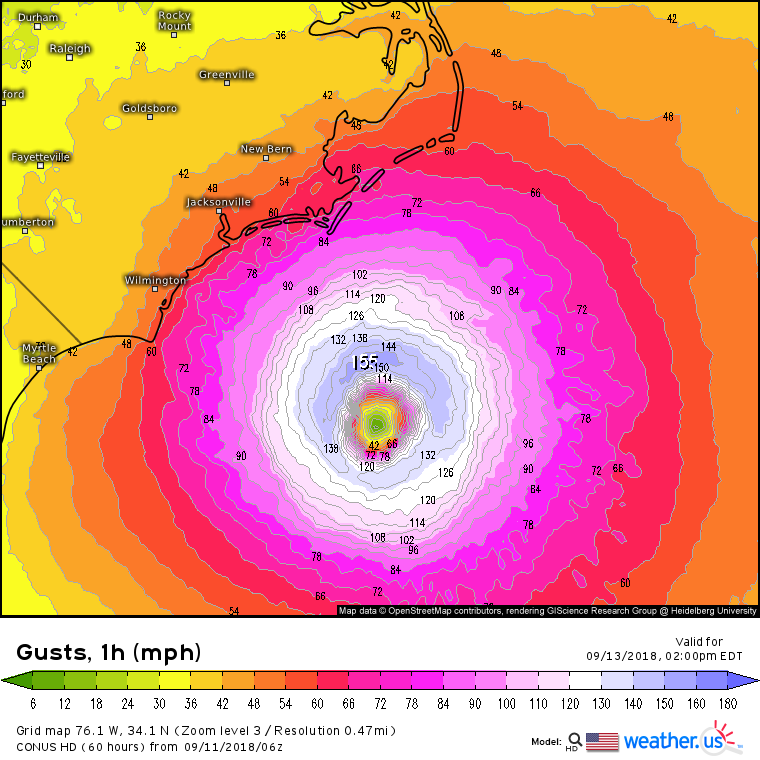
The NAM has known issues that result in erroneous deepening of TC's. But, because of low biases in model produced 10m wind plots, it may actually have the most reasonable model depiction of sustained winds/gusts in Florence as it approaches NC/SC. Sustained 120's gusting 150's is very reasonable, even though 920mb probably isn't (though who knows given the favorable environment). Images from https://weather.us/model-charts/conus-hd/761-w-341-n/radar-reflectivity/20180913-1800z.html


-
2
-
-
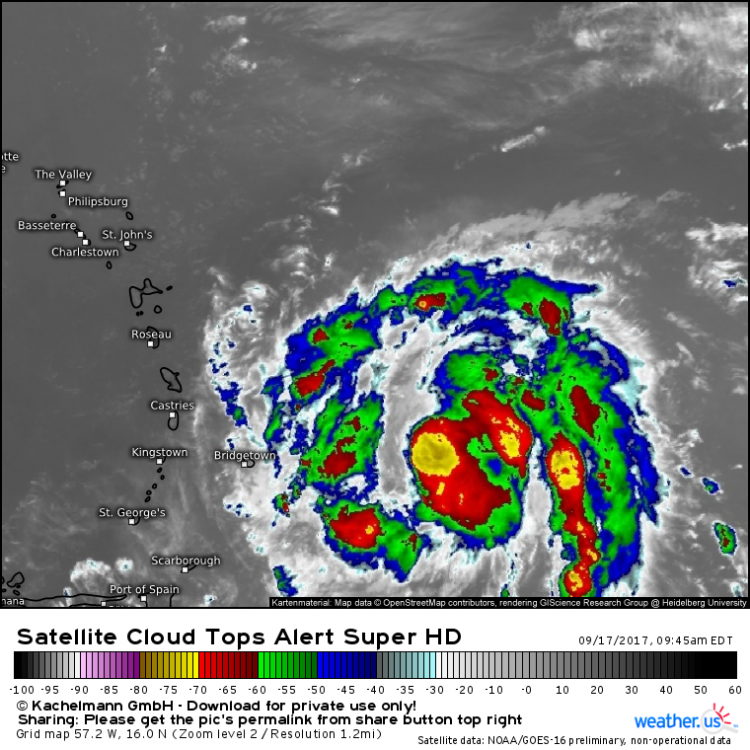
Maria is quite a big system which may slow intensification a little bit. Nevertheless, everything is improving on satellite. Strengthening storm for sure. Loop: https://weather.us/satellite/572-w-160-n/top-alert-superhd-15min.html#play
-
1
-
-
12Z ECMWF beginning to run. Reminder that you can get all the full-res non-WMO essential ECMWF products here for free: https://weather.us/model-charts/euro use menus to the left of the image to navigate and let me know if you have any questions
")


.png.065747c0af76585c5c2533633414f5a5.png)
.png.dea79a69d483e5667ced08e6ab27914b.png)

.png.530e798b965dc79d515efdbb429f1baf.png)


January 25-26 Threat
in New England
Posted
hi!
Let's take a look at the EPS...
All members have honed in on a low track somewhere between the Mass Pike and Long Island. There's still a bit of variability within those bounds though, and that will make all the difference for N MA/S VT/S NH/S ME.
Taking a look at EPS snow depth forecasts for after the event, it's pretty clear that even in the more southern solutions, the I-95 corridor is all rain. You'll note a lot more spread as you move into the Catskills/Albany/Berkshires/Southern NH/Worcester Hills area. That's where future adjustments in track/intensity will make all the difference IMO.
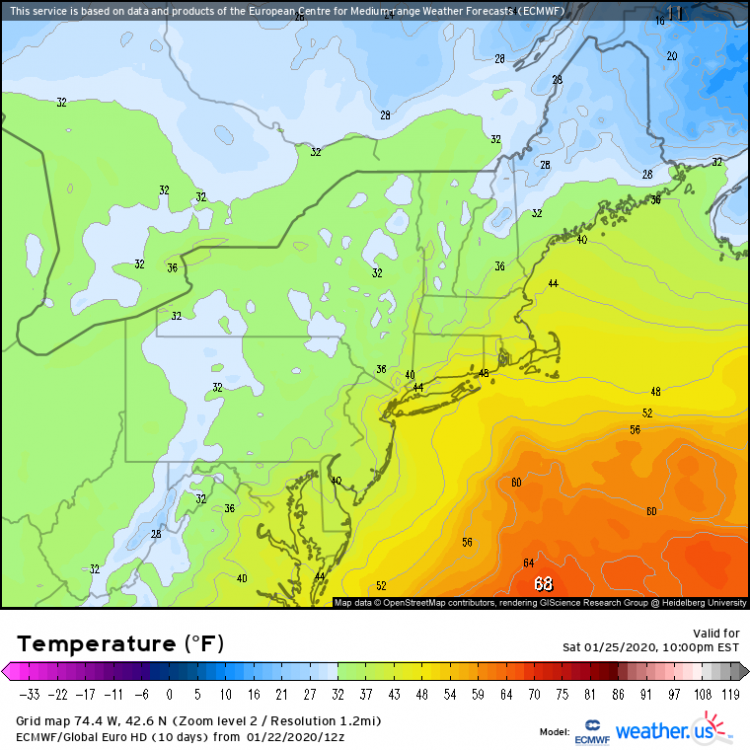
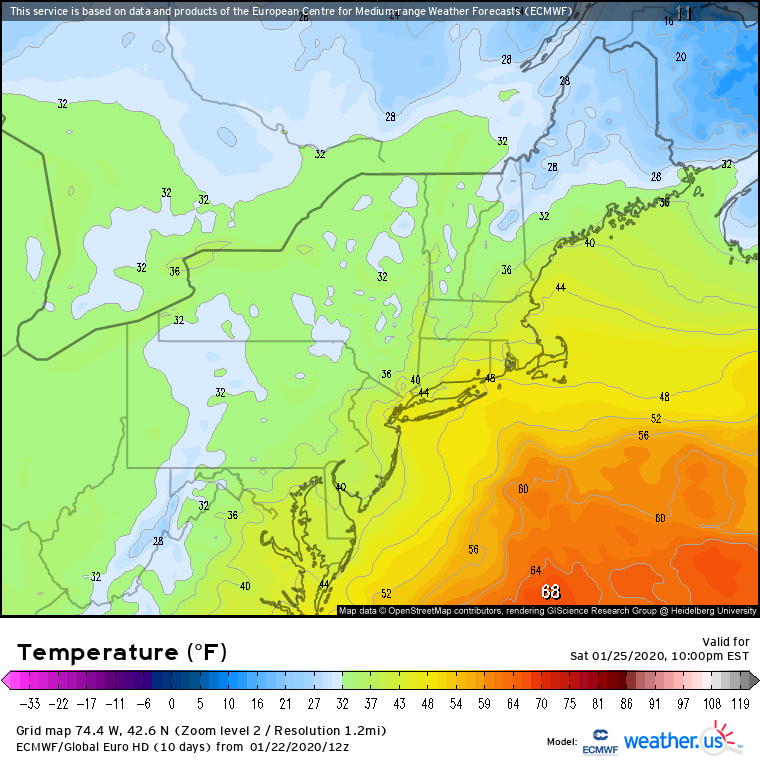
Another way to look at this is by seeing what the coldest 2m temp forecast among all the EPS members is. For 10 PM Saturday when the heavier precip would be around, even the coldest ECMWF members have the I-95 >32F.
So there's still some room for a southeastward correction, but it's probably too small to matter much for the I-95. Interior areas though definitely should keep watching