
acoolerclimate
-
Posts
26 -
Joined
-
Last visited
Content Type
Profiles
Blogs
Forums
American Weather
Media Demo
Store
Gallery
Posts posted by acoolerclimate
-
-
Thought I'd chime in from Rhode Island. I'm in Pawtucket, but my weather station is over in North Providence, about 2 miles and 50 feet higher in elevation. It is 32.4 there right now. About 1.0 of snow, maybe. It was very wet and just above freezing for most of the early part, so even though it was snowing fairly well, it really didn't stick. It's moderately snowing right now. (I live in an old mill building in Pawtucket, no where to put my weather station. So I keep it at my sister's house in North Providence). It does everything but measure snow).
-
 1
1
-
-
7.93 inches as of now in North Providence for the 2 days. Most rain I have ever personally measured in this amount of time.
-
2
-
-
I’ve had 5.23 inches as of 11:40 pm. North Providence. So weird to see the airport at quite a bit less. It’s not that far south.
-
2
-
-
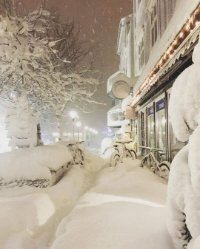
9.5 inches here in North Providence, RI. What a great day yesterday. Snow from morning till night.
-
2
-
-
3 minutes ago, CoastalWx said:
You sure it wasn't Dec '92? Although you wouldn't have sleet. Probably just some lighter precip rates at borderline temps.
Actually, I think you are correct. Dec 92 does sound right. I'll have to look it up. I lived in Russell from Feb 86 until June 1996. (With the winter of 93-94 away in Arizona. Of course!, but at least I was there for 95-96)
-
1 hour ago, weathafella said:
I agree there’s no logical explanation but that’s the bragging rights location for Boston climo.
I know what you mean! I like the first order station to show the high totals, for the record books. (Although I hate it when they get way more, even though the forecast was I would get the same. Dec 2020 when I was living in Nutley, NJ. Newark Airport and Central Park both had around 11 inches of snow. Just 8 miles away in Nutley, I had 6. So Weird).
-
45 minutes ago, 40/70 Benchmark said:
Depends.....if its an event where I get 18" and like 10 miles away get 36", sure.
This is what happened to me back in the late 80's. I was living in Russell, MA on top of a high hill, about 810 feet up. Big storm in Dec. All day it was beautiful, large flakes, got to about 14 inches, and then it changed to a mix of snow/sleet/slop all night. Next morning had about 16 inches of pocked marked snow, and all of it was melted off the trees. But just 10 or so miles away and another 500 to 800 feet up, Otis had 36 inches. I'm still smarting from that one, all these years later. Can't remember the year....1988 I think?
-
1 hour ago, 40/70 Benchmark said:
I had 127.5" in Wilmington......
I had 143.5 in Russell, MA at about 810 feet in elevation.
-
2 minutes ago, FPizz said:
Maybe these people didn't take care of them. It was funny to see though when they looked healthy.
I did a double take when I saw the Palm Trees here in Rhode Island. Very close to me, but I think it's the town of Lincoln. It looked so odd!!
-
On 9/22/2021 at 3:21 PM, rclab said:
Good afternoon JG. Your post reaction is understandable, however there are nuances to the term. Palm trees may be a physical manifestation of tropical as are dews. We are experiencing sustained heightened dews in a calendar time and geographic locations that gives pause. BW, as many other fine posters in our sub forums neither hypes or sensationalizes. Data and demonstration of such is their deep throat. As always ….
Interesting. I live in North Providence, Rhode Island, and just down the road there is a house with Palm Trees in the front!! I can't wait to see what happens to them in the winter, but scary they are growing here at all.
-
2
-
-
1 hour ago, Syrmax said:
Interesting subject, writ large. This has been one of the hot button issues in the world of climate study for decades. Instrument and loop calibration programs and frequency thereof, changing environments around sensors, data extrapolation over wide areas etc, are controlled to widely varying standards (to put it charitably) globally. Without being inside baseball, so to speak, we have no way of knowing what the level of uncertainty is around any particular instrument especially over long periods. Studies have been done that attempt to address this, and i assume are still being conducted, with satellite data thrown in the mix. It does give one pause in regards to data quality contentions, at least for those of us that are experienced with such issues in the engineering field. If we find bias errors in relatively "advanced" countries with some frequency, doesn't really give a warm fuzzy regarding that temp sensor record in Outer Mongolia.
")
I thought I'd do an unscientific study of the departure from normal over the last 2 1/2 years for locations found in the Local Climatological Data section of the NWS Websites. I'm using the unedited data that is showing there. Here are the departures from normal based on those pages for the following stations: If I'd hazard a guess, I'd say someone thought maybe Albany was reading too warm, so they tried to fix it, but they went too far. The problem starts in Aug of 2020, about a year ago, just like TugHillMatt said. It also appears as though Syracuse is reading too warm this year, while Binghampton was a bit on the cool side in 2019 and 2020.
2019. Jan. Feb. Mar. Apr May. Jun. Jul. Aug. Sep. Oct. Nov. Dec. Average
Albany 0.7. 1.7. 0.1. 2.0. 0.2. 0.8. 4.4. 1.6. 1.9. 3.9. -3.0. 1.3 1.2
Poughkeepsie 1.9 2.3. .0. 2.4. 1.1. 0.1. 3.8. 0.9. 1.6. 3.6. -4.3 0.2. 1.1
Glens Falls 1.7. 1.0. -0.5. 0.7. 0.4. .0. 3.5. .0. 0.5. 2.9. -4.6. 0.5. 0.5
Bennington. -0.5 1.9. -1.2. 1.3. 0.3. -0.3. 2.8. 0.6. 0.3. 2.9. -4.8. 0.5. 0.3
Pittsfield. 0.6. 2.2. -0.1. 2.3. 0.9. 0.7. 4.3. 1.2. 1.8. 3.6. -3.8. 1.5. 1.3
Binghampton. -1.9. 1.1. -2.1. 1.5. -0.1. -1.2. 3.0. -0.6. 1.4. 2.3. -5.5. 0.5. -0.1
Burlington -1.5. 0.7. -0.6. 0.7. -1.4. 0.2. 4.3. 1.4. 1.5. 4.0. -5.2. 1.6. 0.5
Syracuse -2.2. 0.7. -1.8. 1.2. -0.6. -0.7. 3.5. -0.1. 1.9. 2.9. -4.6. 1.1. 0.1
2020. Jan. Feb. Mar. Apr May. Jun. Jul. Aug. Sep. Oct. Nov. Dec. Average
Albany 9.2. 5.6. 7.3. -1.2. 1.5. 3.6. 4.1. -1.3. -2.2. -0.8. 1.3. 1.4. 2.4
Poughkeepsie. 7.5 6.0. 6.1. -2.8. -0.7. 2.5. 5.2. 3.0. 1.1. 2.6. 4.2. 2.1. 3.1
Glens Falls. 7.8. 2.5. 5.4. -2.0. 0.4. 1.3. 4.1. 0.9. -0.4. 1.7. 3.2. 2.6. 2.3
Bennington. 7.8. 3.0. 5.3. -2.3. 0.9. 1.9. 4.5. 1.8. 1.2. 2.5. 4.4. 2.9. 2.8
Pittsfield 9.0. 5.1. 6.2. -1.6. 0.4. 2.8. 5.8. 2.2. 2.1. 2.8. 4.8. 3.9. 3.6
Binghampton. 6.2. 3.2. 5.3. -4.1. -0.7. 0.8. 4.4. 2.0. 0.5. 1.2. 4.5. 1.8. 2.0
Burlington 7.4. 3.3. 6.3. -1.4. 1.6. 3.1. 6.2. 2.2. 1.6. 2.0. 5.1. 5.5. 3.6
Syracuse 7.4. 2.6 6.1. -2.5. -0.8. 2.6. 5.8. 3.2. 1.8. 1.3. 5.0. 4.4. 3.1
2021. Jan. Feb. Mar. Apr May. Jun. Average
Albany. 0.7. -2.2. 1.4. -1.1. -4.0. -0.2. -0.9
Poughkeepsie 3.4. -1.4. 4.2. 2.1. -0.8. 2.7. 1.7
Glens Falls. 4.1. 0.4. 2.8. 1.2. -0.7. 2.9. 1.8
Bennington. 2.4. -1.0. 2.7. 2.0. -0.5. 3.3. 1.5
Pittsfield. 3.5. 0.1. 3.0. 1.9. -0.6. 3.3. 1.9
Binghampton. 2.2. -1.5. 3.0. 0.2. -1.1. 3.4. 1.0
Burlington. 2.1. -1.1. 2.8. 2.4. 0.5. 4.3. 1.8
Syracuse 3.6. -0.8. 4.4. 2.3. 0.8. 5.5. 2.6
-
2
-
 1
1
-
-
2 hours ago, TugHillMatt said:
I'm glad you brought it up. They've consistently been "colder" than much of Eastern NY for probably the past year. I just never took the initiative to contact Albany NWS about it. I would think they'd have investigated it by now?
Yes, you would think the Met's there would have noticed they were consistently reading colder, but I'm guessing no one has the time to compare Albany with the other stations.
I have a friend who works at the office in Columbia, SC. I'm going to ask him if the staff every notices things like that.
-
1
-
-
2 minutes ago, TugHillMatt said:
YES!!! I have mentioned this numerous times! Their sensor is always colder, while the surrounding local obs are 5 to 7 degrees warmer.
I knew I wasn't crazy. I lived in Albany from 2001 to 2008. My own temps weren't that different from surrounding areas back then.
-
2
-
-
1 minute ago, TugHillMatt said:
Oh, yeah, I remember that with Buffalo last year! LOL at ROC.... "the thing we do not speak of" anymore....

Syracuse suspiciously just went from 88 degrees to 83 degrees. Perhaps they checked something? BGM told me they were investigating...so maybe it was corrected?
Speaking of instrument error, has anyone else noticed that Albany, NY has been reading quite low recently? I've noticed they seem to always be below normal for the month, even though all the stations around them are above normal.
-
14 hours ago, binbisso said:
Sarcus is it possible to add white plains to the list. Also is there a defect with Gauge at Newark? How are they more than doubled any other site att even places well south and southwest of there?
Hello, I live in Nutley, NJ, which is about 8 miles north of Newark Airport. I have a TempestWX weather station. I compared my 90 degree days this year to Newark's. I've had 9. I missed two of Newark's 90 days in May, and 2 in June. Usually I'm only a degree or 2 colder than Newark, but occasionally I'm 1 degree warmer. Most of the differences of those 4 were Newark was 90 or 91 and I was 88 or 89. But one day does stand out. May 22nd was 96 in Newark, but I was only 89. I don't have any other temp days with that big a difference. Something happened that day.
-
2
-
-
I measured 16 inches here in Nutley. I'd love to get 4 more inches overnight through tomorrow to make it to 20. Photo taken about 5:30 pm.

-
3
-
1
-
-
11 inches here in Nutley, NJ at noon.
-
It appears the both Central Park and Newark will not hit 70 Degrees this April. I did some research, but I can find how common this is. It is odd too, when Jan hit 70 and March hit 80 in Newark this year. Anyone know how often, when the last time was, that April failed to hit 70?

Last Hurrah Obs Thread: 3/13-15/23
in New England
Posted
39 here in North Providence, RI. Dew Point is 38.8. This whole winter has sucked for Rhode Island. We've missed just about everything. I'm not holding out much hope for this one. I can see us at 34 and rain the whole time, maybe with snow mixed in. I knew RI was warmer, but I never dreamed it could be this different from Worcester on North.