wx2fish Posted December 20, 2020 Share Posted December 20, 2020 2 hours ago, PhineasC said: The Christmas tropical disaster will wipe out a lot of hard work on the mountains. It'll be interesting so see how your area does on those sneaky NW flow uplsope events. I'm guessing pretty well. Its Pittsburg's bread and butter. I'm sure your location is better synoptocally, but they do really well on the surprise 6-12"+ powderfreak specials. The type of pattern where every fropa drops 3-6"+ 1 Link to comment Share on other sites More sharing options...
backedgeapproaching Posted December 20, 2020 Share Posted December 20, 2020 27 minutes ago, powderfreak said: I think it starts compressing on itself pretty fast at those amounts. Unless you cleared and added the total to it, I think it could’ve snowed up to another 10” but only added a couple inches to the depth. I think at 40” you probably only add an inch of depth if the snow rate is 3”/hr. That’s extremely hard to maintain. Even if snowfall tapered to 1-2”/hr there might have actually been no gain or even settlement. Just an amazing high-end event. The fact that there was 24-30” on the ground and gaining 6” per hour in snow depth is incredible to me. Usually at 24” stuff starts to compress... but to stomp on the gas at that point up into the 40s for snow depth is insane. I was pretty surprised to find 32" depth at 11am on Friday almost a full 24 hours after the heavy heavy stuff stopped in East Dorset. Pretty amazing that the 24hr state record could have also been in East Dorset at 730ft in the Valley if there had been an official observer or someone who cleared just once. Imagine the state record for VT being held in a somewhat snowhole above Jay, Stowe, Stratton, etc? 50 years from now weenies looking and saying how the hell is East Dorset the 24 hour record holder...lol. What could have been. Ha Link to comment Share on other sites More sharing options...
PhineasC Posted December 20, 2020 Share Posted December 20, 2020 Decent upslope signal appearing on the models for the midweek period before the tropical rains. 00z RGEM looks pretty good as a signal. Link to comment Share on other sites More sharing options...
powderfreak Posted December 20, 2020 Share Posted December 20, 2020 Crazy strong inversion this morning. I had 15F at my house, 20F at 1500ft at the office... but snowmaking was shut down due to temps. 20F in the parking lot and no snowmaking?! 30F at mid-Mtn and 31F summit. Every morning per tramway code we need to run all auxiliary power on the lifts, so the Gondolas back up diesel motors pump out some blue smoke when they start up... check out the visual representation of the low inversion just above the base area by the horizontal smoke layer. 1 Link to comment Share on other sites More sharing options...
PhineasC Posted December 20, 2020 Share Posted December 20, 2020 The RGEM keeps printing out .30"+ liquid for the favored upslope areas, the GFS and NAM are less excited but still have a signal. Link to comment Share on other sites More sharing options...
wxeyeNH Posted December 20, 2020 Author Share Posted December 20, 2020 20 minutes ago, PhineasC said: The RGEM keeps printing out .30"+ liquid for the favored upslope areas, the GFS and NAM are less excited but still have a signal. Forget the .30". More important. Grab me a dozen lumpmeat crabcakes and I'll meet you off Exit 24 on Rt 93 tomorrow. That is one thing that NNE does not have 1 Link to comment Share on other sites More sharing options...
bwt3650 Posted December 20, 2020 Share Posted December 20, 2020 A Christmas miracle? Gfs has it snowing hard up here before midnight on Christmas Eve. Would be nice to see more than one run of more than one model but it’s a start. Link to comment Share on other sites More sharing options...
J.Spin Posted December 20, 2020 Share Posted December 20, 2020 6 minutes ago, bwt3650 said: A Christmas miracle? Gfs has it snowing hard up here before midnight on Christmas Eve. Would be nice to see more than one run of more than one model but it’s a start. How a system like that one is going to play out for someone in your location is often night and day compared to what happens along the coast of SNE; for a spot like Jay Peak, we’re not even talking in the realm of miracles for a decent outcome. It’s essentially the counterpoint to what went on during Winter Storm Gail in the Jay Peak area – while that type of an event is sort of a one-off/occasional thing, the look of the next week is more of a typical winter reality result. There are actually four potential snow events in the next week though (today, Tue/Wed, Fri, and Sat/Sun), and that’s a pretty respectable pace, even for the Northern Greens. 1 Link to comment Share on other sites More sharing options...
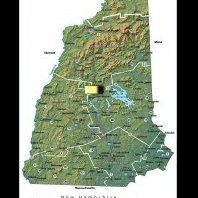
backedgeapproaching Posted December 20, 2020 Share Posted December 20, 2020 This shows the Dendrite/Gene area relative minimum for big events(at least to the rest of NE). This map will look different now obviously. The second tweet 1 Link to comment Share on other sites More sharing options...
dendrite Posted December 20, 2020 Share Posted December 20, 2020 Yeah I’ve had a few in that 18-21” range since 2006, but nothing over that. I’m assuming he didn’t get back to the early 2000s yet though since this area did well in a few events back then. Now my record daily snowfall is higher than ORH’s and my greatest storm is only 0.1” less. Link to comment Share on other sites More sharing options...
wxeyeNH Posted December 20, 2020 Author Share Posted December 20, 2020 1 minute ago, dendrite said: Yeah I’ve had a few in that 18-21” range since 2006, but nothing over that. I’m assuming he didn’t get back to the early 2000s yet though since this area did well in a few events back then. Now my record daily snowfall is higher than ORH’s and my greatest storm is only 0.1” less. I am not a good record keeper but it seems I get "stuck" in the 12-14" range for big events. Maybe cause the down sloping from a north or northeast wind with the Whites in that general direction. Perhaps because this storm was not deep and didn't have a strong wind that helped somewhat? Although I had the lowest visibilities I have ever had with a synoptic event I wish I was just 10 miles further south to see the true "deathband" rates. Another thing I noticed when it was snowing at the 3-4" rates was that it just looked like fog outside. So many flakes falling it was hard to discern the individual flakes unless you had a dark backdrop no more than 5 or 10 feet away. 1 Link to comment Share on other sites More sharing options...
LaGrangewx Posted December 20, 2020 Share Posted December 20, 2020 1 hour ago, backedgeapproaching said: This shows the Dendrite/Gene area relative minimum for big events(at least to the rest of NE). This map will look different now obviously. The second tweet Cool map. I’ve seen his maps before. He does some pretty accurate post event analysis. Shows my areas max of about 2 feet pretty well. Link to comment Share on other sites More sharing options...
J.Spin Posted December 20, 2020 Share Posted December 20, 2020 Snow just started falling here in Waterbury. Link to comment Share on other sites More sharing options...
qg_omega Posted December 20, 2020 Share Posted December 20, 2020 2 hours ago, backedgeapproaching said: This shows the Dendrite/Gene area relative minimum for big events(at least to the rest of NE). This map will look different now obviously. The second tweet That’s mostly pd #2 and the gaps were filled in with this past storm Link to comment Share on other sites More sharing options...
J.Spin Posted December 20, 2020 Share Posted December 20, 2020 Event totals: 0.8” Snow/0.06” L.E. We had radar echoes overhead for quite a while this afternoon here at our site, but it took a while for snow to actually present itself visually, presumably due to required moistening in the atmosphere. Once it did get going, the snowfall rate was pretty heavy there for a bit, with flakes up to ¾” with a mix of other flake sizes. As of the 6:00 P.M. observations time, the snowfall rate had tapered back to something lighter however. Details from the 6:00 P.M. Waterbury observations: New Snow: 0.8 inches New Liquid: 0.06 inches Snow/Water Ratio: 13.3 Snow Density: 7.5% H2O Temperature: 26.2 F Sky: Light Snow (1 to 4 mm flakes) Snow at the stake: 4.5 inches Link to comment Share on other sites More sharing options...
Ginx snewx Posted December 21, 2020 Share Posted December 21, 2020 4 hours ago, wxeyeNH said: I am not a good record keeper but it seems I get "stuck" in the 12-14" range for big events. Maybe cause the down sloping from a north or northeast wind with the Whites in that general direction. Perhaps because this storm was not deep and didn't have a strong wind that helped somewhat? Although I had the lowest visibilities I have ever had with a synoptic event I wish I was just 10 miles further south to see the true "deathband" rates. Another thing I noticed when it was snowing at the 3-4" rates was that it just looked like fog outside. So many flakes falling it was hard to discern the individual flakes unless you had a dark backdrop no more than 5 or 10 feet away. Like this 2 Link to comment Share on other sites More sharing options...
powderfreak Posted December 21, 2020 Share Posted December 21, 2020 6 hours ago, backedgeapproaching said: This shows the Dendrite/Gene area relative minimum for big events(at least to the rest of NE). This map will look different now obviously. The second tweet Nice find. I feel like October 2011 crushed that minimum zone from western SNE into central NNE up at least to Dendrite. That was another storm with a band of 18-24"+. That map does show the mean storm vector though, ha. New England is swaths of SSW to NNE direction bands of big totals. This storm sort of bucked that trend with a strong block and oriented almost due west to east at one point in CNE. Link to comment Share on other sites More sharing options...
powderfreak Posted December 21, 2020 Share Posted December 21, 2020 Eyeballing 0.75-1.0" this evening at home. Up at the hill it was also snowing pretty decently on the way home. Such a contrast in energy from the hustle & bustle of the midday weekend environment, to this peaceful & quiet scene this evening. Link to comment Share on other sites More sharing options...
alex Posted December 21, 2020 Share Posted December 21, 2020 The new restaurant and food court up top at Bretton Woods are pretty awesome 11 Link to comment Share on other sites More sharing options...
JakkelWx Posted December 21, 2020 Share Posted December 21, 2020 That is absolutely wallpaper worthy. Link to comment Share on other sites More sharing options...
dendrite Posted December 21, 2020 Share Posted December 21, 2020 These numbers still make me laugh. It looks like a typo. 12/01 62.5 39.7 0.00 0.0 0 12/02 40.6 30.3 0.00 0.0 0 12/03 45.1 24.6 0.00 0.0 0 12/04 51.9 30.2 0.00 0.0 0 12/05 37.1 31.6 1.12 3.1 3 12/06 31.8 26.1 T T 3 12/07 27.9 24.6 0.00 0.0 3 12/08 28.5 21.4 0.00 0.0 3 12/09 30.4 19.5 0.00 0.0 3 12/10 38.6 27.8 0.00 0.0 3 12/11 39.4 24.5 0.00 0.0 3 12/12 38.3 26.7 0.10 0.0 3 12/13 39.0 31.7 0.13 0.0 2 12/14 36.0 28.4 T T 2 12/15 31.1 11.7 0.00 0.0 2 12/16 20.9 8.6 T T 2 12/17 20.8 13.9 1.89 34.4 31 12/18 23.3 6.5 0.00 0.0 28 12/19 26.9 -0.9 0.00 0.0 21 12/20 26.2 14.6 0.01 0.2 19 3.25 37.7 Link to comment Share on other sites More sharing options...
powderfreak Posted December 21, 2020 Share Posted December 21, 2020 17 minutes ago, alex said: The new restaurant and food court up top at Bretton Woods are pretty awesome Wow, what a view. Link to comment Share on other sites More sharing options...
OceanStWx Posted December 21, 2020 Share Posted December 21, 2020 10 hours ago, dendrite said: These numbers still make me laugh. It looks like a typo. 12/01 62.5 39.7 0.00 0.0 0 12/02 40.6 30.3 0.00 0.0 0 12/03 45.1 24.6 0.00 0.0 0 12/04 51.9 30.2 0.00 0.0 0 12/05 37.1 31.6 1.12 3.1 3 12/06 31.8 26.1 T T 3 12/07 27.9 24.6 0.00 0.0 3 12/08 28.5 21.4 0.00 0.0 3 12/09 30.4 19.5 0.00 0.0 3 12/10 38.6 27.8 0.00 0.0 3 12/11 39.4 24.5 0.00 0.0 3 12/12 38.3 26.7 0.10 0.0 3 12/13 39.0 31.7 0.13 0.0 2 12/14 36.0 28.4 T T 2 12/15 31.1 11.7 0.00 0.0 2 12/16 20.9 8.6 T T 2 12/17 20.8 13.9 1.89 34.4 31 12/18 23.3 6.5 0.00 0.0 28 12/19 26.9 -0.9 0.00 0.0 21 12/20 26.2 14.6 0.01 0.2 19 3.25 37.7 Too many DIPAs and fell asleep on the keyboard? 1 Link to comment Share on other sites More sharing options...
OceanStWx Posted December 21, 2020 Share Posted December 21, 2020 1 hour ago, powderfreak said: Nice find. I feel like October 2011 crushed that minimum zone from western SNE into central NNE up at least to Dendrite. That was another storm with a band of 18-24"+. That map does show the mean storm vector though, ha. New England is swaths of SSW to NNE direction bands of big totals. This storm sort of bucked that trend with a strong block and oriented almost due west to east at one point in CNE. I actually really like how you can see the Benchmark SSW/NNE pivots but also the Mid Altantic WSW/ENE bands. And of course my own personal budding weenie Bermuda triangle of disappointment in RI. Link to comment Share on other sites More sharing options...
alex Posted December 21, 2020 Share Posted December 21, 2020 28 minutes ago, powderfreak said: Wow, what a view. It was built primarily for summer weddings but doubles down nicely in the winter! Link to comment Share on other sites More sharing options...
powderfreak Posted December 21, 2020 Share Posted December 21, 2020 About an inch of new snow from last evening. Link to comment Share on other sites More sharing options...
J.Spin Posted December 21, 2020 Share Posted December 21, 2020 Event totals: 1.0” Snow/0.07” L.E. We didn’t pick up any additional snow beyond what accumulated yesterday evening, so the above totals should be the final numbers for this event. Details from the 6:00 A.M. Waterbury observations: New Snow: 0.2 inches New Liquid: 0.01 inches Snow/Water Ratio: 20.0 Snow Density: 5.0% H2O Temperature: 27.9 F Sky: Mostly Cloudy Snow at the stake: 4.5 inches Link to comment Share on other sites More sharing options...
dendrite Posted December 21, 2020 Share Posted December 21, 2020 The trees are still pretty caked up days later. Getting a little melting now with the temp creeping up to 31° for the first time in a week. Link to comment Share on other sites More sharing options...
PhineasC Posted December 21, 2020 Share Posted December 21, 2020 Just now, dendrite said: The trees are still pretty caked up days later. Getting a little melting now with the temp creeping up to 31° for the first time in a week. Your chickens will need a raft soon. Link to comment Share on other sites More sharing options...
wxeyeNH Posted December 21, 2020 Author Share Posted December 21, 2020 29F In the fog with dim sunshine. Snowstake down to 13". Not expecting this 12 hour thaw into the 40's with an inch of rain to melt the pack, just turn it into a glacier. Good for the turkeys but bad for the deer as they can't run through glaciated stuff and the coyotes can outrun them. Link to comment Share on other sites More sharing options...

Recommended Posts
Create an account or sign in to comment
You need to be a member in order to leave a comment
Create an account
Sign up for a new account in our community. It's easy!
Register a new accountSign in
Already have an account? Sign in here.
Sign In Now