gravitylover Posted December 20, 2019 Share Posted December 20, 2019 14 hours ago, bluewave said: Which date did the above account occur on? I know Erie froze over early and the powder collecting for a month blowing into Buffalo. Most of my memories from that winter were of extreme cold. I realized later last night that it had to be 1978 not 77 because I was walking home from junior high not elementary school. 1 Link to comment Share on other sites More sharing options...
jm1220 Posted December 20, 2019 Share Posted December 20, 2019 15 hours ago, weatherpruf said: And just west across the Hudson we struggled to hit 8, I think we had 6 locally. In Long Beach I had 14”. Was an amazing storm that was forecasted to hit eastern MA. The ridge saved the day for us that time. But what feeds us also takes it away such as with the repeated coastal huggers and inland storms since then. 3-14-17 would’ve been widespread 12-18”+ everywhere if the track was 75 miles to the SE. 1 Link to comment Share on other sites More sharing options...
jm1220 Posted December 20, 2019 Share Posted December 20, 2019 39 minutes ago, bluewave said: I think the Pacific may continue to be the wild card regardless of the temperature departures. This month has a cold departure to date with not much snow from NYC out along the South Shore. Areas inland did much better. Getting cold in December with under 7 inches of snow for NYC has been a rarity during the 2000’s. The only year this occurred was December 2007. Before that, cold in December with lower snowfall amounts was a common occurrence in the 1980’s. So root for some improvements in the storm track going into January. Very much like last winter so far with the cold behind the rain/ice storms keeping the temps near normal or below for the month. Hopefully that changes-luckily it’s early. 1 Link to comment Share on other sites More sharing options...
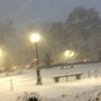
Brian5671 Posted December 20, 2019 Share Posted December 20, 2019 Still ice covered trees here and a coating of snow on the ground-rare to see it stick around that long 3 Link to comment Share on other sites More sharing options...
uncle W Posted December 20, 2019 Share Posted December 20, 2019 the last three months weekly enso has been in weak el nino territory...NYC hardly ever gets a cold December with el nino present without a neg ao and nao...the first half of Dec was below average despite a positive ao and nao...Now the ao looks to average negative the second half and the nao positive till the end of the month...if this el nino becomes official this December would buck the trend unless the next two weeks torch...below is a list of el nino Decembers with the average temperature and monthly ao and nao numbers...2019 could end up averaging around 37.0 which would be around average with 2.5" of snow and a positive ao and nao... year.....ave temp...snowfall.....ao.....nao 1958.......29.4.........3.8".......-1.687.......-0.70 1976.......29.9.........5.1".......-2.074.......-1.60 1963.......31.2.......11.3".......-1.178.......-1.92 1969.......33.4.........6.8".......-1.856.......-0.28 1968.......34.3.........7.0".......-0.783.......-1.40 1977.......35.7.........0.4".......-0.240.......-1.00 2009.......35.9.......12.4".......-3.413.......-1.93 2002.......36.0.......11.0".......-1.592.......-0.94 1997.......38.3..........T..........-0.071.......-0.96 2004.......38.4........3.0"......+1.230.......+1.21 1972.......38.5..........T........+1.238.......+0.19 1986.......39.0........0.6"......+0.060.......+0.99 1987.......39.5........2.6".......-0.534.......+0.32 1991.......39.6........0.7"......+1.613.......+0.46 1957.......40.2........8.7"......+0.828.......+0.12 2014.......40.5........1.0"......+0.413.......+1.86 1965.......40.5..........T........+0.163.......+1.37 1979.......41.1........3.5"......+1.295.......+1.00 1994.......42.2..........T........+0.894.......+2.02 1982.......42.8........3.0"......+0.967.......+1.78 2006.......43.6..........0........+2.282.......+1.34 2015.......50.8..........T........+1.444........+2.24 1 Link to comment Share on other sites More sharing options...
gravitylover Posted December 20, 2019 Share Posted December 20, 2019 ^^That goes back to what I've been saying for the last 2 years. What we've known about all of these different indices and their effects on our sensible weather aren't what they used to be. As the global climate is changing the effects will be different than they have been historically. How we forecast using this new regime is also constantly changing and it shows in how bad short term predictions have been, forget about mid and long term. Another day of striking visuals with the ice still plastered on everything. 1 Link to comment Share on other sites More sharing options...
Brian5671 Posted December 20, 2019 Share Posted December 20, 2019 5 minutes ago, gravitylover said: ^^That goes back to what I've been saying for the last 2 years. What we've known about all of these different indices and their effects on our sensible weather aren't what they used to be. As the global climate is changing the effects will be different than they have been historically. How we forecast using this new regime is also constantly changing and it shows in how bad short term predictions have been, forget about mid and long term. Another day of striking visuals with the ice still plastered on everything. I agree-analogs from the 1960's etc don't really work that well anymore-different base state, different ocean temps etc. 2 Link to comment Share on other sites More sharing options...
CPcantmeasuresnow Posted December 20, 2019 Share Posted December 20, 2019 On 12/19/2019 at 2:30 PM, LibertyBell said: ah I understand where you're coming from, but that bar keeps moving because of the overabundance of big storms we've had in the last couple of decades. The reason why I keep a lower bar for Central Park is because they typically undermeasure in these scenarios- as an example, Feb 1961 was only 15 inches at Central Park, but over 24 inches at JFK. If you set the bar at 21.0 then Jan 1996 is no longer a HECS and neither is PD2; do you see what I mean? Not to mention that Feb 1978 and Feb 1983 are also taken off the list. And so is Boxing Day 2010! If you want to change it to NYC or one of the local airports hitting 18 inches (including rounding up), that seems more reasonable. A very reasonable compromise. The under counts from years past of the big storms for Central Park are legendary and infuriating. I don't have enough time to go over all of them, and you mentioned some of the big ones, and I don't want to get all worked up this morning delving into that subject. On the positive side I think things have improved the last 4-5? years since the task has been taken from the incompetent, and I don't give a sh!t Central Park Zookeeper, to the Park Conservancy. They do seem to at least try to get accurate measurements. Many times in the past the zoo didn't even bother to measure, or just guessed and usually low as you stated. 2 Link to comment Share on other sites More sharing options...
MJO812 Posted December 20, 2019 Share Posted December 20, 2019 1 hour ago, jm1220 said: Very much like last winter so far with the cold behind the rain/ice storms keeping the temps near normal or below for the month. Hopefully that changes-luckily it’s early. This year has been way different than last winter. We had a few snow chances and the nao has been favorable so far. 4 Link to comment Share on other sites More sharing options...
SnoSki14 Posted December 20, 2019 Share Posted December 20, 2019 MJO looks to head towards phase 7 after New Year. If this is correct then we should see colder weather start showing up again. Link to comment Share on other sites More sharing options...
MJO812 Posted December 20, 2019 Share Posted December 20, 2019 3 hours ago, SnoSki14 said: MJO looks to head towards phase 7 after New Year. If this is correct then we should see colder weather start showing up again. Models look really good after christmas 1 Link to comment Share on other sites More sharing options...
EasternLI Posted December 20, 2019 Share Posted December 20, 2019 Just now, Snow88 said: Models look really good after christmas Ensembles look pretty damn good as we move into the new year. GEFS and now the Eps today. 5 Link to comment Share on other sites More sharing options...
MJO812 Posted December 20, 2019 Share Posted December 20, 2019 4 minutes ago, EasternLI said: Ensembles look pretty damn good as we move into the new year. GEFS and now the Eps today. There might be a chance of some snow right near Christmas. 1 Link to comment Share on other sites More sharing options...
EasternLI Posted December 20, 2019 Share Posted December 20, 2019 This is my favorite thing that I've seen that I've been watching. Seems like the IOD has indeed muted the MJO in the Maritime Continent this month as was hypothesized by causing subsidence. It's been weakening. As it loses its influence more and more moving forward, what might be the dominant forcing then? I still like where we're heading. This is not last year. 3 Link to comment Share on other sites More sharing options...
EasternLI Posted December 20, 2019 Share Posted December 20, 2019 12 minutes ago, bluewave said: Notice how the pattern is reversing north of Alaska now that the Chukchi is having one of the latest freeze ups on record. A strong ridge has been sitting over the open water this month. Now the models indicate that a strong vortex will replace it. Sometimes a deep vortex north of Alaska can lead to a more -NAO. This will be something to watch in early January. That's a good point, and a nice observation as usual. I strongly agree with the bolded. It's exceedingly difficult to have ridging in both locations simultaneously. That's been documented in the research as well. It makes sense too, when you think about it. Like when we see a trough on the west coast and ridge on the east coast. Maybe part of the story of the ++NAO during those years with the --EPO. Interesting. 4 Link to comment Share on other sites More sharing options...
MJO812 Posted December 20, 2019 Share Posted December 20, 2019 Cpc has near normal temps for January, February and March with above normal precip. They always have above normal temps for our area. Weird to see them go average. Link to comment Share on other sites More sharing options...
RedSky Posted December 20, 2019 Share Posted December 20, 2019 30 minutes ago, Snow88 said: Cpc has near normal temps for January, February and March with above normal precip. They always have above normal temps for our area. Weird to see them go average. Right it was likely issued after the holiday party when they were full of spiked eggnog 1 Link to comment Share on other sites More sharing options...
NorthShoreWx Posted December 21, 2019 Share Posted December 21, 2019 On 12/19/2019 at 2:30 PM, LibertyBell said: ah I understand where you're coming from, but that bar keeps moving because of the overabundance of big storms we've had in the last couple of decades. The reason why I keep a lower bar for Central Park is because they typically undermeasure in these scenarios- as an example, Feb 1961 was only 15 inches at Central Park, but over 24 inches at JFK. If you set the bar at 21.0 then Jan 1996 is no longer a HECS and neither is PD2; do you see what I mean? Not to mention that Feb 1978 and Feb 1983 are also taken off the list. And so is Boxing Day 2010! If you want to change it to NYC or one of the local airports hitting 18 inches (including rounding up), that seems more reasonable. February 1961 was 17.4" at Central Park. Perhaps you meant February 1969? 1 Link to comment Share on other sites More sharing options...
donsutherland1 Posted December 21, 2019 Share Posted December 21, 2019 A milder pattern will commence this weekend. Overall, the final 10 days of December will likely have above normal temperatures, with perhaps a few somewhat cooler days. Whether or not there will be any snow in parts of the region during that time remains to be seen. Colder air could return during the first week of January. The progression of the MJO in concert with the teleconnections could be crucial in determining whether most of North America's cold air stays bottled up north of the Canada-U.S. border beyond the first week of January or comes south and eastward into the region just after the start of 2020. In the southern Hemisphere, Australia's historic December heat wave, which saw the nationwide maximum temperature average 41.9°C (107.4°F) on Wednesday crested with a national December record high temperature of 49.9°C (121.8°F) at Nullarbor earlier today. The previous December record, which was set on December 24, 1972 was 49.5°C (121.1°F) at Birdsville Police Station. At Marble Bar, the minimum temperature was 34.5°C (94.1°F). That was the second highest minimum temperature ever recorded anywhere in Australia during December. A cold front has now pushed north and east through southern Australia, breaking the extreme heat that had been baking the country since early this week. In addition, parts of central and eastern Europe experienced record warmth earlier today. At Linz, Austria, the temperature reached 63°, which surpassed the previous December record high temperature of 60°. The ENSO Region 1+2 anomaly was +0.5°C and the Region 3.4 anomaly was +0.5°C for the week centered around December 4. For the past six weeks, the ENSO Region 1+2 anomaly has averaged -0.05°C and the ENSO Region 3.4 anomaly has averaged +0.53°C. These recent conditions are consistent with a weak El Niño. Nevertheless, a neutral ENSO remains the base case for Winter 2019-20. The SOI was -8.46 today. Today, the preliminary Arctic Oscillation (AO) figure was -1.051. No significant stratospheric warming event appears likely through December 29, but some warming above 3 mb could develop near the end of the forecast period. Moderate Wave 2 activity could occur after December 20, likely leading to some upper stratospheric warming. Overall, most of the stratosphere is forecast to remain cold into the closing days of December on the EPS. On December 19, the MJO was in Phase 4 at an amplitude of 0.546 (RMM). The December 18-adjusted amplitude was 0.615. Based on sensitivity analysis applied to the latest guidance, there is an implied near 50% probability that December will wind up colder than normal in New York City. 1 Link to comment Share on other sites More sharing options...
EasternLI Posted December 21, 2019 Share Posted December 21, 2019 1 hour ago, bluewave said: That’s a really good question. It does look like the IOD helped us avoid a super amped up MJO in the Maritime Continent this month. The VP anomalies show some weaker forcing in phases 4-5 over the next 5 days. This coincides with the moderation in temperatures coming up. So it will be interesting to see what happens with the MJO as the IOD continues to weaken. This has really been an impressive +IOD event. I was looking through the fabulous JMA charts and the only one that looks similar was 1997. The super Nino. I know that they mostly coincide with El Nino, but not always. Interesting to see one so robust without an El Nino. I didn't see any other years that looked quite like this. Link to comment Share on other sites More sharing options...
MJO812 Posted December 21, 2019 Share Posted December 21, 2019 Anyone see the latest cfs for January ? Jeez, brutally cold. 1 Link to comment Share on other sites More sharing options...
David-LI Posted December 21, 2019 Share Posted December 21, 2019 When was the last year we had a decent snow on Christmas Eve/day? Link to comment Share on other sites More sharing options...
IrishRob17 Posted December 21, 2019 Share Posted December 21, 2019 4 minutes ago, David-LI said: When was the last year we had a decent snow on Christmas Eve/day? Link to comment Share on other sites More sharing options...
CIK62 Posted December 21, 2019 Share Posted December 21, 2019 The next 8 days are averaging 42degs., or about 7degs. AN. Month to date is -2.5[36.6]. Should be about +0.2[38.0] by the 29th. 27* here at 6am. 30* by 9am. 34* by Noon. 37* at 1pm. 39* by 3pm. 35* by 6pm. Christmas highs-'gift picks' are tightening: EURO 41, GFS 46, GEM 38 They agree on little happening till 12/29 --- 01/04 period. Link to comment Share on other sites More sharing options...
LibertyBell Posted December 21, 2019 Share Posted December 21, 2019 19 hours ago, CPcantmeasuresnow said: A very reasonable compromise. The under counts from years past of the big storms for Central Park are legendary and infuriating. I don't have enough time to go over all of them, and you mentioned some of the big ones, and I don't want to get all worked up this morning delving into that subject. On the positive side I think things have improved the last 4-5? years since the task has been taken from the incompetent, and I don't give a sh!t Central Park Zookeeper, to the Park Conservancy. They do seem to at least try to get accurate measurements. Many times in the past the zoo didn't even bother to measure, or just guessed and usually low as you stated. Yes, I'm trying to remember the last notable undermeasurement at NYC, and I think it was before 2009-10. Most of their measurements in this decade have been pretty good. It's the airports (aside from EWR) that seem to have bigger issues now. They still do have problems at the Park with the smaller storms, especially when the last measurement is actually during a storm and it snows for hours afterwards and you can readily tell the final total is an estimate because it ends with .0 Infuriating! Link to comment Share on other sites More sharing options...
LibertyBell Posted December 21, 2019 Share Posted December 21, 2019 10 hours ago, NorthShoreWx said: February 1961 was 17.4" at Central Park. Perhaps you meant February 1969? Yes that was the one..... looks like both were undermeasured at the Park though as both storms had totals of 20-25 inches at the local airports. Link to comment Share on other sites More sharing options...
LibertyBell Posted December 21, 2019 Share Posted December 21, 2019 On 12/20/2019 at 12:23 AM, NorthShoreWx said: Got it. I don't have anything for Oceanside, but 1/25/77 looks like a candidate. Mineola jackpot might be a clue (last column is snowfall): Bridgehampton 1977 1 25 0.27 0.5 Greenport 1977 1 25 0.2 0.6 Islip LI Macarthur AP 1977 1 25 0.09 0.5 Mineola 1977 1 25 0.1 2.6 New York JFK Intl AP 1977 1 25 0.1 1.1 New York La Guardia AP 1977 1 25 0.11 1.3 NY City Central Park 1977 1 25 0.03 0.3 Patchogue 2 N 1977 1 25 0.18 2.0 Riverhead Rsrch Farm 1977 1 25 0.14 1.5 Setauket Strong 1977 1 25 0.12 1.0 Syosset 1977 1 25 0.8 You have a data treasure trove! Any idea what years/dates two of my snowfall memories occurred in? One I know was in December, I just dont know what year....somewhere between the mid 80s and early 90s I think An arctic front passed through during the day with frequent snow showers with partly cloudy skies. At night it began to snow around 10 PM here and snowed for two hours, dropping around 2 inches. I could see the full moon through the clouds while it was snowing hard, giant flakes! I remember seeing the local news show a radar with a small band of snow right near JFK and SW Nassau. One of the other ones was a general heavy snowfall, the best one of the mid-late 80s I think...... 8.6 at NYC and also occurred in December. Ended as drizzle. Another one was during the same period, but in January, I got locked out of my house because my door was frozen lol and had to wait for my parents to get home- that one was in January. For some reason I only remember the LGA total..... 7" Another one, which I'm pretty sure happened in February, was on a front that came down was supposed to be rain changing to snow but a low stalled on the front and we had 30 hours of snowfall! That was amazing even though it was mostly wet snow during the day so didn't stick much at 33 or 34 degrees; at night it really began to pile up! The snow accumulated in a narrow band from EWR out to Long Island.... I think 4.5 inches fell at NYC but we had close to 8 inches here near JFK.... the low stalled near the Hamptons or just SE of there. No snow fell in Philly or Boston. That was actually my favorite storm pre Jan 1996! Link to comment Share on other sites More sharing options...
LibertyBell Posted December 21, 2019 Share Posted December 21, 2019 On 12/19/2019 at 5:54 PM, gravitylover said: I don't think you can put a number to it like that. IMO historic is a combination of things that combine to create a very high impact event. For instance, that May frontal passage that spawned all of those tornadoes that devastated areas around here, that March storm two years ago that knocked the power out for a week here or 4/1/97 where I got 17" in less than 3 hours and hundreds of trees came down and the streets were blocked for 2 days so that I couldn't even get out of my dead end or more than 2 blocks in any direction after me and the neighbors cut the trees out of our street. We were super hungry by the time we could get out to get food. I was walking home from school in Oceanside when that hit. Vis went from normal to 150 feet in seconds, the whole world went silent, cars started sliding off the road into front yards and it was a huge mess. If my memory is right it really only lasted about 20 minutes but we got a few inches. It was 15 years after that before I saw those kinds of snowfall rates again in Lake Tahoe where 10-12"/hr happened several times the winter I lived there and I spent 6 years in the Rockies before that and never saw more than 5-6"/hr. Wow I wish I could remember that! 2 inches of snow in 20 minutes in Oceanside?! 17 inches of snow in 3 hours in April 1997? Wow that was a big bust down here! 1 Link to comment Share on other sites More sharing options...
bluewave Posted December 21, 2019 Share Posted December 21, 2019 9 hours ago, David-LI said: When was the last year we had a decent snow on Christmas Eve/day? Most of the December snowfall in NYC since 2011 has been before the 20th like this year. After the Boxing Day Blizzard in 2010, we have had very little snowfall after the 20th. Time Series Summary for NY CITY CENTRAL PARK, NY Click column heading to sort ascending, click again to sort descending. Ending Date Total Snowfall Dec 1 to Dec 20 Missing Count 2019-12-20 2.5 0 2018-12-20 T 0 2017-12-20 7.0 0 2016-12-20 3.2 0 2015-12-20 0.0 0 2014-12-20 1.0 0 2013-12-20 8.6 0 2012-12-20 0.0 0 2011-12-20 0.0 0 Time Series Summary for NY CITY CENTRAL PARK, NY Click column heading to sort ascending, click again to sort descending. Ending Date Total Snowfall Dec 21 to Dec 31 Missing Count 2018-12-31 T 0 2017-12-31 0.7 0 2016-12-31 T 0 2015-12-31 T 0 2014-12-31 T 0 2013-12-31 T 0 2012-12-31 0.4 0 2011-12-31 0.0 0 Link to comment Share on other sites More sharing options...
MJO812 Posted December 21, 2019 Share Posted December 21, 2019 CFS has a really cold January 1 Link to comment Share on other sites More sharing options...

Recommended Posts
Create an account or sign in to comment
You need to be a member in order to leave a comment
Create an account
Sign up for a new account in our community. It's easy!
Register a new accountSign in
Already have an account? Sign in here.
Sign In Now