andyhb Posted February 9, 2013 Share Posted February 9, 2013 Decided I would create a thread specific to this considering the magnitude of this storm. Right now, I'm definitely thinking at least a high 3, possibly a 4 given the widespread 20-30+" totals, similar to Jan. 2005 and Feb. 1978. While the totals were not as extensive west of the NYC metro (NYC/N NJ still got into 10-20" totals thanks to that intense band that swept through last night), the SNE ones appear more impressive in aerial coverage than those two storms possibly, it was really a crush job for almost the entire region. Long Island totals should also magnify it. In large portions of CT, this is likely a solid second to 1888 (although there might be some competition with Jan 2011 in some areas). Link to comment Share on other sites More sharing options...
TheSnowman Posted February 9, 2013 Share Posted February 9, 2013 Agree with all. One of the Biggies. Though I have this unyielding confidence in my stomach that we will be getting another 1 of these very soon. We are not waiting 40 years for this. We aren't even waiting 8 or 5. There have been So many Historic Storms just since late 2009. We are hunting in a forest of many animals. Link to comment Share on other sites More sharing options...
powderfreak Posted February 9, 2013 Share Posted February 9, 2013 Agree with all. One of the Biggies. Though I have this unyielding confidence in my stomach that we will be getting another 1 of these very soon. We are not waiting 40 years for this. We aren't even waiting 8 or 5. There have been So many Historic Storms just since late 2009. We are hunting in a forest of many animals. Agreed. These large, anomalous, storms seem to have been popping up with increased frequency. It also seems that a lot of northeastern stations have been recording a large number of top 10 all-time snowfalls over the past 10 years. This one was bigger than January 12, 2011 but not by a huge margin in CT...Boxing Day brought 30+ inches to spots in SW CT, no? Even up here we've had two recent storms with widespread 2-3 feet (Valentines Day 2007 and March 6-7, 2011). Its nice to know that these storms seem to be cropping up with some frequency...maybe not to the full extent but I bet most folks on here see another 2-3 foot nor'easter in their lifetimes. Link to comment Share on other sites More sharing options...
Typhoon Tip Posted February 9, 2013 Share Posted February 9, 2013 Agreed. These large, anomalous, storms seem to have been popping up with increased frequency. It also seems that a lot of northeastern stations have been recording a large number of top 10 all-time snowfalls over the past 10 years. This one was bigger than January 12, 2011 but not by a huge margin in CT...Boxing Day brought 30+ inches to spots in SW CT, no? Even up here we've had two recent storms with widespread 2-3 feet (Valentines Day 2007 and March 6-7, 2011). Its nice to know that these storms seem to be cropping up with some frequency...maybe not to the full extent but I bet most folks on here see another 2-3 foot nor'easter in their lifetimes. This happened in the 1960's, 1970s, now the 2000's. The only thing common to those eras (other than PDO if so...) is the solar cycling had impressive negative phase. perhaps that's more than mere coincidence - I don't know. Link to comment Share on other sites More sharing options...
TheSnowman Posted February 11, 2013 Share Posted February 11, 2013 Paul told me this has a chance to be a Category 4, and I believe for Southern New England it will be a Category 5. No Storm was as wide spread with 20"+ in SNE. Not even 1978. 1888 and 1969 were behind that. Link to comment Share on other sites More sharing options...
TalcottWx Posted February 11, 2013 Share Posted February 11, 2013 Nesis tres Link to comment Share on other sites More sharing options...
Juliancolton Posted February 11, 2013 Share Posted February 11, 2013 Doubt it's higher than a Cat 3 due to its fairly localized aerial extent. Just shows that even the relatively new and innovative NESIS doesn't always tell the whole story sometimes. Link to comment Share on other sites More sharing options...
Chris L Posted February 11, 2013 Share Posted February 11, 2013 Paul told me this has a chance to be a Category 4, and I believe for Southern New England it will be a Category 5. No Storm was as wide spread with 20"+ in SNE. Not even 1978. 1888 and 1969 were behind that. I find that hard to believe.... Link to comment Share on other sites More sharing options...
Chris L Posted February 11, 2013 Share Posted February 11, 2013 Doubt it's higher than a Cat 3 due to its fairly localized aerial extent. Just shows that even the relatively new and innovative NESIS doesn't always tell the whole story sometimes. I agree. Cat 3 is more reasonable. Kind of like JAN 2005. Link to comment Share on other sites More sharing options...
andyhb Posted February 11, 2013 Author Share Posted February 11, 2013 I agree. Cat 3 is more reasonable. Kind of like JAN 2005. Jan 2005 was a Cat 4... Link to comment Share on other sites More sharing options...
jm1220 Posted February 11, 2013 Share Posted February 11, 2013 I'd say a 2 (high end)-obviously the New England and Long Island impacts were huge, but southwest of NYC it was a non event. Usually to be ranked a 3 or higher you at least would want more of the Northeast in on it. The Blizzard of 1978 had a far greater expanse of high totals, all the way down to S NJ and Delaware, and significant impacts all the way back into NY and PA. Link to comment Share on other sites More sharing options...
Chris L Posted February 11, 2013 Share Posted February 11, 2013 I'd say a 2 (high end)-obviously the New England and Long Island impacts were huge, but southwest of NYC it was a non event. Usually to be ranked a 3 or higher you at least would want more of the Northeast in on it. The Blizzard of 1978 had a far greater expanse of high totals, all the way down to S NJ and Delaware, and significant impacts all the way back into NY and PA. I agree 100% jm. Link to comment Share on other sites More sharing options...
tamarack Posted February 11, 2013 Share Posted February 11, 2013 Coming in late, I'll guess at NESIS score between 5 and 6, which is mid-high 3. The areal extent of 10"+ was somewhat modest while the area of 20"+ is up with some of the 4s. Missing almost everything south of NYC will hold down the rating, while the frequent spots of 30"+ add some points. (Trivia note: Just noticed that, according to the NESIS maps, the northern 1/4 of Maine is not part of the Northeast, as it is never included in the shaded area. This non-shading came to my attention when I looked at the map for April 6-7, 1982. CAR had 26.4", at that time their largest on record though now it's #3, but that part of Maine was north of the shaded area.) Link to comment Share on other sites More sharing options...
ineedsnow Posted February 11, 2013 Share Posted February 11, 2013 im going to go with a 4 just because of the major impact to major cities some towns wont be cleared out until friday!!! I honestly cant even imagine a 12 inch plus storm around here for awhile.. and to think there may be one is just hard to think about right now Link to comment Share on other sites More sharing options...
Baroclinic Zone Posted February 11, 2013 Share Posted February 11, 2013 Cat 4. Link to comment Share on other sites More sharing options...
andyhb Posted February 11, 2013 Author Share Posted February 11, 2013 Link to comment Share on other sites More sharing options...
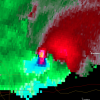
andyhb Posted February 11, 2013 Author Share Posted February 11, 2013 You can see right where that monster death band positioned itself in CT. Link to comment Share on other sites More sharing options...
gymengineer Posted February 11, 2013 Share Posted February 11, 2013 The NCDC NESIS map is not going to look like the NWS Raleigh map. Their very strict rules about what data to include (COOP and first order stations) will cause that pretty wide band of 30" to shrink into blobs and dots. Also, a lot of the posts in this thread show a lack of familiarity of what the NESIS scale is-- you can't have a "Category 5 for Southern New England." It's one value assigned based on area and total population affected by each increment of snow. Again, that area value and total population affected by 30+" snows will be lower than what people are expecting based on spotter reports. Link to comment Share on other sites More sharing options...
gymengineer Posted February 11, 2013 Share Posted February 11, 2013 Here are a couple of NESIS maps for legendary New England storms that show how strict their data input is--- not a single spot of 30+" for April Fools: Link to comment Share on other sites More sharing options...
andyhb Posted February 12, 2013 Author Share Posted February 12, 2013 Keep in mind that there were less first order and COOP stations back then (especially in 1978) to keep track of large amounts. Map of the first order and co-op stations in the Northeast. Link to comment Share on other sites More sharing options...
andyhb Posted February 12, 2013 Author Share Posted February 12, 2013 The NCDC NESIS map is not going to look like the NWS Raleigh map. Their very strict rules about what data to include (COOP and first order stations) will cause that pretty wide band of 30" to shrink into blobs and dots. Also, a lot of the posts in this thread show a lack of familiarity of what the NESIS scale is-- you can't have a "Category 5 for Southern New England." It's one value assigned based on area and total population affected by each increment of snow. Again, that area value and total population affected by 30+" snows will be lower than what people are expecting based on spotter reports. Well yes obviously... Link to comment Share on other sites More sharing options...
gymengineer Posted February 12, 2013 Share Posted February 12, 2013 Keep in mind that there were less first order and COOP stations back then (especially in 1978) to keep track of large amounts. Map of the first order and co-op stations in the Northeast. True, but posters in the NYC/NJ region definitely were "complaining" about the NESIS map for the Boxing Day storm, which of course was within the past couple of seasons. Link to comment Share on other sites More sharing options...
gymengineer Posted February 12, 2013 Share Posted February 12, 2013 Well yes obviously... *You* know that obviously, since you're familiar with the scale. Some of the other posts in here clearly show a lack of familiarity with how that single NESIS score is arrived at... Link to comment Share on other sites More sharing options...
andyhb Posted February 12, 2013 Author Share Posted February 12, 2013 1978 was a 4 in Kocin-Uccellini's study and I believe it almost certainly would be if it happened today. Link to comment Share on other sites More sharing options...
gymengineer Posted February 12, 2013 Share Posted February 12, 2013 1978 was a 4 in Kocin-Uccellini's study and I believe it almost certainly would be if it happened today. I totally agree. That was probably the most frustrating downgrade from KU's paper to NCDC taking the scale....especially since NCDC decided to include all of the upper Midwest. That 1/78 switched categories with 2/78 makes little sense for a Northeast Snowstorm scale. Link to comment Share on other sites More sharing options...
andyhb Posted February 12, 2013 Author Share Posted February 12, 2013 Lol...I'm wondering if there should be an increase in the 20-30" and 30"+ weighting (considering these amounts really tend to cripple areas even with adequate infrastructure and snow removal) on the equation to further balance smaller, yet very highly concentrated events over rather large populations (Feb 1978) and more widespread, yet less impressive totals (Jan 1978). There was a reason why 1978 was a "catastrophic and historic nor'easter" (Wiki page) and the other blizzard that is remembered from 1978 is the Cleveland Superbomb compared to the one earlier in January. Link to comment Share on other sites More sharing options...
ORH_wxman Posted February 12, 2013 Share Posted February 12, 2013 I'm guessing Cat 3...there was some decent snow in the midwest with the northern stream which will help boost it and all the first order SNE stations sans PVD had over 20". Don't think there was enough snow SW of NYC to get this to a 4 though. Link to comment Share on other sites More sharing options...
tamarack Posted February 12, 2013 Share Posted February 12, 2013 I totally agree. That was probably the most frustrating downgrade from KU's paper to NCDC taking the scale....especially since NCDC decided to include all of the upper Midwest. That 1/78 switched categories with 2/78 makes little sense for a Northeast Snowstorm scale. At least NCDC includes northern Maine. (Maybe the KU book does, too, but my download of their article, including maps, does not.) However, the map of Jan 19-21, 1978 is incorrect in showing most of N.Maine with 10-20" and even a spot of 20+. My records for Ft.Kent include 13.0" on Jan 18-19 (12.5" by my 9 PM obs time on the 18th) from an entirely different system, then 4.0" on the 21st from the northern fringe of the storm that map intends to portray. Link to comment Share on other sites More sharing options...
dan11295 Posted February 12, 2013 Share Posted February 12, 2013 NESIS number is out..4.35. Category 3. Havent seen a map yet though. Hard to get a very high number wthout greater effects on the DC-NYC corridor. and.or large areal coverage. Link to comment Share on other sites More sharing options...
tamarack Posted February 12, 2013 Share Posted February 12, 2013 Well, I busted high for sure. Wonder if the NYC metro was within or outside of the 10" contour - would make a significant difference. Link to comment Share on other sites More sharing options...

Recommended Posts
Archived
This topic is now archived and is closed to further replies.