

GaWx
-
Posts
11,362 -
Joined
Content Type
Profiles
Blogs
Forums
American Weather
Media Demo
Store
Gallery
Posts posted by GaWx
-
-
I just realized that the difference between ONI and RONI rose to a whopping 0.64C for JFM, the highest yet! Whereas ONI was +1.50, RONI was already down to +0.86. This large difference implies the importance of focusing on RONI to negate the portion of ONI that warmed strictly due to recent strong warming in the overall ocean tropics outside of Nino 3.4 as opposed to the warming related to El Niño, itself. For similar reasons using RONI would allow for the underlying intensity of the expected upcoming La Niña to be much better reflected.
RONI:
https://www.cpc.ncep.noaa.gov/data/indices/RONI.ascii.txt-
 1
1
-
-
4 hours ago, mitchnick said:
Fwiw, the April Plumes off of the SEAS5 (Euro) backed off a stronger Nina from March's plumes.
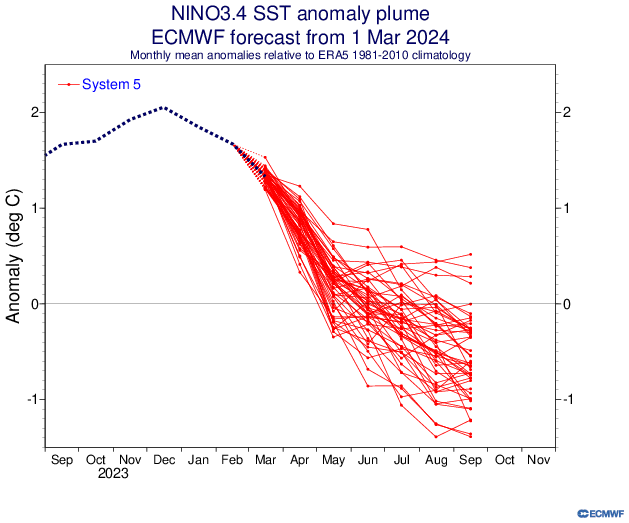
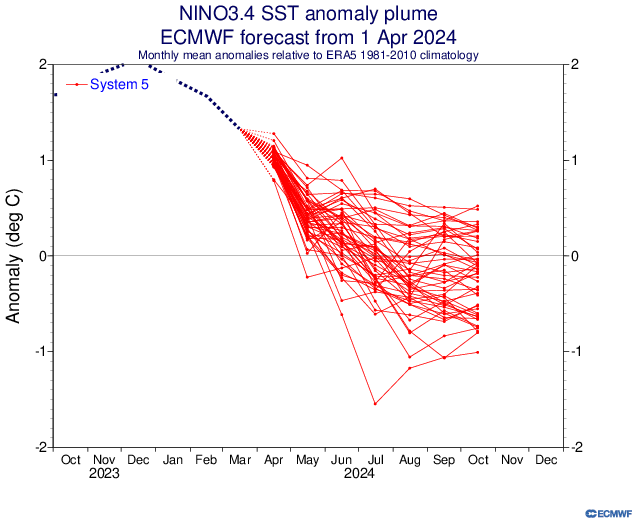
1. The Euro has a warm bias, but that is a significant warming in 3.4 vs Mar. The mean isn’t even La Niña through Oct and is already leveling off. It was already down to weak La Niña Aug/Sep in last month’s run. Taking into account its warm bias probably translates this latest forecast to weak La Niña vs moderate La Niña in prior forecast.
2. Latest BoM, similar to recent runs, is also only down to -0.1/neutral for Sep. But it was way too warm for this past fall/winter as we know though longterm average bias had been neutral before then with some years too cool and others too warm.
3. Latest Meteo-France is cold neutral for Aug/Sep though that’s actually colder than the warm neutral of the prior run for Aug. Regardless, it was way too warm for last fall/winter, almost as bad as BoM.
4. Latest JMA, which historically has averaged minimal bias, and did fairly well last fall/winter other than being too warm in its Aug 2023 forecast, has warmed from borderline weak/mod La Niña in Aug to borderline cold neutral/weak La Niña in Aug/Sep. It recently had been running too cold.
5. Latest UKMET maintains its high end moderate La Niña for Aug of its last month’s run and maintains that into Sep. It did very well last fall/winter. So, I’d give this model and the JMA a little extra attention/weight.
6. Regardless, RONI is still running quite a bit colder than ONI at last check. So, the ONI progs will need to be adjusted colder by ~0.3 to 0.5 until further notice to get implied RONI progs.
7. Putting all of this together suggests to me that the best chance for fall/winter is weak to moderate La Niña ONI and moderate to possibly strong La Niña RONI. Confidence this far out though is low, especially with last year's best two (UKMET and JMA) ~1 C apart.
8. PDO is forecasted to be solidly negative for fall/winter with marine heatwave east of Japan still there along with neutral to slightly BN off the west coast of N America. Daily WCS PDO has fallen substantially recently to ~-1, which likely translates to ~-1.75 for NOAA PDO.

-
1
-
 1
1
-
-
53 minutes ago, yotaman said:
Low of 45. Very pleasant out there today.
Another very pleasant weekend throughout the SE. I cherish these times!
-
2
-
-
Just like yesterday, the winds are gusting to over 40 at the Masters! A few balls are being blown on the greens after stopping. Sand blowing from the traps looks like mini-sandstorms!
-
5 hours ago, wncsnow said:
So you're saying a big portion of the SE could go three straight winters without any snow?
Decent chance for trace or none for big portion of non-mountainous SE as of how it looks now. But we all know how unpredictable snow is as many can easily go from no to well AN snow with one major storm. Thus, I feel more comfortable about the chances for a mild winter than chances for little or no snow in significant part of SE. Then again, the temp. fcast is far from certainty
-
I just noticed that on a RONI basis, the three dips of 2020-23 aren’t quite as similar as ONI since the three dips are -1.52, -1.24, and -1.08 (range 0.44) though 0.44 is still pretty narrow.
-
1
-
-
3 hours ago, PhiEaglesfan712 said:
I will say this, if there was one thing unprecedented about the 2020-23 La Nina, it's the fact that it maintained the same strength for all 3 years. I can see an ENSO Neutral state lasting for several years, but maintaining a la nina event at -1 to -1.2C for 3 consecutive years should seem nearly impossible. I highly doubt something like that is going to happen again in our lifetimes.
Interesting observation about all three peaks being within only 0.2C of each other. I’m having trouble even finding three consecutive neutral peaks within only a 0.2C range.
Edit: I just noticed the range is actually 0.3 (1.0 to 1.3). Regardless, your point still stands.
-
3 hours ago, gtg947h said:
We stole all your rain... our gauge said 4.36 when it was all said and done. And the back yard is flooded...
Similar here though I think I got ~1” less than you. Very windy late today and still breezy tonight. The heavy rain was more beneficial than not from my perspective though obviously the flooding wasn’t desirable and a good portion of it likely ran off. I’m thinking ahead to the prospects for drought potential with the high likelihood for an upcoming La Niña.
-
6 hours ago, bluewave said:
I didn’t say that pre-1950 ENSO data wasn’t reliable. Just that we have more complete monitoring since then. There was more missing data the further back closer to 1900 and the late 1800s. So estimates and reconstructions were employed.
I am not sure why you make such a point about the term unprecedented since it was the first such event since 1950 when we have more complete data.
Plus it seems a bit peculiar to make point about the way a word is used rather than the actual substance of the study.
Chris,
My main point is that I feel the article mentioning “unprecedented” for a triple could have been written better. It kind of sounded sensationalist to me, but that’s just my opinion. Regardless, I agree with you that the study to which it referred has some valid points. So, I’ll let this go.
-
3
-
-
6 minutes ago, bluewave said:
It was unprecedented since it’s the first satellite and modern bouy era 3 year La Nina to follow an ENSO neutral to borderline weak El Niño peaking at only +0.5 in 19-20. You will notice that the ones in the late 90s and early to mid 70s followed much stronger El Niños. The reliability of the 1908 to 1910 event isn’t as strong as the modern era since we didn’t have all the observation tools we have today.
Chris,
1. If that's what the writer meant by "unprecedented", it was poorly worded imo.
2. The paper says: “The clustering of multiyear La Niña events is phenomenal given that only ten such events have occurred since 1920,”
If the pre-satellite/modern era buoy isn't that reliable, why are they analyzing all of the way back to 1920?
-
2
-
 1
1
-
-
On 4/10/2024 at 12:48 PM, Upstate Tiger said:
Probably just click bait but at least something to read during these rainy spring days...
https://www.einpresswire.com/article/685988510/2025-winter-outlook-united-states-and-canada
2024-5 will imo likely be much colder than 2023-4 in much of Canada into the N Plains and upper Midwest (it almost has to be much colder there after last winter's record warmth, especially since La Nina is typically cool to cold there), but also warmer in the SE vs the near to slightly AN of 2023-4. It will likely also flip in the SE, too, as they will likely have the return of the dominating SE ridge thanks to La Nina and the continuing W Pac marine heatwave/-PDO. I was excited about 2023-4 potential in the SE, but not at all for 2024-5. Regardless, winter is always my favorite season as it is a near guarantee that it will be 25+ F colder than winter even down here as well as being typically the most volatile season/larger ups and downs.
-
55 minutes ago, bluewave said:
It will be interesting to see the long term increase of the WPAC warm pool leads to this becoming another multiyear La Niña event.
Multiyear La Niña events have become more common over the last 100 years, according to a new study led by University of Hawai‘i (UH) at Mānoa atmospheric scientist Bin Wang. Five out of six La Niña events since 1998 have lasted more than one year, including an unprecedented triple-year event. The study was published this week in Nature Climate Change.
This source using the word "unprecedented" for a triple year event seems overly dramatic to me as these four were triples:
- 2020-1 through 2022-3
- 1998-9 through 2000-1
- 1973-4 through 1975-6
- 1908-9 through 1910-1
https://origin.cpc.ncep.noaa.gov/products/analysis_monitoring/ensostuff/ONI_v5.php
https://www.webberweather.com/ensemble-oceanic-nino-index.html
-
1
-
-
On 4/7/2024 at 8:25 PM, Eskimo Joe said:
Aren't La Nina summers historically a higher risk for landfall along the east coast of the United States?
Interesting dichotomy when looking at # of TCs producing H force winds summer/fall somewhere VA north broken down by ENSO :
1956-2023:
La Nina: 0 storms out of 23 seasons
Neutral: 4
El Nino: 3
1851-1955:
La Nina: 12 storms during 24 seasons/9 seasons of the 24 (3 during 1954 and 2 during 1869)
Neutral: 5
El Nino: 2
1851-2023:
La Nina: 12 storms during 47 seasons/9 seasons of the 24
Neutral: 9
El Nino: 5
So, for the period 1851-1955, somewhere VA north had H winds on average once every other La Nina/during 38% of them but have had none the last 23 La Nina seasons! Also, whereas a portion of VA north during 1851-1955 had H winds on avg once every 5.5 years, that has dropped to only once every 9.5 years 1956-2023. Could climate change be playing a role or are these changes mainly due to other factors including randomness?
-
2
-
-
18 hours ago, TheClimateChanger said:
So, yes, to answer your question, I do believe the bolded statement to be true and have presented data to support it. But I should add that I was using extreme values of 105F and 110F. It is true there isn't as significant of an upward trend in hours with heat indices at or above 100F, but these are more run-of-the-mill values for Des Moines in the summertime. I will grant you that consecutive days of 100F+ can be just as dangerous, but the statement you quoted is misleading by focusing solely on consecutive stretches rather than total number of days [plus ignoring increase at higher HX values].
It also inaccurately claims that last year ended the longest stretch with no consecutive periods of 5 days or more with 100F+ heat indices at Des Moines. This is false and rebutted by the very data submitted. There are no such stretches indicated between 1936 and 1949, which is a longer period [13 years] than 2012 to 2023 [11 years].
So I would rate Kuball's statement as misleading, and the claim that last year ended the longest stretch with no 5-day plus heat waves [using consecutive days of 100F+ HX] as pants-on-fire false. The very data he submitted shows the longest stretch to have occurred from July 15, 1936 until June 30, 1949 - a period of nearly 13 years.
CCer, Now that you point it out, I agree with you that the longest stretch was, indeed, 1936-49 (13 years) vs 11 years (2012-23). Good catch. My bad for not catching that.
I hope to reply to your overall posts when I get time.
-
11 hours ago, TheClimateChanger said:
The bottom line is this: Even if daytime maxima have decreased slightly in the Corn Belt, humidity has increased substantially moreso. So cooler temperatures should not be read as milder. There has clearly been an increase in the incidence of dangerously high heat indices.
TheCCer,
Is the bolded really true?
Credit: Chris Kuball for the following Des Moines data from the heart of the Corn Belt
++++++++++++++++
“Out of those top 21 longest stretches of a 100+ Heat Index, only 5 have occurred since 2000.

It does not go back to prior to 1936 but there were several other Dust Bowl years prior to 1936 with extreme heat in IA, as well as previous decades with extreme heat.
Decade and # of times on the list
30's-1(doesn't include the very hot years 1930-35)
40s-1
50s-2
60s-1
70s-4
80s-5
90s-2
00s-1
10s-3
20s-1.
In fact, last year, 2023 getting back up there in the top 21, stopped the longest streak of NOT having a year in the top 21 (11 years from 2012-2023)."
The above doesn't suggest an increase in long dangerously high heat index streaks at Des Moines over the last few decades. If anything, there was a peak in the 70s to 80s.
So, with regard to the longest 100+ HI streaks at Des Moines, where's the beef?
-
1
-
-
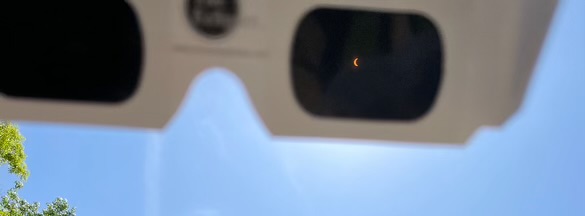
Another beautiful day, this time with a bonus of a 70% partial solar eclipse. The peak was at 3:08PM. The temp dropped ~2 F from ~2:30PM to 3:15PM (~72 to ~70) under sunny skies with the drop helped by low RH (dewpoints in 40s). The sun didn’t feel nearly as hot as normal this time of year when sunny. The temp has since risen back.
Here’s a pic of what it looked like through my eclipse glasses at 3:12PM (I got lucky to be able to get this pic because I had my phone in one hand and my glasses, which I was able to point right at the sun, in another):
-
1
-
-
The entire weekend was near perfection here. Loved every moment when outdoors!
-
2
-
-
Latest NMME has a -PDO in Dec (no surprise). I see no reason to not remain firm at least as of now on a -PDO next winter.

-
1
-
-
45 minutes ago, Rhino16 said:
Thanks. Interested to see updated numbers as the year continues.
You’re welcome.
I’d like to make one more clarification. I wasn’t trying to say they’ve ended up too bullish on average with their April forecasts overall as they, indeed, have actually averaged too bearish with them overall. It is only when they’ve been their most bullish in April that they’ve averaged too bullish.For example, I’ll look at their 29 April # of NS forecasts. Although their five most bullish April forecasts ended up 2.8 too high on average, the 29 April forecasts (which include those five very bullish forecasts) actually ended up 2.7 too low on average! Interesting dichotomy of sorts.
-
36 minutes ago, Rhino16 said:
Just to be sure, in the bold, you’re referring to the previous 5 (or other number) highest times?
Are they the same years?
In bold for seven categories I’m referring to where the respective seasons ended up on average vs the 3-6 seasons’ most active CSU April forecasts for each category. There’s lots of overlap from category to category, which is intuitive, though they’re not necessarily all the same years from category to category.
To clarify in case anyone is wondering, I do not think CSU is trying to sensationalize as I respect them for their objectivity, knowledge, analytical abilities, and clear communication showing how they get their numbers. I still think the season will be very active even if this April CSU forecast ends up being a bit too bullish.
-
1
-
-
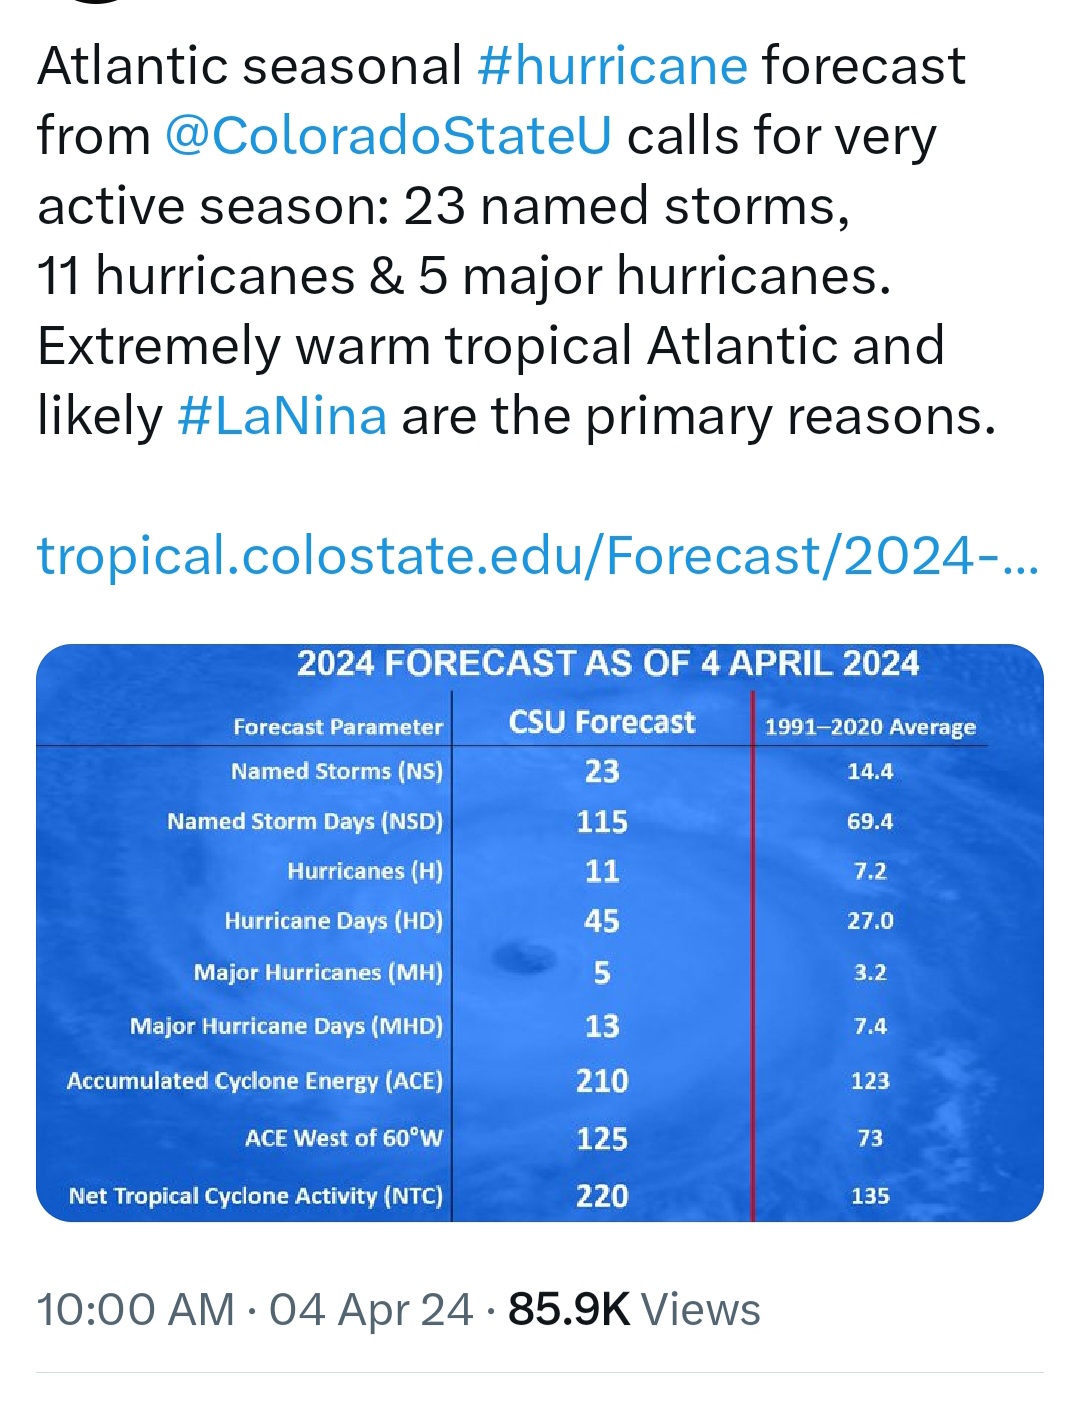
On 4/4/2024 at 12:46 PM, MJO812 said:
Very active season

There is good reason to hope that this April CSU forecast is going to end up too high based on past very active April CSU predictions. They’ve been making April predictions since 1995. I see a pretty clear pattern when they’ve gone very active in April:
1. # NS: They’re predicting 23. Prior to this the highest they predicted in April was 17-19 (five times). Four of those five progs ended up too high. For those 5, they averaged 2.8 too high.
2. NS days: They’re predicting 115. Prior to this the highest they predicted in April was 85-95 (four times). All four of those progs ended up too high. The highest actual of these four was only 58 and they averaged a whopping 40.5 too high!
3. # H: They’re predicting 11. The prior highest predicted in April was 9 (six times). All of those 6 progs ended up too high by an average of 3.
4. H days: They’re predicting 45. The prior highest progs in April were 40-45 (five times). Of these five, four progs came in too high. The five averaged a whopping 19 too high!
5. # MH: They’re predicting 5, which they’ve predicted three other times in April. All three of those progs came in too high by an average of 2.33.
6. MH days: They’re predicting 13, which is tied for the highest ever predicted in April. They’ve progged 10-13 five times. Of those five, three progs were too high. The five averaged 3.25 too high.
7. ACE: They’re predicting 210. The prior highest April progs were 160-183 (five times). Of these five, all progs ended up too high with even the closest being 34 too high! The five averaged a whopping 85.8 too high!
Conclusion: If I were a betting man, I’d short CSU’s April ‘24’s forecast overall, especially NS Days, # H, and ACE.
-
4
-
1
-
-
9 hours ago, chubbs said:
The article linked was more sanguine about CO2 effects than your write up. Not all of the greening is due to CO2 and increased greening is a mixed blessing. Your description of radiation effects isn't correct. Increased photosynthesis causes plants to absorb more sunlight, and reflect less, so greening generally causes warming. The effect is particularly large in the arctic where greening is mainly due to expansion of shrubs and trees northward. The greener surface absorbs much more sunlight than the snow or tundra surface it replaces. I believe these effects are included in models but am not familiar with the details.
Finally here's a short interview with an ag expert, who expects a negative impact from CO2 on agriculture in most areas.
Charlie,
1) This chart was posted by Chris in his thread on the Midwest warming hole: note the reduced warming or even slight cooling in much of the MW during summer vs most other areas. This is despite large increases in crop sizes.

2) From Midwest pro meteorologist Mike Maguire:“On the albedo of global greening absorbing more sunshine and warming the planet. I can debunk that myth quickly.
We know that the MOST warming is taking place in the coldest places and at the coldest times (higher latitudes during the Winter and at night).
Those are also the times when albedo from the sun has the LEAST impact.”
“The nights (with no sun) have been warming the most, days the least. Also, the driest locations with the lowest humidity are warming the most.
This is because of the radiation physics of CO2 and H2O and not albedo. In areas with the highest water vapor content, water vapor crowds out much of the CO2 absorption from the same bands of absorption. Some of the radiation absorption bands are already saturated from H2O in areas with very high dew points.
In drier areas........which includes ALL cold places, CO2 is able to absorb more long wave radiation because of the absence of H2O absorbing at the same bands.
There's no disputing this proven law of radiation physics!”
-
It has been ~tied w/‘22 & ‘23 since ~Mar 23rd.

-
Starting yesterday, absolutely awesome wx from my perspective. This will continue through the weekend.
-
1
-


Global Average Temperature 2024
in Climate Change
Posted
What, where,and when would these wx impacts be? How significant would they be in relation to other factors? Also, keep in mind that the magnitude, scope, and timing of the effects of the 2022 Hunga Tonga volcano on the globe's wx are still being sorted out/debated. Several studies I've seen suggest that's its strongest effects may not be over for a good number of years (rest of the decade) with the most significant possibly still ahead due to a significant increase in water vapor that rose into the stratosphere. It is all very complex!