

coastalplainsnowman
-
Posts
590 -
Joined
-
Last visited
Content Type
Profiles
Blogs
Forums
American Weather
Media Demo
Store
Gallery
Posts posted by coastalplainsnowman
-
-
1 hour ago, JustinRP37 said:
Weird how in winter the models always correct warmer as we get closer to a date and in April they always correct cooler and wetter for the past many years now. I’ll die on the hill that April is our worst weather month.
I think the problem with April is that while warmer than March overall, our expectations are higher for April than for March. I also think that the earlier start to daylight savings puts us mentally in Spring mode sooner than we should be. Anyone with kids in outdoor sports knows that we all freeze our a**es off from March until some point in May, when suddenly a switch is flipped and it's tolerable for a week before oppressive heat kicks in that no one is prepared for.
-
 5
5
-
-
36 minutes ago, forkyfork said:
that was amazing
40 minutes ago, BxEngine said:Absolutely unreal. Amazing experience….now i get why they say 99% vs 100% is basically not seeing it vs seeing it.
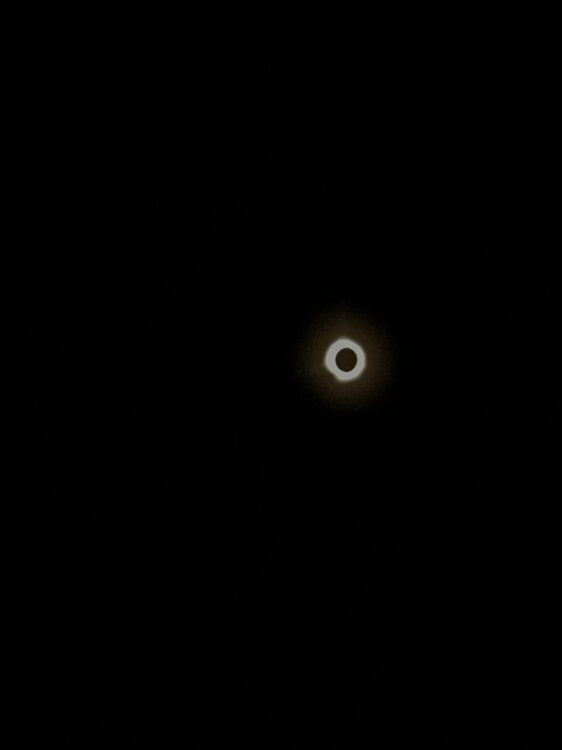
Did you get that 'flash' that apparently sometimes happens just before totality, as the mountains areas on the moon's surface first obscure the sun? From some videos I caught today that looks awesome.
-
1
-
-
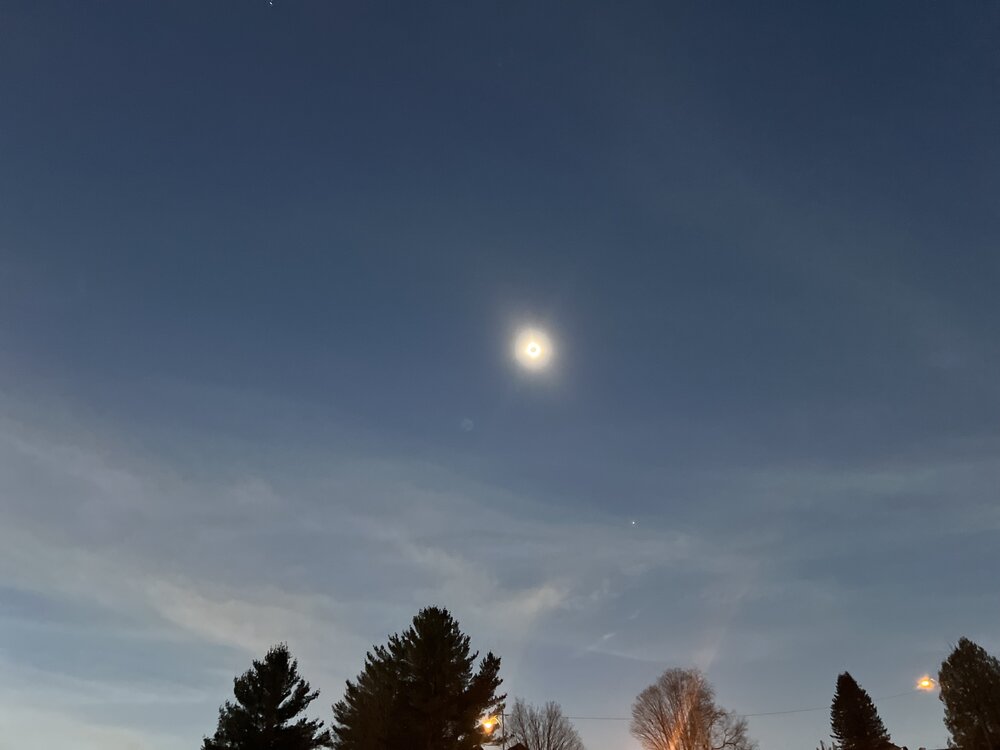
2 minutes ago, psv88 said:
Looks like evening at 3:30 in the afternoon and temp is dropping with full sun. Very cool to look at with the glasses
Oh yeah no doubt it was fun to see through the glasses. What's scary is that as the 2017 one was ending we were talking about this 2024 one and it feels like it got here in five minutes. Scary.
-
1
-
-
It's amazing that even with the sun blocked 89% here on LI, if no one told me there was an eclipse would I even notice? Maybe I might think things seemed a little off, but I doubt it. Hoping some of the folks who travelled to where there was totality will share some picks once all is said and done!
-
14 minutes ago, TriPol said:
The next time a solar eclipse will be visible in New Jersey or NYC will be 2079. Get out there and enjoy it!
Yeah but Accuweather's 20,089-Day ForecastTM has my area at 80% cloud cover for the 2079 eclipse, so I'm definitely not missing today's event.
-
 2
2
-
-
21 minutes ago, donsutherland1 said:
Unfortunately, the paper from which I got the earlier figures didn't provide technical information about how the measurements were made.
Thanks for checking. I just found this usgs link. It doesn't say too much on the specific topic, but it references other links that look interesting too that I'm going to check out. Sharing here in case of interest to anyone..
-
1
-
-
5 hours ago, donsutherland1 said:
Updated list of 4.0 Earthquakes, assuming the current 4.0 rating holds. Today would be the first date on which there were two such earthquakes in the NYC area.
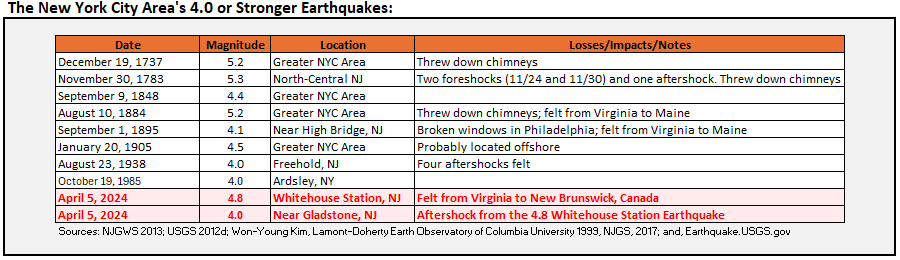
Thanks for this Don. When I first read this I thought how in the world can anything close to an estimation as precise as 5.2 be made for an earthquake which took place nearly 300 years ago. But then I was shocked to learn (yes, on Wikipedia) that the first seismograph/seismometer was made in the 2nd century.
Don, just curious, would you happen to know if those magnitude numbers from the 1700s above are based on measurements from devices measuring wave amplitude? I get that Richter's scale came many years later, and I assume that if readings were actually taken at the time of the events, that they could be plugged into his formula later. But is that the case here or are these estimates from the 1700s arrived at by other means?
-
4 minutes ago, ag3 said:
I hope these aren’t foreshocks.Halfway around the world in India, where I have some coworkers, they had a 5.3 90 minutes before ours. That seemed interesting, but I don't know if scientifically it really is interesting.
-
1
-
-
Honest question - is there anything in a meteorologist's training that would make them particularly knowledgable about earthquakes? I ask because most of the on air folks I'm watching today seem to be struggling. Granted, they're being asked to make a story out of something which, other than some shaking and the novelty of it, is a not much of a story, but some of it is frankly tough to watch.
-
1
-
-
16 minutes ago, bluewave said:
3 top 10 lowest snowfall seasons during the 2020s so far. Their new average for the 2020s so far is only 26.1 which is similar to what NYC averaged during earlier decades. So about 50% of what they averaged during the 2010s. Boston had 100” in only 39 days back in 2015. That 39 day total is higher than their total snowfall since January 2021 to March 2024.
Time Series Summary for Boston Area, MA (ThreadEx)
Click column heading to sort ascending, click again to sort descending.RankEnding DateTotal Snowfall Oct 1 to May 31Missing Count1 1937-05-31 9.0 0 2 2012-05-31 9.3 0 3 2024-05-31 9.7 59 4 1973-05-31 10.3 0 5 2023-05-31 12.4 0 6 1980-05-31 12.7 0 7 1995-05-31 14.9 0 8 2002-05-31 15.1 0 9 1989-05-31 15.5 0 10 2020-05-31 15.8 0
Monthly Total Snowfall for Boston Area, MA (ThreadEx)
Click column heading to sort ascending, click again to sort descending.YearOctNovDecJanFebMarAprMaySeasonMean 0.9 T 5.2 12.2 7.0 0.6 0.2 T 26.1 2023-2024 0.0 T 0.2 9.0 0.5 T 0.0 M 9.7 2022-2023 0.0 T 1.0 6.9 3.6 0.9 0.0 0.0 12.4 2021-2022 0.0 T 0.4 36.2 15.3 2.1 T 0.0 54.0 2020-2021 4.3 T 13.0 5.8 15.3 0.1 0.1 0.0 38.6 2019-2020 0.0 T 11.5 3.1 0.5 T 0.7 T 15.8
Monthly Total Snowfall for Boston Area, MA (ThreadEx)
Click column heading to sort ascending, click again to sort descending.YearOctNovDecJanFebMarAprMaySeasonMean 0.1 0.3 6.9 15.8 20.5 8.5 1.0 0.0 53.0 2018-2019 0.0 0.1 0.1 2.1 11.6 13.5 T 0.0 27.4 2017-2018 0.0 T 9.2 17.8 8.3 23.3 1.3 0.0 59.9 2016-2017 0.0 T 5.9 8.9 21.5 10.1 1.2 0.0 47.6 2015-2016 T 0.0 0.9 9.5 15.0 4.1 6.6 0.0 36.1 2014-2015 0.0 2.6 0.3 34.3 64.8 8.6 T 0.0 110.6 2013-2014 0.0 T 11.7 21.8 22.9 2.2 0.3 0.0 58.9 2012-2013 0.0 0.4 3.4 5.0 34.0 20.6 T 0.0 63.4 2011-2012 1.0 T T 6.8 0.9 0.6 0.0 0.0 9.3 2010-2011 0.0 T 22.0 38.3 18.5 1.3 0.9 0.0 81.0 2009-2010 0.1 0.0 15.2 13.2 7.0 0.2 0.0 0.0 35.7
Maximum 39-Day Total Snowfall
for Boston Area, MA (ThreadEx)
Click column heading to sort ascending, click again to sort descending.RankValueEnding DateMissing Days1 100.2 2015-03-03 0 This post reminds me of when I see the Yankees doing bad in the standings and am relieved to see the Redsox doing poorly too.
-
1
-
-
For a short time, definitely a teeny tiny frozen center in the precip pelting my windshield about 45 min ago.
-
2 hours ago, IrishRob17 said:

Anyone have any idea why a map like this leaves out an area where 8.5 million people live (i.e. counties of Hudson, Richmond, Kings, Queens, Nassau, Suffolk?)
-
Hi all - I'm usually in the NYC Metro boards watching for snow. I was hoping to please get some insights on something I read today.
I read a tweet from someone named Chris Martz who stated the following: "In 2009, experts told CBS News that the Arctic will be ice-free within 10-years' time. As of yesterday, there is more sea ice in the Arctic than there was when this prediction was made, and it has been tracking higher than 2005 just about every day this year."
It seems like I'm always hearing totally divergent things about the level of Arctic sea ice - that it's at record lows, that it's above normal, etc. The tweet above is just the latest example.
Why is there always (or seems to be always) such a wide range of news regarding Arctic sea ice, and how does it actually look currently compared to say 10, 25, 50 years ago?
Thanks in advance..
-
6 hours ago, bluewave said:
Too bad the phase wasn’t a little further southeast allowing a benchmark track instead.
"And coming up next, the forecast where we put the maps in motion.." This brings me right back. The 90's maps were a slightly polished upgrade over the maps of the 80s.
-
10 minutes ago, SACRUS said:
superstorm '1993
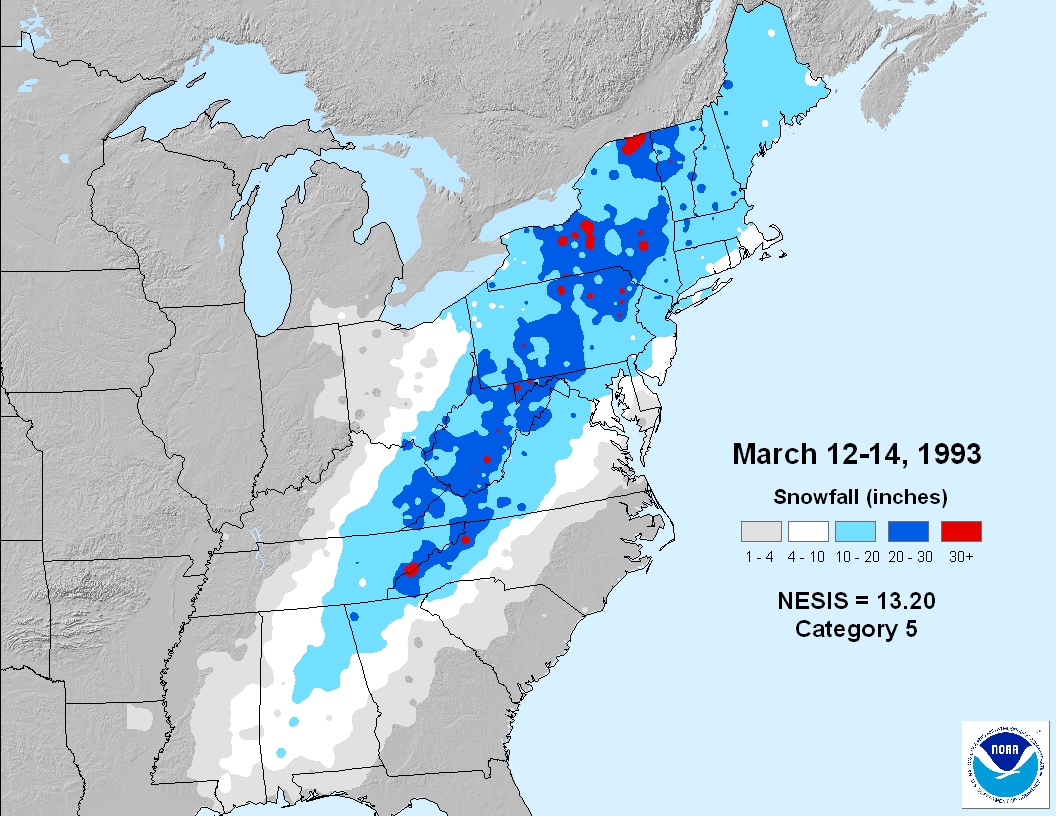
Long islanders, when I see this map all I can think is that Nassau/ Suffolk are overdone. I know that by me we were over to rain by at most 6”. I wouldn’t have thought that east of me would’ve been any better, but I maybe I’m misremembering.
-
13 hours ago, donsutherland1 said:
White forsythia are now coming into bloom at the New York Botanical Garden.

Thanks for sharing, Don. I assume the blooms you have been photographing are ahead of schedule. Any idea by about how far ahead? Thanks.
-
9 hours ago, Intensewind002 said:
It’s wild how badly people drive when the weather is crappy. It’s like no rules of the road even apply anymore
It brings out two types of drivers. Drivers who think that larger top heavy vehicles should be driven faster than usual in rainy conditions, and drivers who think they should drive 25 in a 55.
On the other hand I'm reminded of / humbled by George Carlin's line: "Have you ever noticed that everyone who drives slower than you is an idiot, and everyone who drives faster than you is a maniac?"
-
1
-
4
-
-
15 minutes ago, Yanksfan said:
Hate to be callous but if it refuses to snow then bring on the destruction of a cat 3 tropical cyclone instead.
The word you're searching for isn't 'callous.' It's something else. Why not go all in and ask for a cat 5? Oh wait, that would be ridiculous.
-
1
-
-
3 hours ago, LongBeachSurfFreak said:
Long Island about to get smoked
The saddest thing is that it’s only early March and yet there’s not even the opportunity to think “maybe this next storm could be snow,”. It might as well be June. It’s like the very concept of snow has been memory-holed, a month earlier than usual.
-
1 minute ago, MJO812 said:
This is still in the long range
To paraphrase a famous economist: In the long range, we are all warm.
-
2 hours ago, bluewave said:
We came close back in 2022. But notice all the 40 day years recently reaching 90°. 2011 and 2012 had a much lower number of 90° days. But noteworthy shorter record heatwaves centered in July.
Time Series Summary for NEWARK LIBERTY INTL AP, NJ - Jan through Dec
Click column heading to sort ascending, click again to sort descending.RankYearNumber of Days Max Temperature >= 90Missing Count1 2010 54 0 2 2022 49 0 - 1993 49 0 3 1988 43 0 4 2021 41 0 - 2002 41 0 - 1991 41 0 5 2016 40 0 - 1983 40 0 - 1959 40 0 6 1994 39 0 - 1944 39 0 7 2005 37 0 - 1987 37 0 8 2018 36 0 - 1949 36 0 9 2015 35 0 10 1961 34 0 11 2012 33 0 - 1999 33 0 - 1995 33 0 - 1966 33 0 12 1955 32 0 - 1953 32 0 - 1943 32 0 13 2020 31 0 - 2011 31 0 - 1973 31 0 - 1952 31 0 What's wild about 2010 having 54 90 degree days is the fact that that year was bookended by a lot of snow. Didn't Newark hit 106 that summer? That was the year with the brutal soaking and windy March storm which uprooted as many trees as a hurricane. All followed by 2011 and 2012 with Irene, the earthquake, and capped off by Sandy, itself ending with a significant early November snow. We lived in interesting weather times.
-
 1
1
-
-
11 minutes ago, psv88 said:
KFRG is a pretty urban site. Barely radiates so it’s not really representative of much of the island.
I mention that one because it's the closest one to me. It was notable to me how much bang for the buck we got, snowcover-wise, out of the two little storms we got this year. Especially that first one, snow hung around longer than some much larger storms we've had in the past. We didn't have too much crazy warmth, snow-eating fog, etc.
-
10 minutes ago, psv88 said:
Still some patches of snow in the yard. Snow hung around for a solid 10 days. Not bad
If there was a stat for 'average sporadic snowcover' or something like that, I wonder where this winter would rank on LI. It might be as high as 'only' 25th worst by such a measurement.
On that note, any idea where it stands with regard to the official snowcover statistic at say KFRG? I'm not familiar with where to find that.
-
4 hours ago, JustinRP37 said:
You are in the island. Winter has sucked there for sure this year. But the last week and this week have been great up here. Snow was amazing at Catamount last weekend and in the Catskills. It has been a tough winter but compared to this time last year I’ll take it. Last year many areas never got close to 100% open in snowmaking trails. Has it been an amazing winter no, but at least this past week and this week have been good.
I think the difference is that Patterson's annual snowfall is 150-200% of Commack's average.
In a place that averages 50+" a year, a 60% of normal year still looks and feels wintry.
In a place that averages half that, like much of LI, a 60% of normal year looks like a brown winter with a few sporadic barely plowable events.
60^ of Patterson's snowfall is a darn solid winter on LI.
-
1
-


April 2024
in New York City Metro
Posted
I totally agree. I already mourn for when it will be over. Hands down, I'll take standing out there watching in 40s with rain and wind over 70s with blue skies but no more games left to watch..