djr5001
-
Posts
1,922 -
Joined
-
Last visited
Content Type
Profiles
Blogs
Forums
American Weather
Media Demo
Store
Gallery
Everything posted by djr5001
-
Central PA - Jan/Feb 2019 Obs and Discussion
djr5001 replied to MAG5035's topic in Upstate New York/Pennsylvania
I honestly think it may depend on how fast the river freezes over. Not completely frozen based on it being currently a little elevated (~ 10 feet at the Harrisburg gauge and slowly falling) with wind out of west/northwest I bet it gets held up a few degrees above just because of location of equipment. -
Central PA - Jan/Feb 2019 Obs and Discussion
djr5001 replied to MAG5035's topic in Upstate New York/Pennsylvania
Seems to me like the main differences in runs/output is dependent on how much the frontal wave interacts with the front in our region and whether or not the areas in the WWA zone get that brief period of higher intensity tomorrow afternoon (12z Euro) or not (12&18z HRRR/NAM). Its early, but interaction doesn't look to be off to a great start across the south. If the frontal wave ends up east of the models at all I can see how Harrisburg struggles to reach even an inch. The NAM snowmaps seem to play up accumulating snow during the morning hours more than what most other models indicate may occur. -
Central PA - Jan/Feb 2019 Obs and Discussion
djr5001 replied to MAG5035's topic in Upstate New York/Pennsylvania
Ugh can't believe I missed the Harrisburg data rabbit hole the last few days lol!! @Jns2183 I have a number of files that I have managed to pull together with Harrisburg's records dating back to 1888. Unfortunately I am blocked here at work from being able to upload anything to something like google docs to share anything that I have but I will try to see if I can figure something out. Like you had noted - there have been a number of location changes for Harrisburg where daily observations have occurred but I believe Harrisburg's official record dates back to 1888. I worked through the data and have managed to find what I believe are the transition dates for each site based on what NWS State College has used for daily/monthly/seasonal records for temperatures and or precipitation. My go to sites are through NCDC. Through this first link (not just for Harrisburg) there are a good number of archived data files for both airports as well as COOP and other stations. Only issue is that I don't know what data is and isn't available there to everyone as I have access to it. https://www.ncdc.noaa.gov/IPS/ This second link below is likely a better resource as it allows downloads of significant amounts of data for stations. I have .PDF files with the daily summaries for each month for MDT, Capital City, and earlier but need to see if I can recall the steps I used to request this data. Same thing can be done for almost any available station so if someone is looking for data for somewhere not Harrisburg this may be a good resource too. https://www.ncdc.noaa.gov/cdo-web/ While this may be a great resource - I have found occasional errors in the data that do not match up with other historical publications (likely occurring in the process of scanning the old files) so beware of occasional errors/discrepancies. -
Central PA - Jan/Feb 2019 Obs and Discussion
djr5001 replied to MAG5035's topic in Upstate New York/Pennsylvania
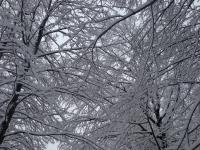
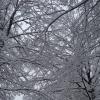
Great cold air for good pictures if you can brave the elements lol -
Central PA - Jan/Feb 2019 Obs and Discussion
djr5001 replied to MAG5035's topic in Upstate New York/Pennsylvania
There is a good bit of ground water coming up and flowing across the road in the area further down from me that is likely going to be an issue later tonight -
Central PA - Jan/Feb 2019 Obs and Discussion
djr5001 replied to MAG5035's topic in Upstate New York/Pennsylvania
Highest I saw after the changeover was 3.8” here (west shore Harrisburg - north Enola) but it is 36 and still raining so that is already compacted down to just below 3”. At this rate I may not even need to shovel in the morning. Temps are now into the 50s in WV and southern MD/VA at almost 1am in January and if this low continues to track to our west overnight we may end up in the 40s across southern PA by sunrise. -
Central PA - Jan/Feb 2019 Obs and Discussion
djr5001 replied to MAG5035's topic in Upstate New York/Pennsylvania
Nice! Mixing line looks to be just south of you. -
Central PA - Jan/Feb 2019 Obs and Discussion
djr5001 replied to MAG5035's topic in Upstate New York/Pennsylvania
Just saw an 8” report pop up for Upper Strasburg - Franklin Co from a trained spotter. Newville has to be close to that too. -
Central PA - Jan/Feb 2019 Obs and Discussion
djr5001 replied to MAG5035's topic in Upstate New York/Pennsylvania
3.6” as of 9PM for me and yes its now a mix of sleet and huge flakes -
Central PA - Jan/Feb 2019 Obs and Discussion
djr5001 replied to MAG5035's topic in Upstate New York/Pennsylvania
Just hit 2” mark at 8pm with outdoor sensor back up to 33F (West shore Harrisburg - North end of Enola) -
Central PA - Jan/Feb 2019 Obs and Discussion
djr5001 replied to MAG5035's topic in Upstate New York/Pennsylvania
That initial push looks to be on the edge of where the heavier bursts have started. Heavier rates have helped to hold off the mixing but that secondary surge is now pushing into the Mason-Dixon Line. Curious to see if anyone close to the edge of the mountains like you/cashtown/Carlisle can hold on longer than some of rest of us as areas east begin to mix. -
Central PA - Jan/Feb 2019 Obs and Discussion
djr5001 replied to MAG5035's topic in Upstate New York/Pennsylvania
https://www.spc.noaa.gov/products/md/2019/md0032.html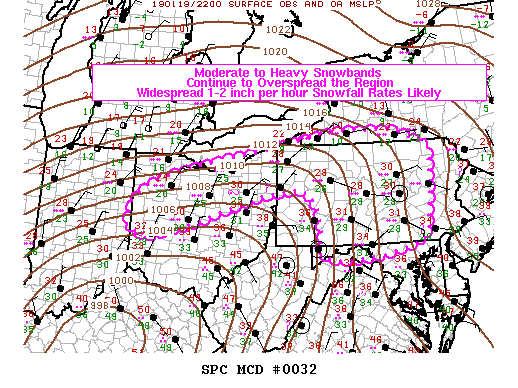
-
Central PA - Jan/Feb 2019 Obs and Discussion
djr5001 replied to MAG5035's topic in Upstate New York/Pennsylvania
Changeover should be starting just north of Mason-Dixon and east of I-81 -
Central PA - Jan/Feb 2019 Obs and Discussion
djr5001 replied to MAG5035's topic in Upstate New York/Pennsylvania
Yea and I think we will still get a few hours of good snow before mixing issues but at that point even 2-4” around I-81 corridor and 1-2” closer to turnpike without significant ice issues looking like they will be a factor anymore it will be below warning criteria. -
Central PA - Jan/Feb 2019 Obs and Discussion
djr5001 replied to MAG5035's topic in Upstate New York/Pennsylvania
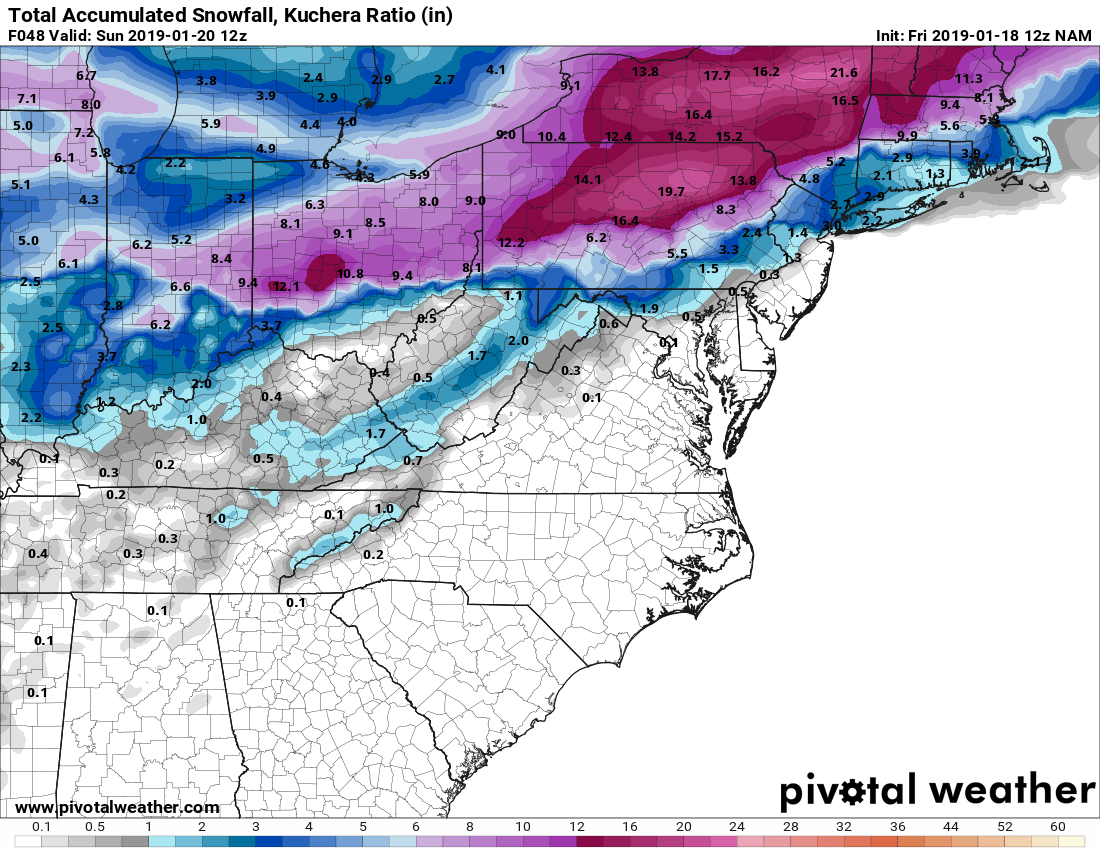
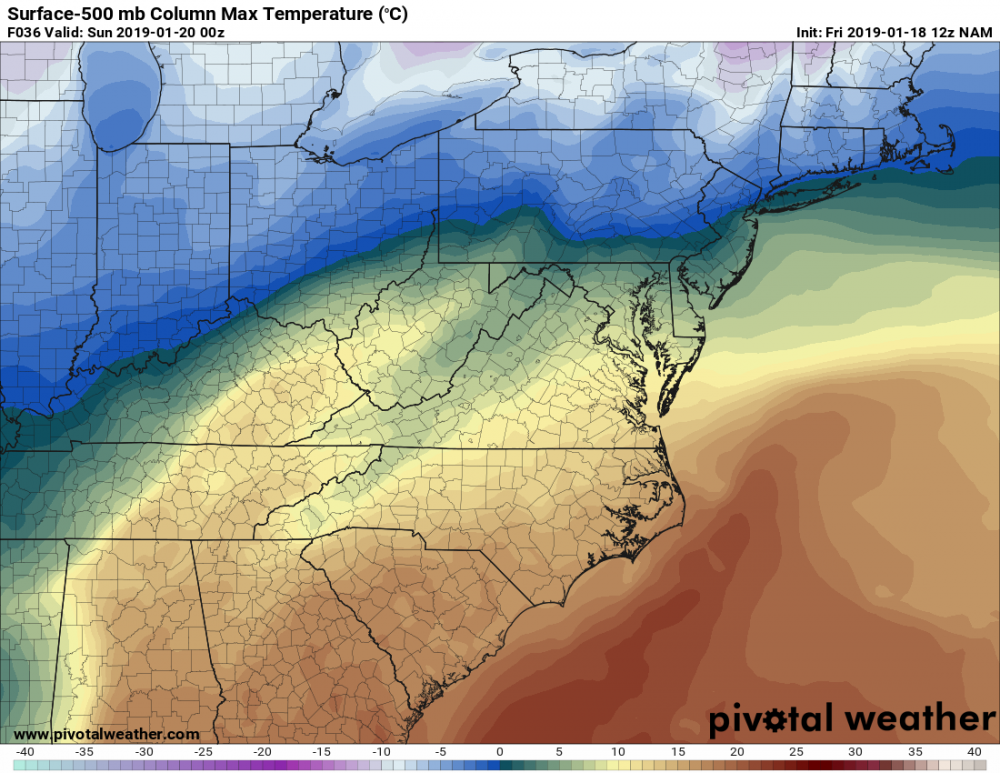
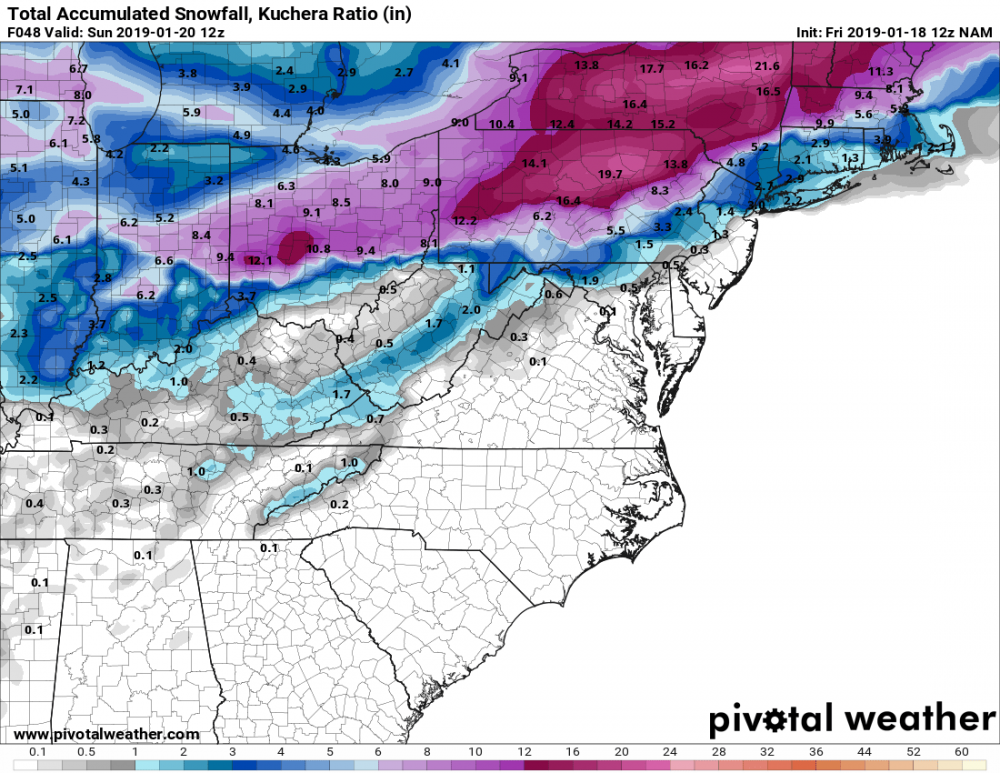
Dew point temps at the surface are not going to be what the issue is - it’s going to be the upper air temps by the time the main precipitation actually arrives. The 10:1 maps are printing out snow totals for the area that they just dropped the warning for that are several inches higher than how things are looking like they will play out (12z Euro Kutchera has MDT at 1” snow total for example). What was supposed to be the front end thump for LSV has ended up further away from the low and is well north than what models were showing prior to this morning. What was supposed to be the start of heavy snow around here by 2-3 pm models like HRRR runs today don’t have arriving until 7-8pm with warm air aloft right on the doorstep. -
Central PA - Jan/Feb 2019 Obs and Discussion
djr5001 replied to MAG5035's topic in Upstate New York/Pennsylvania
https://www.spc.noaa.gov/sfctest/new/viewsector.php?sector=17# Under surface there is a 2-hour pressure change map -
Yea all morning upper air data is not a good look for southern PA outside of the mountains. I’m not even sure Harrisburg gets to 4” based on how things currently look because even with snow falling before changeover temps may not be able to fall to 32 or below at surface.
-
Sorry just saw this - one free site I use is http://www.pivotalweather.com/model.php?rh=2019011900&fh=0&dpdt=&mc=&r=us_ma&p=sfct&m=hrrr
-
Since short term models are getting close to their ranges - just a reminder that HRRR does run out to 36 hours for the 0/6/12/18z runs so today's 18z run has an interesting look to it despite only running out to 6z Sunday.
-
I don't pay attention to these maps regularly to know patterns/etc but interesting to note how much of Texas just east of our system currently and east PA/MD/VA GFS is busting too warm at the surface today from the 12z run just a few hours ago.
-
Winter Storm Warnings have been issued. Interesting to me that Harrisburg/Hershey/Lebanon/Carlisle are still grouped with Somerset/Bedford with 6-10" snow and sleet now with up to .2" ice. York/Lancaster 3-6" snow and sleet with up to .2" ice.
-
My plan is to try and time it right and do a round of clearing I would say late afternoon/early evening after the first few inches so that some additional snow falls before a changeover then don't touch it until ending on Sunday. That way its not a full water logged and frozen heavy mess to try and shovel and its also not just ice that will be nearly impossible to use salt on Sunday once the arctic air starts to arrive and temps drop.
-
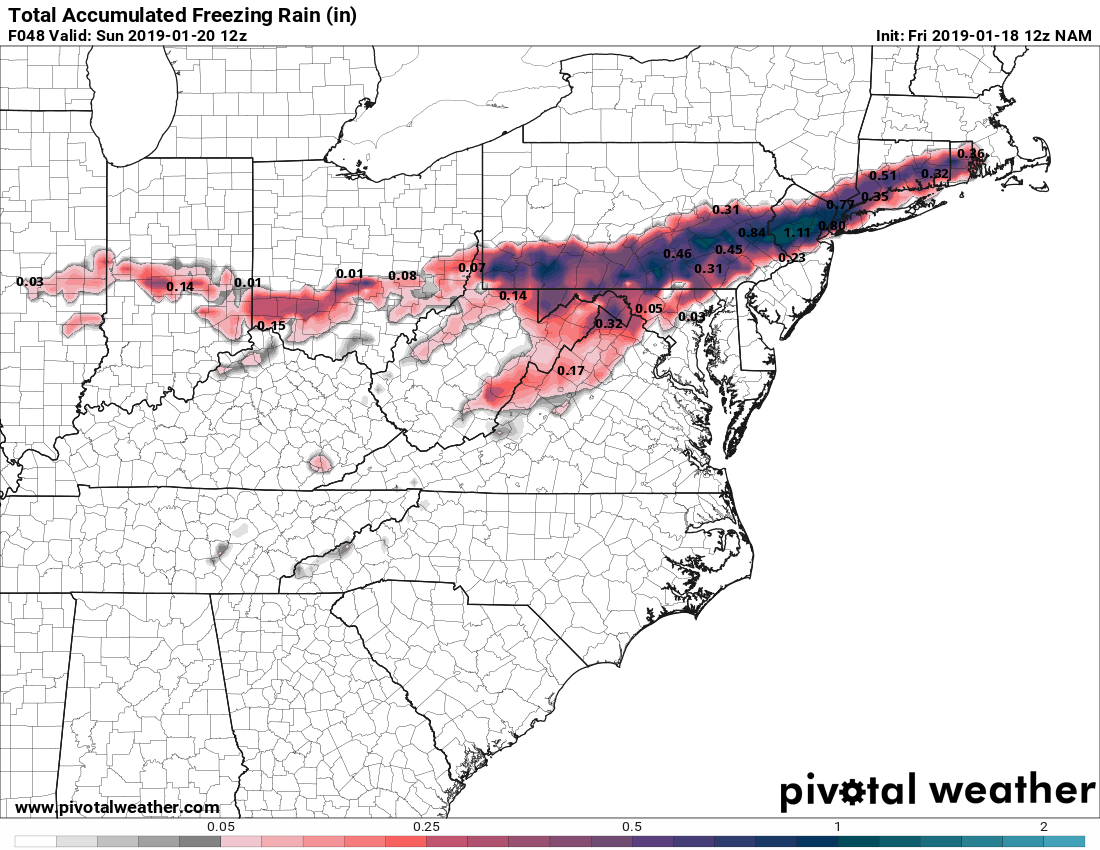
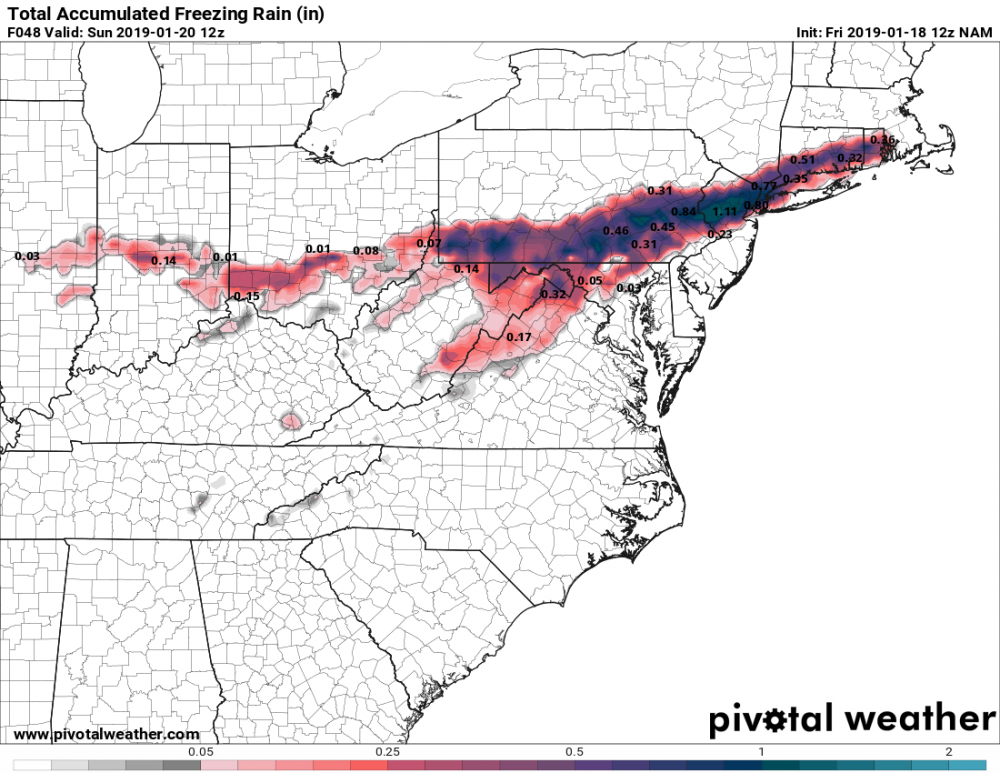
That TT 10:1 map looks a little off to me as I don't see anything that supports it printing totals that high across southern tier of LSV even if there ends up being sleet involved. Kuchera and Ferrier (available with 3km NAM on TT) are significantly lower with totals across that area. Soundings have York to Lancaster corridor as freezing rain by 8pm tomorrow night. I have long thought that the TT 10:1 map factors in surface temp in calculating snow totals, have been told that is not the case, but once again it is printing large snow amounts when surface temp is at or below freezing and upper air temps are above 0C. Front end thump is going to be nice but sure looks to get messy after that because I just don't see the cold air at the surface warming all that quickly to above freezing if even at all (especially around I-81 stretch from Carlisle to east of Harrisburg). Last image = major yuck
-
12z Euro pushes the warm air aloft further north than the 0z run so LSV gets quite warm (nearly eliminates ice accumulation potential here). Storm also moves through quicker so QPF numbers are less as well.
-
Just my gut feeling on this and I don't have any particular forecast in mind from anyone to target but I think the precipitable water anomaly (>+2 standard deviations) wasn't factored in enough for some forecasts based on predicted accumulation numbers and rainfall amounts. The models were spitting out ~1.5" QPF for much of the mid-state. Anomalously high moisture content (combined with the other dynamics) seemed to help allow rates to stay heavy for hours, keeping the column cool enough to stay snow longer than allow for an earlier changeover. I melted to 1.62" liquid which is insane around here when winter weather is involved. We don't typically see PWAT values over 1" during Dec-Jan-Feb and when we do early or late season with just enough cold air we seem to see large snow totals. I don't know what PWAT values were (I wonder if I can find this info archived somewhere) for October 2011 storm but liquid amount from that event was 1.39" with 5.5" snow at MDT.