

michsnowfreak
-
Posts
15,693 -
Joined
-
Last visited
Content Type
Profiles
Blogs
Forums
American Weather
Media Demo
Store
Gallery
Posts posted by michsnowfreak
-
-
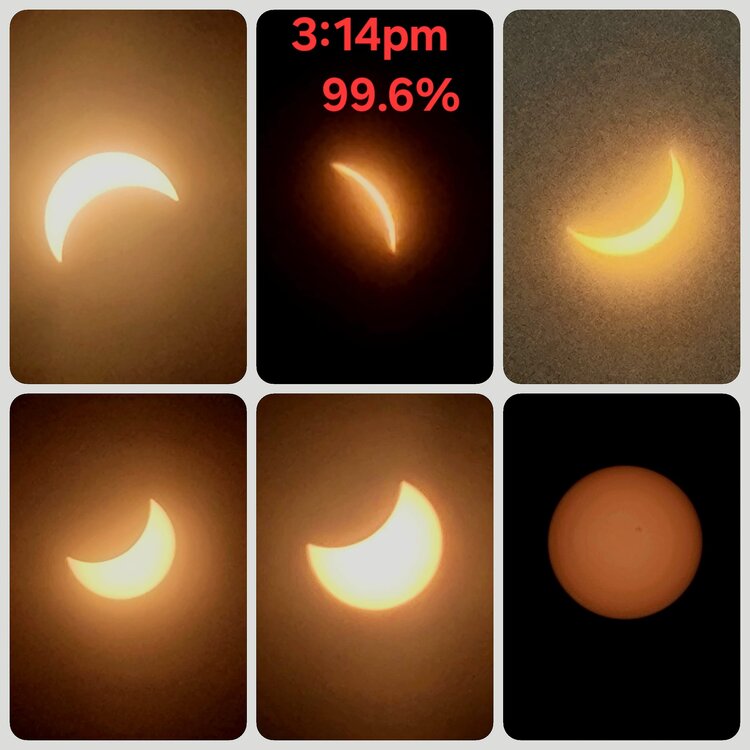
I just stayed home for the eclipse. 99.6% totality imby. It was really neat to watch. Totality would have been awesome, but still, no regrets, and i dealt with no traffic into Ohio lol.
-
 5
5
-
-
2 hours ago, mississaugasnow said:
Pretty bad. As @Snowstormsmentioned 7th least since 1840. Which to me is worthy of futility discussion lol
Yeah, that's definitely futility. This season, Detroit ranks 18th least since 1880.
-
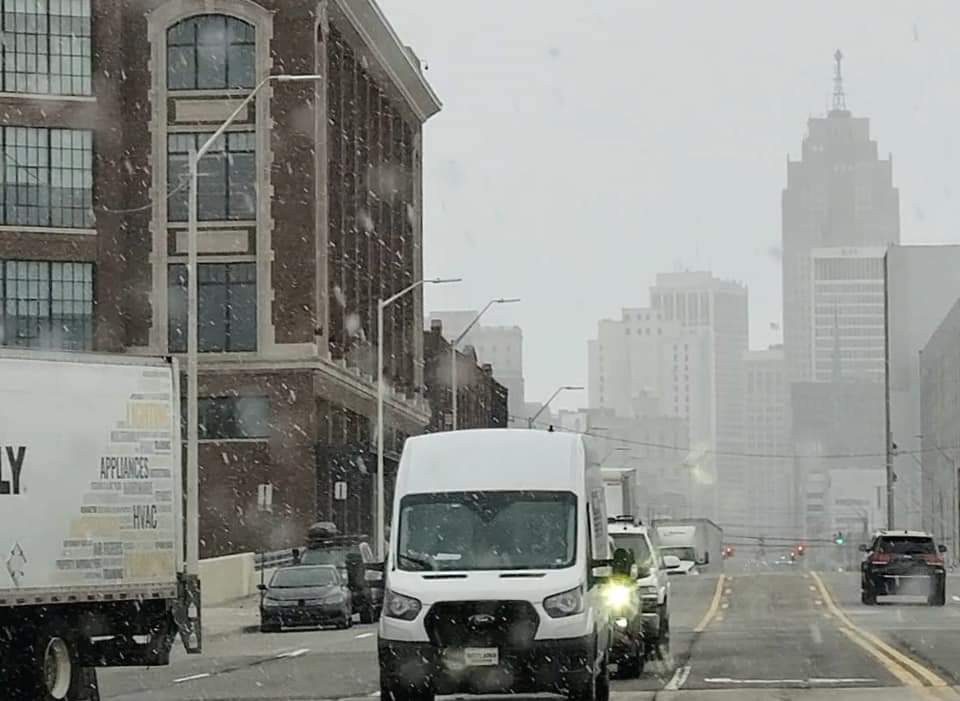
Off and on snow showers today, Detroit Tigers Opening day. It honestly seems like it snows every other year on opening day.
-
2
-
-
8 hours ago, mississaugasnow said:
@Snowstorms @michsnowfreak Even with that big push in late March YYZ is still at 6th least snowiest season on record at the airport. I don't know about you guys but to me thats going in the futile pile. 6th place has a cushion of about 2" before this winter would slip to 7th.
Where does this season rank in Torontos entire period of record?
-
Had a heavy grauple and sleet shower this afternoon that whitened the ground briefly, 0.1", however, it melted quickly. Popcorn showers dotted the area today
-
11 hours ago, weatherbo said:

What was your deepest snow this season?
-
15 minutes ago, weatherbo said:
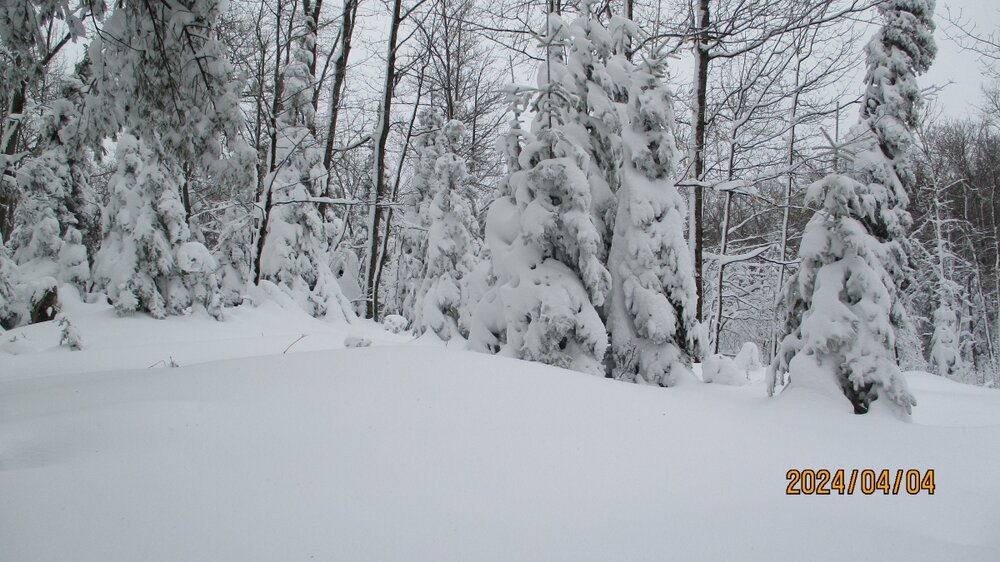
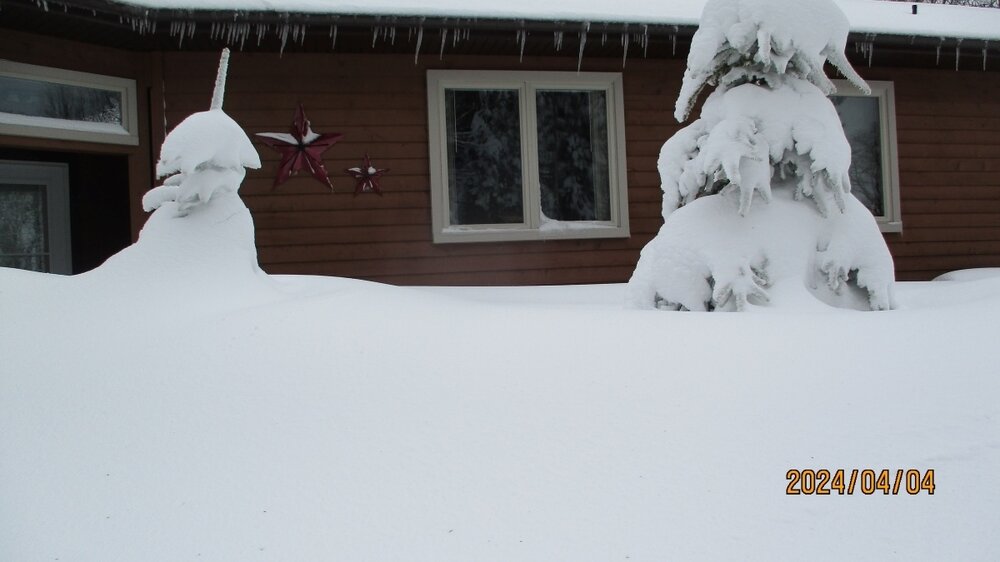
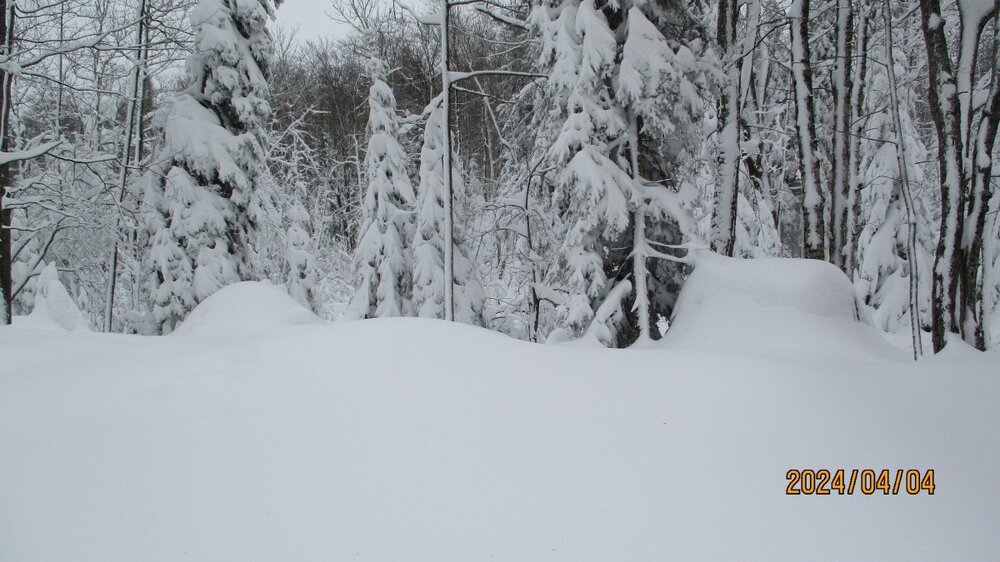
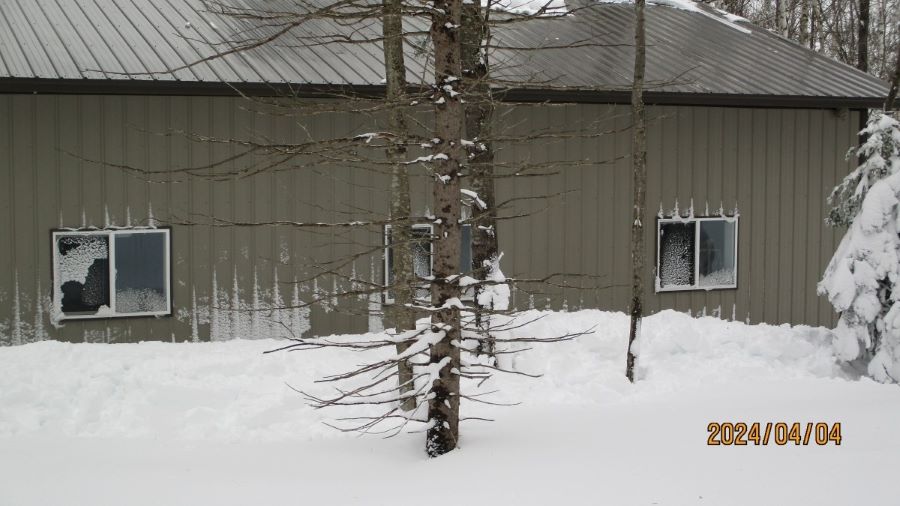
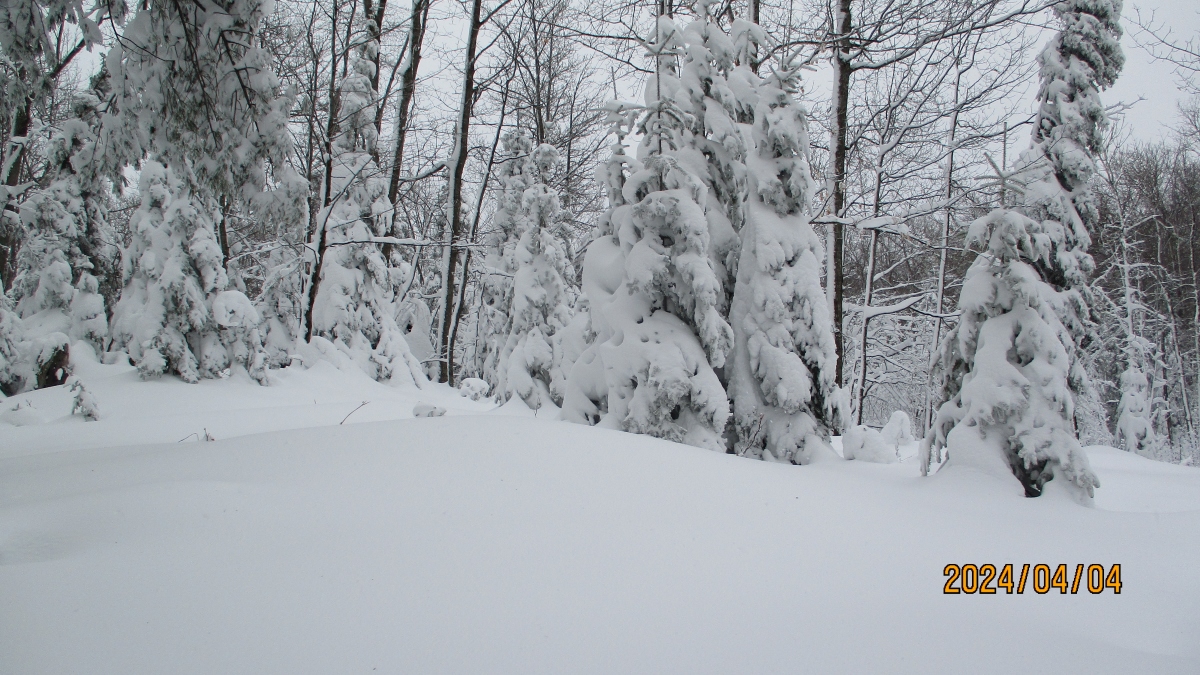
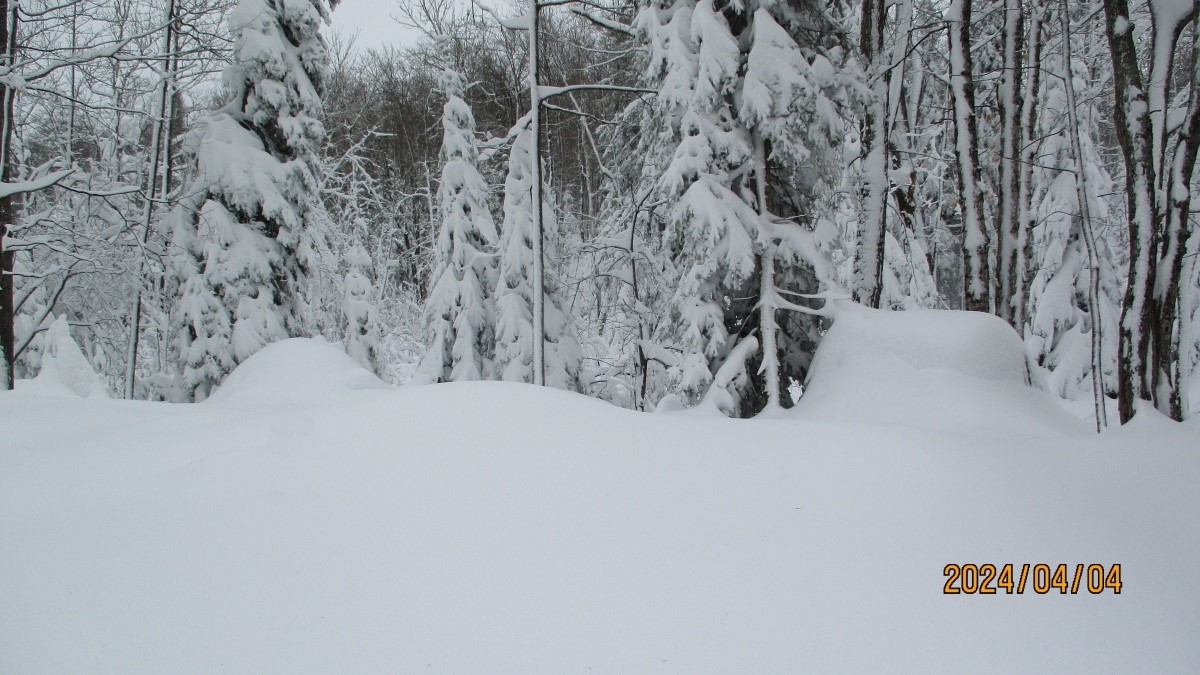
Blizzard warning replaced this afternoon with a wsw for 6-8 inches tonight as snow has picked back up the past couple hours after a lull this afternoon. Ratios today were closer to 6-7:1 so totals will be much lower than forecast but the snow is extremely dense. A couple pics from earlier today.
.thumb.jpg.09f00fa9657a460194b3be927aadf206.jpg)
.thumb.jpg.75736cfc507dd220624fab2b43bbe21c.jpg)
Beautiful. The storm sure was a dud outside of the higher elevations/huron mountains (and even there, much lower than forecast).
-
55 minutes ago, roardog said:
The difference between heavy snow and 30 degrees and heavy snow and 33 or 34 degrees is huge imo. I actually kind of hate snowstorms where the surface temp is above freezing. It feels like you “waste” a lot of snow to melting but at the same time it sticks to everything and causes tree damage and power outages.
Jan 12, 2024
DTW 1.04" precip, 4.6" snow, temps 33-34
White Lake NWS 0.70" precip, 7.5" snow, temps 31-32
-
1
-
-
56 minutes ago, weatherbo said:
Marquette and Baraga counties upgraded to a blizzard warning before it's even started.
What's your seasonal total this year and your annual average?
-
3 hours ago, Imneversatisfied said:
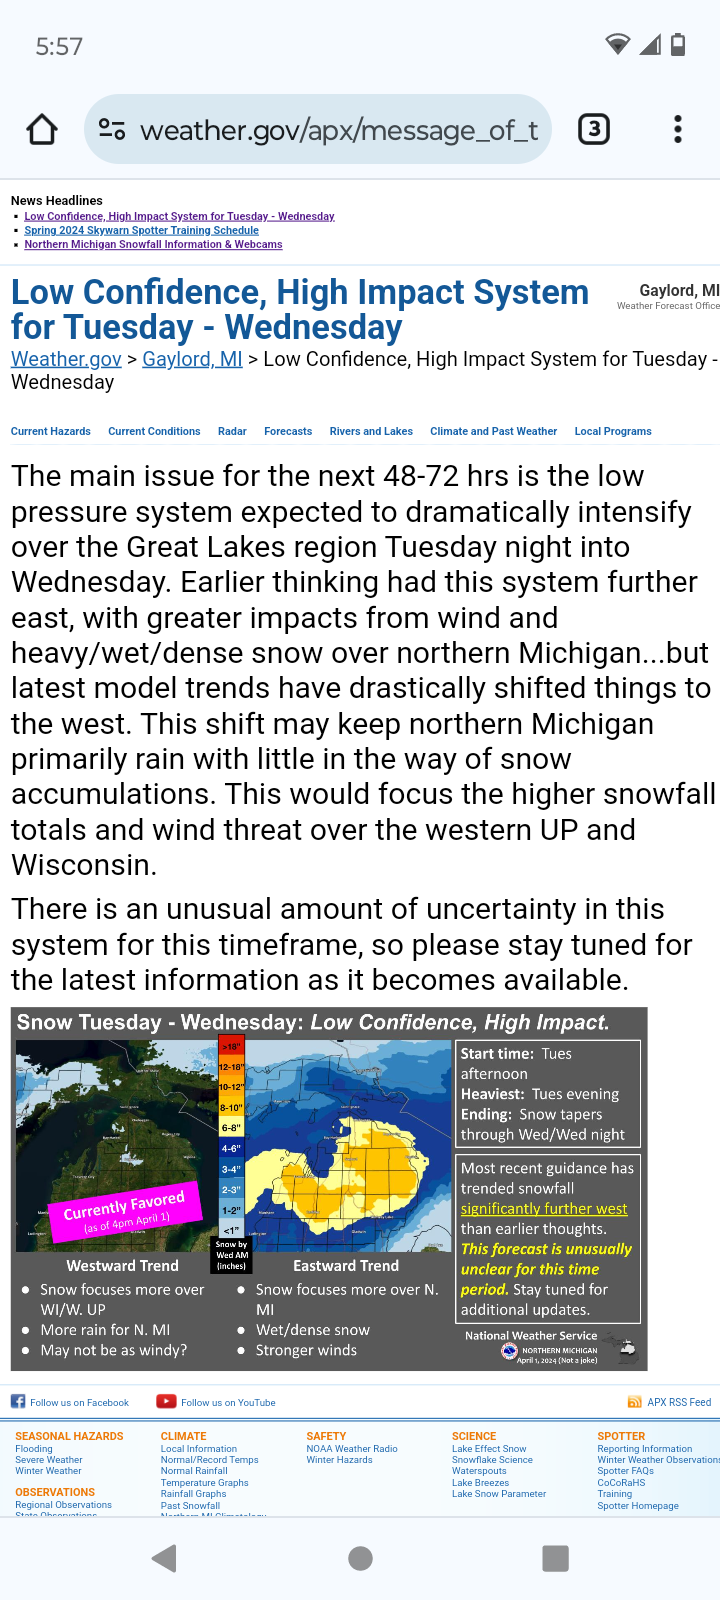
The 18z runs all seem to be holding their ground. Really sucks for me in Alpena as that bullseye was over my area in MI for 5 days on global models,then they shifted west last night big time. Mesoscale models continue east tho. Dare I hug the NAM ect??? Lol The rug might have been pulled one last time on me this snow season. Should be an interesting storm to nowcast!

Definitely frustrating to see the models so off on placement for so many days, but the sting is definitely less in spring.
-
7 hours ago, Roger Smith said:
I would guess probably about 80-82 at location of JFK, if they could have taken the reading, it looks like a WSW flow which probably explains PVD getting to 90F. It had been very mild for weeks all over the country (and in southern Ontario) so there was probably no snow south of Lake Superior since early in the month.
After a cold winter of 1944-45, the inferno was on in March. The original Morch if you will. Oftentimes following a cold winter, spring vegetation is late, but the green up was record early in 1945 and freezes in April and May pretty much destroyed most fruit crops in the midwest that year.
-
5 hours ago, rainsucks said:
at least it's looking likely that the day of the eclipse will be quite mild.
It doesnt matter if its cold or warm or anything in between. Its all about skycover that day.
-
 1
1
-
-
16 hours ago, Brian D said:
Just looking at SWE of this system, Monday's snow was really wet. There was a little rn mixed in between 2-4 am (couple hundreths).
TH co-op data:
2024-03-25 0.69 7.5 7 31 26 2024-03-26 0.55 2.0 8 33 27 2024-03-27 0.37 4.0 10 27 16 On January 12th, DTW saw 1.04" precip and 4.6" snow, and that was all snow except the last 0.04". It's like walking through mashed potatoes.
-
1
-
-
Where is that photo from? Its incredible!
-
On 3/26/2024 at 2:02 PM, TheClimateChanger said:
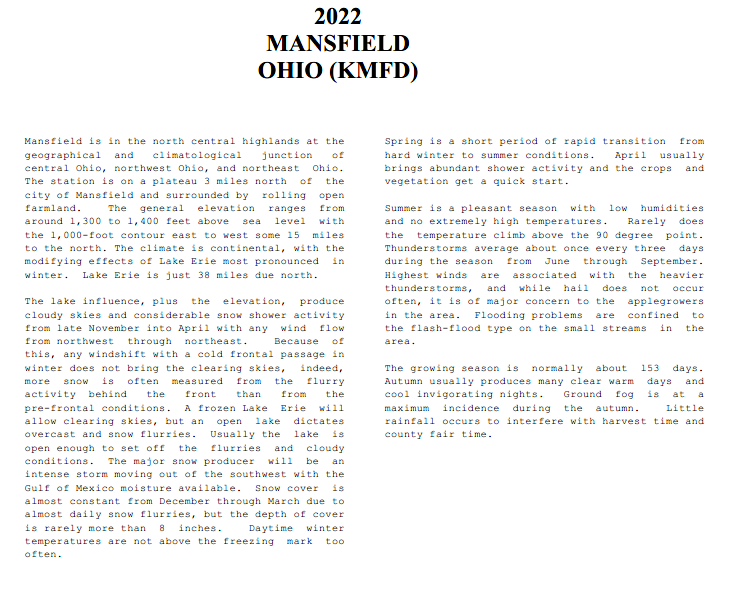
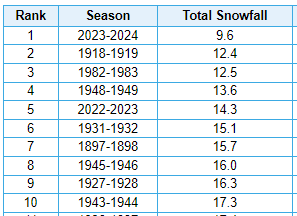
It's high time the NWS amends the description of climate in Mansfield, Ohio. There is not near continuous snow cover from December through March anymore. And daytime temperatures regularly exceed freezing in the winter. That would be considered absurd today. There's barely been 20 inches the last two winters combined. And 3 of the top 10 least snowy winters are in the last 5 years.
I really believe Ohio is ground zero for climate change. Feels like it's warming faster in this region than anywhere on the planet.
Its a ridiculous description to begin with. When has Mansfield EVER had continuous snowcover Dec-Mar? It has nothing to do with "anymore". Their decade with the most Dec-Mar snowcover days (1"+) was the 1970s, which averaged 51 days out of a possible 121. Thats less than half. The 2000s & 2010s were steady with snowcover, seeing more than the 1980s-90s, on par with the 1960s, and more than the 1950s (data gets sketchy before 1949). Two winters is not ground zero for a change in climate.

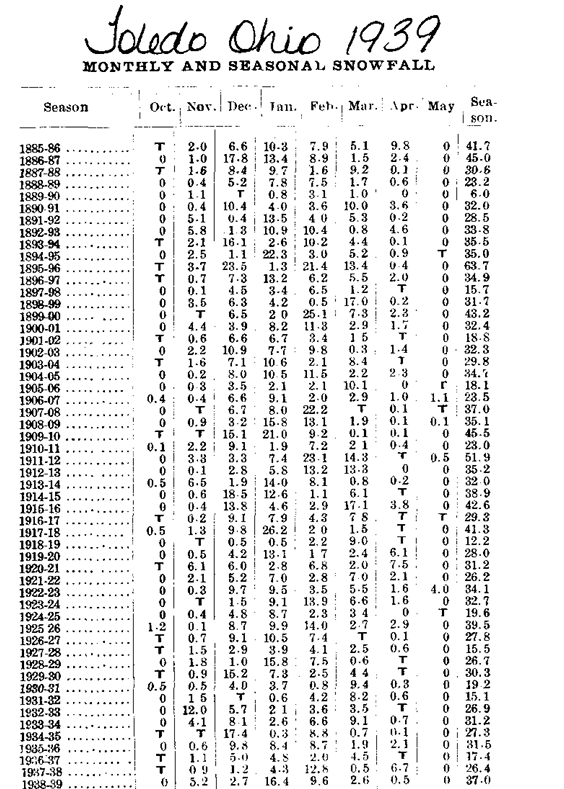
You seem to be fascinated with Toledo snow stats lately too. So I decided to look up some stats myself.
Toledos snowiest winters (since 1886)
#1 is 86.3" is 2013-14, breaking the previous record by 13.2".
7 of the top 20 snowiest have come since 2003.
2 of the top 20 least snowy have come since 2003 (the last 2 winters)
Winters with the highest snow depth (since 1893)
03.) 2020-21 (18")
06.) 2014-15 (15")
07.) 2000-01 (14")
09.) 2013-14 (13")
13.) 2008-09 (12")
2009-10 (12")
2010-11 (12")
So in 132 years of record, 6 of the top 15 peak snow depth winters have come since 2009.
-
1
-
-
53 minutes ago, Chinook said:
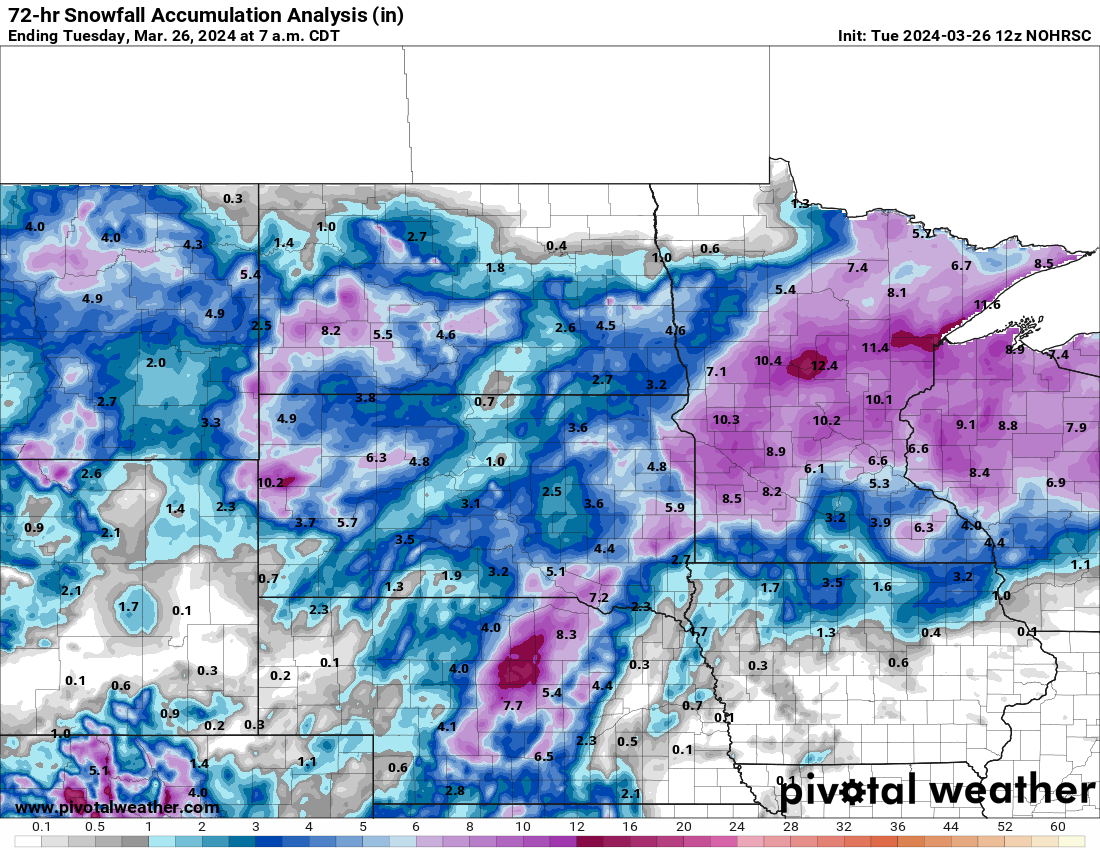
wasn't this supposed to be pretty insane for South Dakota into Minnesota? I absolutely remember a NWS graphic from Aberdeen that said 16"-23" for a border twn

Just the usual standard model clown maps making a real good storm into an epic one lol. There were a few ensemble runs where every ensemble mean had 30"+ at aberdeen
-
1 hour ago, OrdIowPitMsp said:
3.5” at MSP at the 1pm measurement. Still snowing steadily with some heavier returns that’ll rotate through later this afternoon.
Minneapolis has now seen 14.7” of snow since Thursday evening. We were at 14.3” season to date before this period of active weather began.
Crazy. Cant talk futility until April in the upper Midwest, and March in the rest of the midwest IMO.
Certainly doesnt make up for a shitty winter, but the snow blitz of March 21-26 has plummeted Minneapolis from 2nd least snowy winter to 24th least snowy, and Im sure the ranking will be even lower.
At Detroit, 12.7" of the seasons 23.5" fell in a 9-day stretch Jan 11-19, but thanks to that, as Ive mentioned, we are just at 18th least snowy, and easily could fall out of the top 20 with a small April snowfall.
-
1
-
-
2 hours ago, Brian D said:
The daily data shown at MRCC from Oct 1863-April 1864 is robust. Nothing missing. 16.6" is the final value for the season.
The 1863-64 was well documented locally to have an extremely severe cold snap around New Years and little winter weather the rest of the season. It was considered a very open winter outside of the first half of January, with very little snow, so that total is 100% believable.
Documentation about the winter at Detroit (from "Memorials of a Half Century", a fantastic 1883 book by Bela Hubbard).
1863-64: New Years will be remembered for violent & sudden reversal of temperature. December had been mild with only occasional floating masses of ice on the river. Rain set in December 31st, along with a 24-hour temp fall 40F the evening of Dec 31st to -20F the evening of January 1st. Little snow fell here, but the fall was heavy in Chicago. On Jan 5th, 4” of snow gave good sleighing & it remained cold & sunny the next few weeks. By January 18th thawing left the ground bare, and by January 25th the broad expanse of the river was now free from ice. On January 27th it hit 60F. The first half of February continued mild, thawing during the day & scarcely freezing at night. Frost out of the ground. February 15th was as bright & balmy as April, but a flurry of snow & big change the next day followed by -3F on February 17th.
-
1
-
-
2 hours ago, TheClimateChanger said:
I said from Toledo to DTW airport. All of the records prior to the mid 1950s are from the city proper. Of course, it's a bit longer drive out to the airport. The snowfall records were retrieved from xMacis, which has nothing prior to 1890-91.
The reason I noted the airport is because I have a friend who lives in Toledo and each of the last 2 winters theyve had more than the airport to their south/west. Much less than DTW, but more than TOL, so Id estimate Toledo the city has probably had 12-15" this season. Monroe, MI is at 17". The last 2 years have been very latitude based in the region. I see Mansfield, OH is at just 8.4". Good Riddance El Nino.
And I know its xmacis. Xmacis doesnt always have all the data, it has to be input by someone lol. There is no reason that data that had been counted for 100+ years suddenly is not if there is no M data or anything. Im sure if it was a record that was to your liking youd 100% agree, seeing as though you frequently reference old data
")

-
5 hours ago, Lightning said:
Just using this list...
Worst in my life was => 11.) 20.0" - 1982-83. This winter was pure evil. To go for the record low and have it swiped out in the end.
Next would be => 20.) 25.1" - 1988-89. It was huge LES year. MTU neared the record; unfortunately it was one year to early for me.
Then comes => 18.) 23.7" - 1999-00. In general that winter just sucked. Interestingly it was sandwiched between to incredible periods events. January 99 & Nov./Dec. 2000
16.) 23.4" - 1997-98 => This winter was so overly forecasted to be warm that it didn't really bother me.
19.) 24.1" - 2003-04 => Detroit bad winter; not the norther burbs!!
Ones not on this list.
95-96 ... only saving grace was March!!
11-12 ... meh; very boring winter overall. Morch made for an interesting finish (but very bad for local fruit industry).
1999-00 & 2003-04 get a pass due to decent snowcover stretches
-
1
-
 1
1
-
-
1 hour ago, TheClimateChanger said:
Same story in Toledo, less than an hour drive from DTW airport.
Of course, @michsnowfreaklikes to point out a 6.0" observation from the winter of 1889-1890, but I'm guessing that lacks daily resolution as it is not part of the threaded record, which begins in 1890-1891.
Toledo snowfall records began in 1885. They were always included until nws Cleveland randomly revamped their website and it now starts in 1890. There was no missing data, so the 6.0" figure is absolutely believable.
And actually, Toledo Express airport is a little bit over an hour drive from Detroit Metro airport, although I have absolutely no idea what Detroit has to do with Toledo. Especially as I have said many times the state-line snow cutoff the last 2 winters has been insane.
Not sure why we are using DTW as a drive time base, but Detroit Metro Airport (23.5") is a 65 minute drive to Toledo Express (9.6") airport but only a 25 minute drive to U of M Ann Arbor, where 36.9" has fallen this year.
-
1 hour ago, mississaugasnow said:
Coastal cities with 0-2” worst season can’t really talk about it until April haha
New York City saw just 0.5" in 1997-98 until a freak, unexpected snowstorm dropped 5.0" on March 22nd. It was gone in less than a day. But instead of ranking as least snowy winter, due to that unexpected spring storm, it "only" ranks as 8th least snowy.
-
1
-
-
1 hour ago, mississaugasnow said:
Yep, and to be fair you guys out west seem to have crazy low lowest snowfall. For example Ottawa is at 45” and it’s one of their least snowy winters ever
so if Ottawa is at 15” come mid January to early February it makes sense for them to start talking about futility
You guys out west I think you mentioned are 12”. So I see why talking about it early is pointless.
We have not had a sub-20" winter since 1969, but they did happen. Not frequently, but Detroits full top 20 lowest snowfall
01.) 12.9" - 1936-37
02.) 13.2" - 1881-82
03.) 13.7" - 1948-49
04.) 15.2" - 1918-19
05.) 15.4" - 1965-66
06.) 15.8" - 1889-90
07.) 16.6" - 1952-53
08.) 17.1" - 1968-69
09.) 18.0" - 1957-58
09.) 18.0" - 1960-61
11.) 20.0" - 1982-83
12.) 22.0" - 1945-46
13.) 22.6" - 1937-38
14.) 22.8" - 1943-44
15.) 23.2" - 1888-89
16.) 23.4" - 1941-42
16.) 23.4" - 1997-98
18.) 23.7" - 1999-00
19.) 24.1" - 2003-04
20.) 25.1" - 1988-89
Some late season facts about the above...they were terrible enough, but look where they could have been without....
#4) 1918-19: A heavy, wet snowstorm of 5.8" on Mar 9th, largest of the season, melted in 2 days, gave a big boost to the total
#6) 1889-90: A 5.0" heavy, wet snowstorm on March 29th was by far largest of the season
#9) 1960-61: Winters fiercest storm was its last - 3.0" fell at Detroit on April 16/17, but 4-5" fell in some suburbs and blizzard conditions clogged highways in west MI
#11) 1982-83: Disaster winter sees a late rally with a 7.3" snowstorm March 20/21 then another 3.4" snowfall April 17th
#13) 1937-38: 3 April snowfalls (4th, 6th, 8th) dropped a total of 3.9" at Detroit. The 4th dropped up to 4" well north of Detroit and the 6th dropped 6-7" near the Ohio border
#14) 1943-44: 15.7" of the seasons 22.8" fell after Feb 9th & 3.8" fell before November 16th,. So from Nov 17-Feb 9, a total of 3.3" fell.
#16) 1941-42: A 4.2" wet snowfall on April 9/10 would be the seasons largest
-
1
-
-
On 3/24/2024 at 1:25 PM, GaWx said:Per the link below that pertains to long term impact from the 2022 Tonga volcano, we may very well go right back to El Nino in 2025-6 and quite possibly a multi-year version. Note how the DJF temperature anomaly pattern over the US in figure 7a (which covers the progged peak period of effects 2025-2029 or the interval of 3-7 yrs after eruption) comes rather close to a typical El Niño, including the cool SE and mild NW. Also, note especially figure 11d, which shows an El Ninolike Pacific SSTa pattern:"The MiMA simulations confirm the robustness ofthe SWV-induced wave structure in the Pacific (Fig. 11ef),and they produce tropical surface temperature anomaliesconsistent with an El Ni˜no-like pattern (Fig. 11a-d). Thisheating is produced by the zonally asymmetric distributionof SWV in the tropics, and consistent with the increasedsurface downward longwave flux over the tropical Pacificin WACCM (Fig. 9a). Thus, it is possible that the SWVforcing from the eruption would favor a positive phase ofENSO on a multi-year timescale, but further work is re-quired to confirm this, in particular with a model includingfully interactive ocean and cloud feedbacks."So, @George001may very well be doing several years in a row of “how strong will El Niño get” starting with 2025-6 if this publication were to have a good clue.
Interesting in that those simulations seem to show much cooler summers than we have seen recently.


.jpg.1be70e9f96b412e1338ba23e2ebe267e.jpg)
.jpg.a84d358e31a4e174c0900d607c49d91b.jpg)
April 2024 General Discussion
in Lakes/Ohio Valley
Posted
Snowy on this day in 2020, the start of 3 years in a row of late snows