Do you guys like eye-popping weather graphics! I'm excited to announce that I will be working to sell my broadcast-quality weather graphics. I've worked on my portfolio for the past 2 years. Being very interested in the TEGNA style, I have successfully been able to mimic the design, recreating a good chunk of their graphics from scratch.
These graphics are fully customizable, with the ability to change the design color, text, images, etc. There's no gimmick, If you are still on the edge on buying some graphics from my portfolio, contact me for a few samples
Price I charge 7 USD per graphic If you would like a mass quantity, I could definitely set you up with a large discount.
Format I mainly design my graphics in Powerpoint, as that would be the best and easiest way of editing the graphics I will also set up some graphics in other presenter programs, such as google slides, etc. I will not provide my graphics in photoshop however as I would have to recreate everything from scratch
How graphics are set up? If you notice below some graphics on the list exceed just one digit, for example, 71.1-71.6 This is because some graphics contain more that one included with one purchase. If I were to buy 71.1-71.6 I would receive 6 graphics for the price of one. Why? Many graphics are set up very close in design to another, I think it's fairer to pay the sets together due to the close similarity
How do you buy the sets? 1. email me at[email protected] 2. Direct message me
I need suggestions! If you have graphics not on here that you had in mind, let me know in this thread, I can work on making one quickly
What is the best time to reach me? Weekdays 4:00pm to 8:00pm Weekends 10:00pm to 8:00pm
1.1-1.9 Freely Available after paying for 5 graphics 2 Weather headlines 3 Current conditions 4 Daily Almanac 5 Precipitation Almanac 6 Daily Almanac w/ background 7.1-7.3 Today/Tonight/Tomorrow 8 Today and Tonight forecast 9 7 days forecast 10 7 days forecast color rush 11 10 day extended forecast 12 Regional forecast 13 School bus forecast 14-weekend forecast 15.1-15.2 5 days temperature graph 16 Sports game forecast 17 Rain chances 18 beach forecast 19 Planning forecast 3 boxes 20 planning forecast 9 boxes 21 planning forecast 7 boxes 22 24 hour planning forecast 23 heat index forecast 24 Current dew points 25 Pollen forecast 26 Dew point 7-day forecast chart 27.1-27.2 Drought monitor 28 National forecast 29.1-29.2 Flood chart and hydrograph 30 30.1-30.7 6-10, 7-14 day, 3-4 week Precipitation and temperature, 3-month drought outlook 31 Air Quality Alert 32 pollen by season graph 33 Richter Earthquake scale 34.1-34.2 Records Warm/cold 36 Watch vs Warning vs Advisory 37 Flood safety tips. 38.1-38.3 Severe/Winter/Tropical weather threats color rush 39.1-39.3 Severe/Winter/Tropical weather threats 40.1-40.3 Severe/Winter/Tropical threats by timeframe 41.1-41.2 Winter/severe weather category threats 42.1-42.3 categorical Severe weather threats day by day *Note you may request any state/s 43 severe weather timeline 44 Fujita scale 45 Ice impacts 46 What is a bomb cyclone 47 Precipitation type classification 48 Different precipitation type tracks 49 Wind chill forecast 50 Precipitation type timeline breakdown 51 Snow meter 52 Snow to liquid ratio 53 Model precipitation accumulation SN/IP/ZR 54 Rush hour forecast 55 Snow chances for accumulation (Chance of None,T-1,2-4,4-6,6-8,8-12,12-18) 56 day by day winter weather chances 57 model snow comparison 58 model precipitation comparison 59 Model temperature comparison 60 Model snow comparison, line, and arrow 61.1-61.2 Model snow and ice comparison numerical 62 Snow reports 61.1-63.6 Snow temperature trends and analysis charts 64 Winter weather forecasting timeline 65.1-65.2 Winter/tropical weather development checklist 66 Tropical cyclone info chart 67 Saffir Simpson scale 68.1-68.2 2019 hurricane season forecast and names 69.1-69.3 Tropical spaghetti phots ATCF/GFS/CMC 70 tropical cyclone intensity chart 71.1-71.6 Tropical cyclone frequency Jun/Jul/Aug/Sep/Oct/Nov 72 tropical frequency chart 73 Current atmospheric dust 74 current atmospheric wind shear 75 NHC cone oo uncertainty 76 NHC 5 day development chances 77.1-77.2 Tropical/Hurricane-force wind chances 78 Chances of a cyclone reaching max category 79.1-79.3 SST anomalies/7 day change/ Temperatures 80 Cera Max surf forecast 81 NHC rain forecast 82 Calendar 83.1-83.4 Fall/Spring Equinox Summer/Winter solstice Other Solutions
I also offer Regional map graphics for the map designing. For example, using the graphic to make a snow forecast. I price the Regional maps at 30 USD because of how much work they take to design. I can sell these in Photoshop, Powerpoint, and most any other software. *Note regional maps are designed in layers*


My Custom Graphics Solution!
in Weather Marketplace
Posted
Do you guys like eye-popping weather graphics!
I'm excited to announce that I will be working to sell my broadcast-quality weather graphics. I've worked on my portfolio for the past 2 years. Being very interested in the TEGNA style, I have successfully been able to mimic the design, recreating a good chunk of their graphics from scratch.
These graphics are fully customizable, with the ability to change the design color, text, images, etc. There's no gimmick,
If you are still on the edge on buying some graphics from my portfolio, contact me for a few samples
Price
I charge 7 USD per graphic
If you would like a mass quantity, I could definitely set you up with a large discount.
Format
I mainly design my graphics in Powerpoint, as that would be the best and easiest way of editing the graphics
I will also set up some graphics in other presenter programs, such as google slides, etc.
I will not provide my graphics in photoshop however as I would have to recreate everything from scratch
How graphics are set up?
If you notice below some graphics on the list exceed just one digit, for example, 71.1-71.6
This is because some graphics contain more that one included with one purchase.
If I were to buy 71.1-71.6 I would receive 6 graphics for the price of one.
Why? Many graphics are set up very close in design to another, I think it's fairer to pay the sets together due to the close similarity
How do you buy the sets?
1. email me at [email protected]
2. Direct message me
I need suggestions!
If you have graphics not on here that you had in mind, let me know in this thread, I can work on making one quickly
What is the best time to reach me?
Weekdays 4:00pm to 8:00pm
Weekends 10:00pm to 8:00pm
Below are my graphic sets, I have a list, explaining the use for each graphic, and a catalog with the correlating number in the link below
https://drive.google.com/drive/folders/ ... sp=sharing
1.1-1.9 Freely Available after paying for 5 graphics
2 Weather headlines
3 Current conditions
4 Daily Almanac
5 Precipitation Almanac
6 Daily Almanac w/ background
7.1-7.3 Today/Tonight/Tomorrow
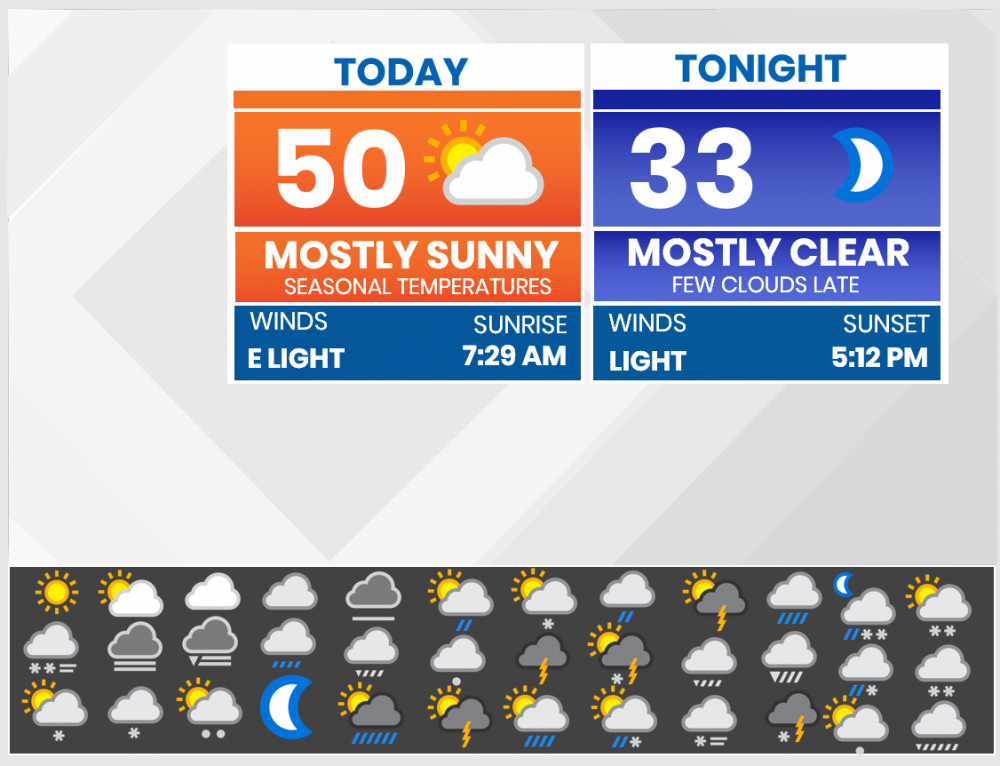
8 Today and Tonight forecast
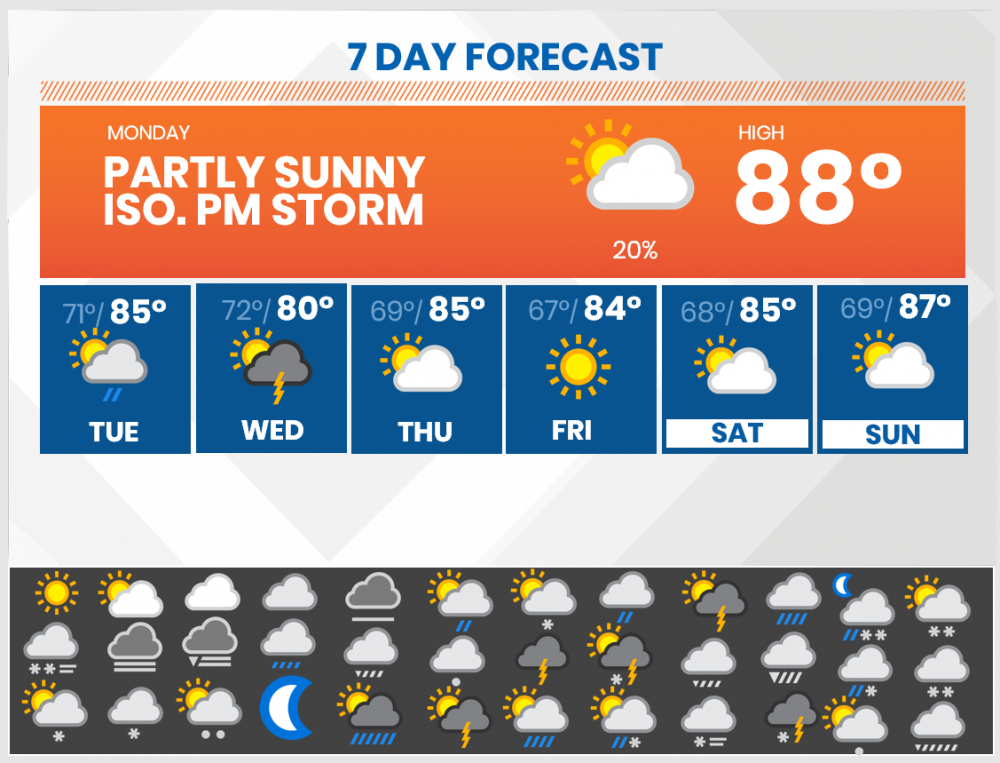
9 7 days forecast
10 7 days forecast color rush
11 10 day extended forecast
12 Regional forecast
13 School bus forecast
14-weekend forecast
15.1-15.2 5 days temperature graph
16 Sports game forecast
17 Rain chances
18 beach forecast
19 Planning forecast 3 boxes
20 planning forecast 9 boxes
21 planning forecast 7 boxes
22 24 hour planning forecast
23 heat index forecast
24 Current dew points
25 Pollen forecast
26 Dew point 7-day forecast chart
27.1-27.2 Drought monitor
28 National forecast
29.1-29.2 Flood chart and hydrograph
30 30.1-30.7 6-10, 7-14 day, 3-4 week Precipitation and temperature, 3-month drought outlook
31 Air Quality Alert
32 pollen by season graph
33 Richter Earthquake scale
34.1-34.2 Records Warm/cold
36 Watch vs Warning vs Advisory
37 Flood safety tips.
38.1-38.3 Severe/Winter/Tropical weather threats color rush
39.1-39.3 Severe/Winter/Tropical weather threats
40.1-40.3 Severe/Winter/Tropical threats by timeframe
41.1-41.2 Winter/severe weather category threats
42.1-42.3 categorical Severe weather threats day by day *Note you may request any state/s
43 severe weather timeline
44 Fujita scale
45 Ice impacts
46 What is a bomb cyclone
47 Precipitation type classification
48 Different precipitation type tracks
49 Wind chill forecast
50 Precipitation type timeline breakdown
51 Snow meter
52 Snow to liquid ratio
53 Model precipitation accumulation SN/IP/ZR
54 Rush hour forecast
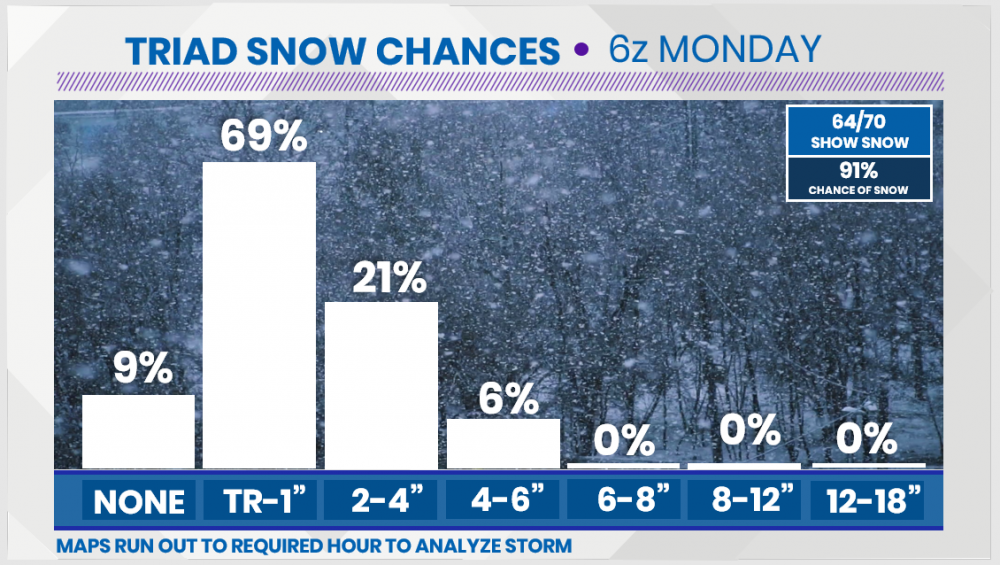
55 Snow chances for accumulation (Chance of None,T-1,2-4,4-6,6-8,8-12,12-18)
56 day by day winter weather chances
57 model snow comparison
58 model precipitation comparison
59 Model temperature comparison
60 Model snow comparison, line, and arrow
61.1-61.2 Model snow and ice comparison numerical
62 Snow reports
61.1-63.6 Snow temperature trends and analysis charts
64 Winter weather forecasting timeline
65.1-65.2 Winter/tropical weather development checklist
66 Tropical cyclone info chart
67 Saffir Simpson scale
68.1-68.2 2019 hurricane season forecast and names
69.1-69.3 Tropical spaghetti phots ATCF/GFS/CMC
70 tropical cyclone intensity chart
71.1-71.6 Tropical cyclone frequency Jun/Jul/Aug/Sep/Oct/Nov
72 tropical frequency chart
73 Current atmospheric dust
74 current atmospheric wind shear
75 NHC cone oo uncertainty
76 NHC 5 day development chances
77.1-77.2 Tropical/Hurricane-force wind chances
78 Chances of a cyclone reaching max category
79.1-79.3 SST anomalies/7 day change/ Temperatures
80 Cera Max surf forecast
81 NHC rain forecast
82 Calendar
83.1-83.4 Fall/Spring Equinox Summer/Winter solstice
Other Solutions
I also offer Regional map graphics for the map designing. For example, using the graphic to make a snow forecast.
I price the Regional maps at 30 USD because of how much work they take to design.
I can sell these in Photoshop, Powerpoint, and most any other software.
*Note regional maps are designed in layers*