


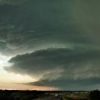
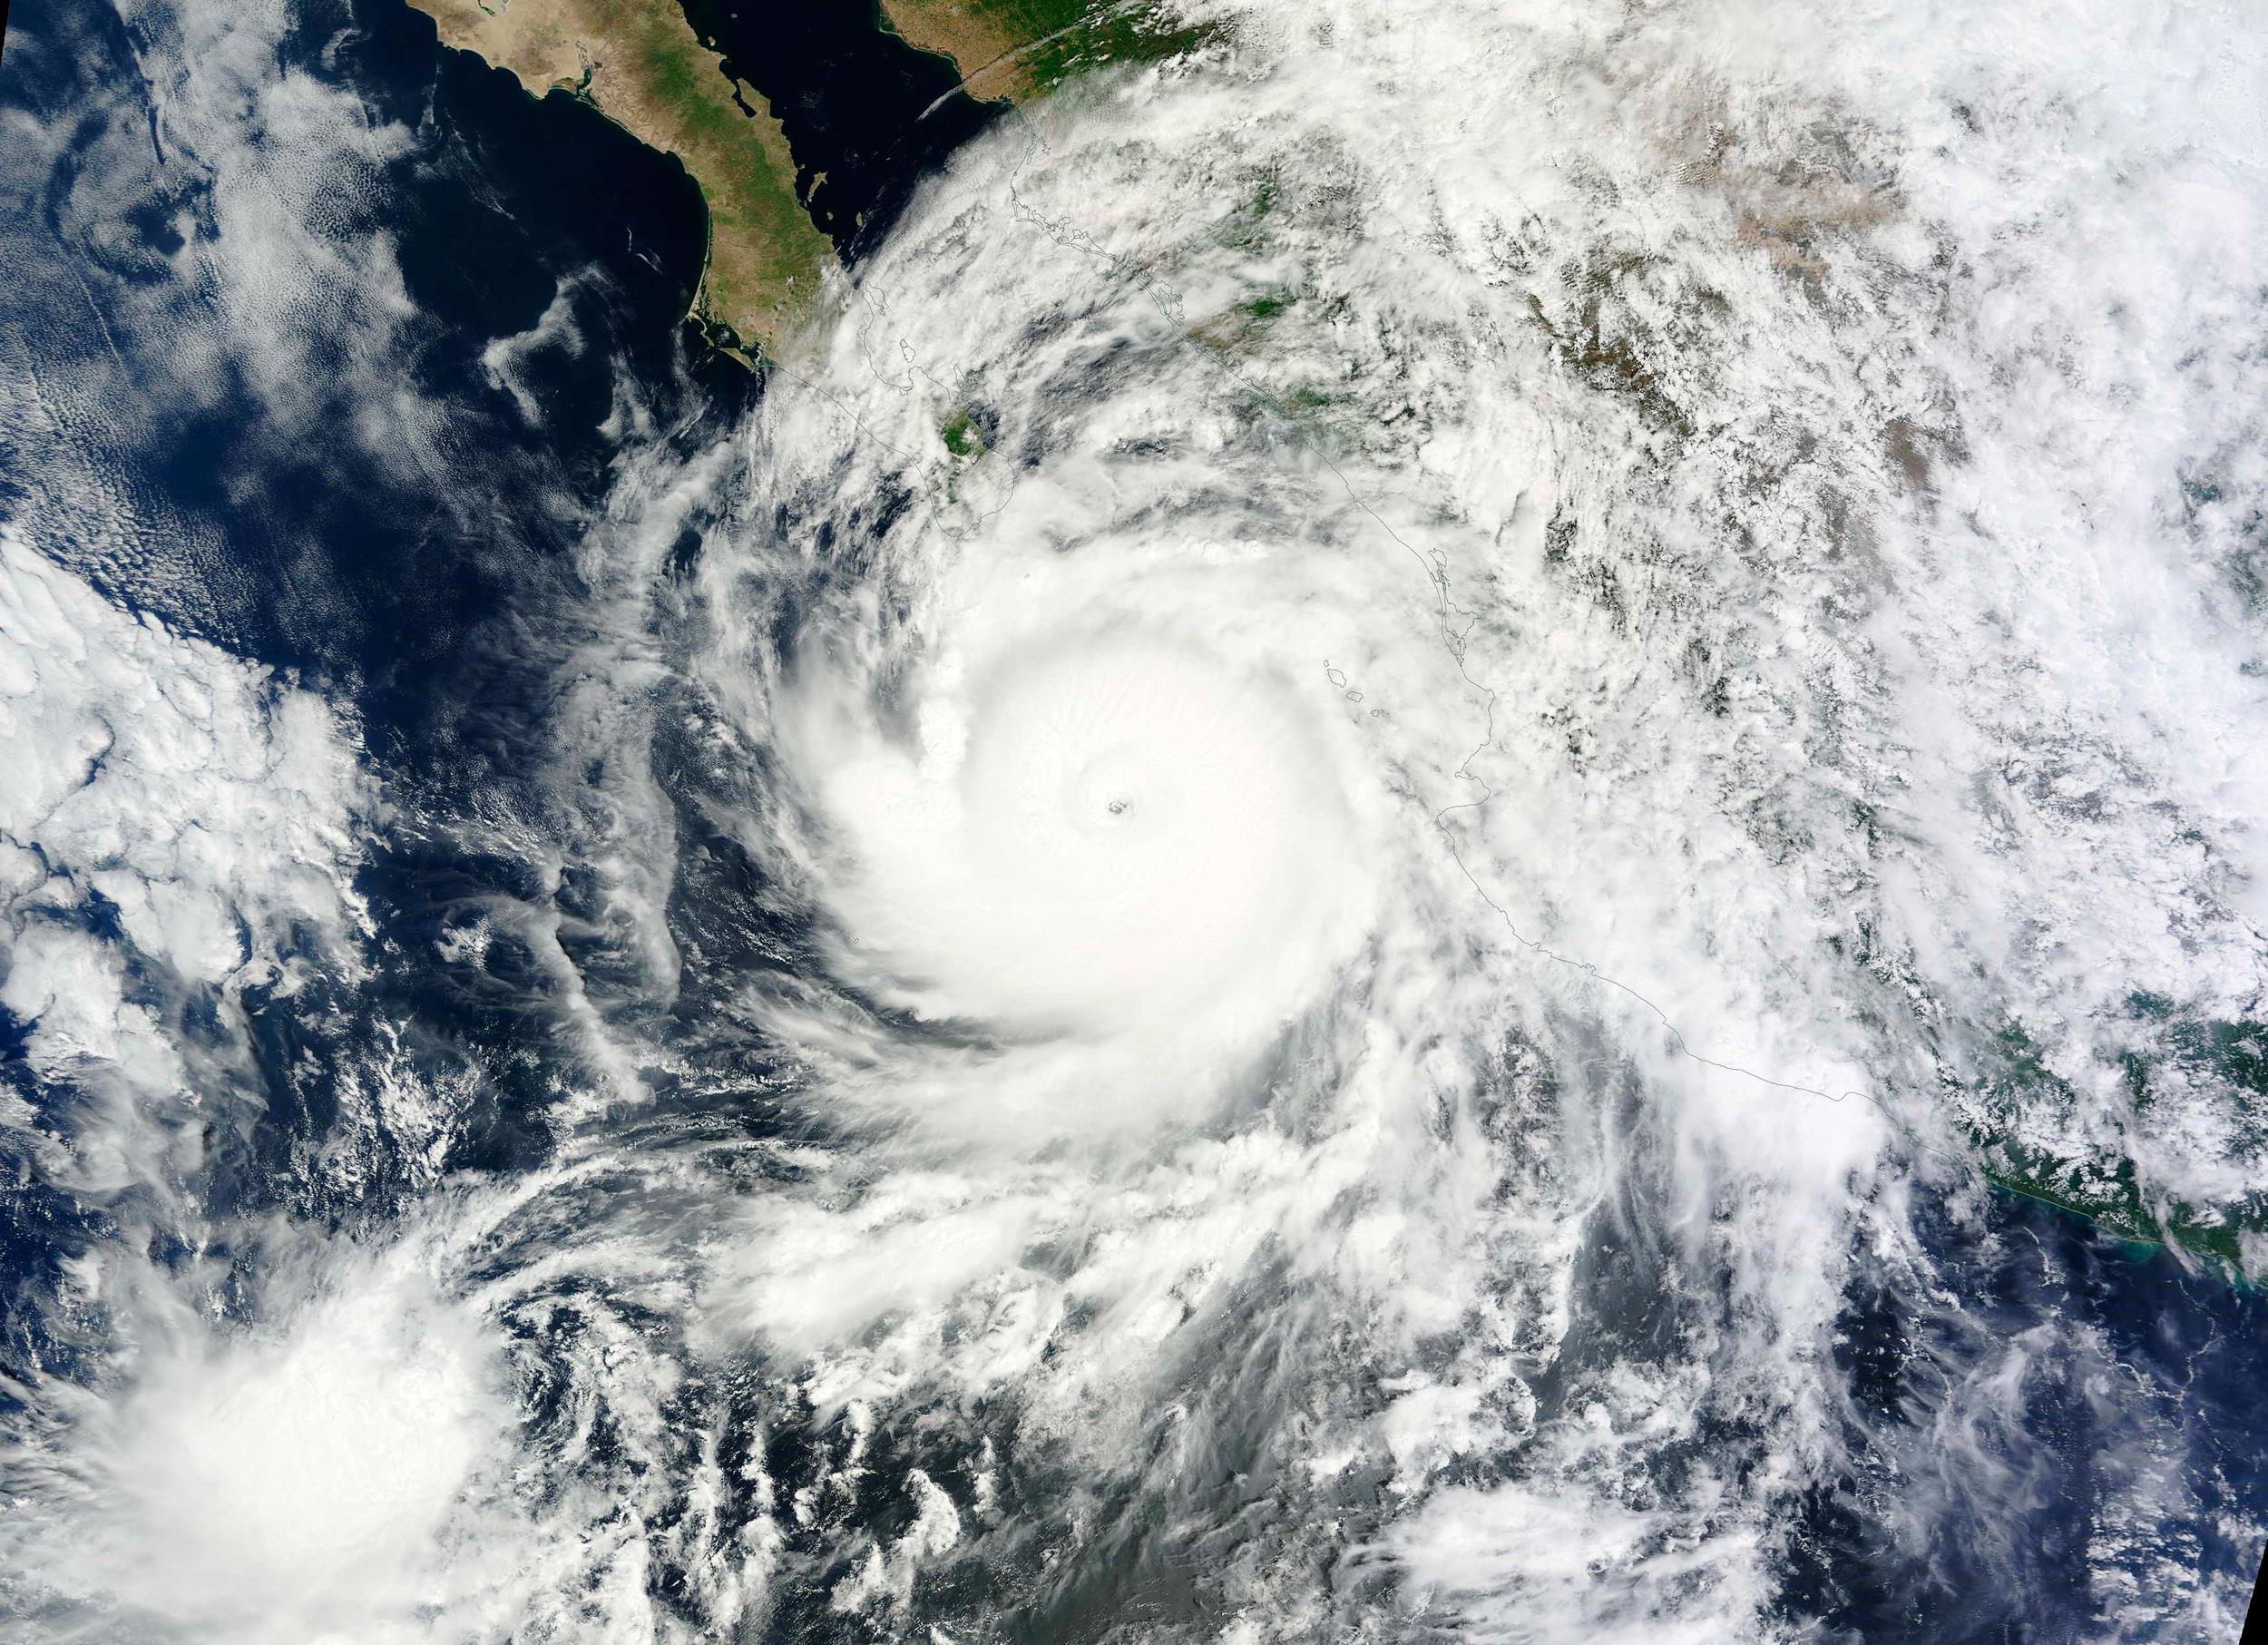
Just figured I'd get a main thread going for the potential impacts of the remnants of Tropical Storm Odile on the Southern Plains to organize the discussion. So far, the Euro has backed off of its prolific rainfall totals (up to 17" SW of OKC) that it showed yesterday, but forecasts keep bouncing around a bit as is to be expected, with the GFS now shifting the swath of heaviest rain into northern OK from southern KS and the 84-hr NAM doing the same.
WPC Discussion
DAY 1SOUTHWEST INTO THE SOUTHERN PLAINS
WIDESPREAD HEAVY TO EXCESSIVE RAINFALL LIKELY DAY 1 ASSOCIATED
WITH THE CIRCULATION OF ODILE AND WELL TO THE EAST OF THIS
CIRCULATION IN THE MUCH ABOVE AVERAGE PW AXIS THAT WILL STRETCH
FROM SOUTHERN CA/SOUTHERN NV---EASTWARD INTO AZ---NM AND INTO THE
SOUTHERN PLAINS. OBSERVED PW VALUES ACROSS THESE AREAS ARE NEAR
OR ABOVE THE 99 PERCENTILE FOR SEPTEMBER---WITH NO SIGNIFICANT
CHANGES EXPECTED DURING THIS PERIOD TO THESE VALUES. THERE IS A
STRONG MODEL SIGNAL FOR HEAVY TO EXCESSIVE RAINFALL AMOUNTS ACROSS
SOUTHEASTERN AZ---SOUTHERN NM---LEADING TO HIGH CONFIDENCE ACROSS
THESE AREAS. FARTHER TO THE EAST FROM THESE AREAS--THERE IS MORE
MODEL SPREAD WITH HOW QUICKLY HEAVY PRECIPITATION BREAKS OUT INTO
THE SOUTHERN PLAINS. THE HI RES MODELS ARE MORE EMPHATIC ACROSS
THIS AREA---BUT STILL HAVE SOME SIGNIFICANT NORTH-SOUTH
DIFFERENCES WITH THEIR RESPECTIVE AXES. CONFIDENCE IS LOWER
HERE--BUT WITH THE ABOVE MENTIONED HIGH PW AXIS AND MODEL
FORECASTS OF UPPER DIFFLUENCE MAXIMUM IN THIS HIGH PW AXIS---FAVOR
THE HI RES IDEA OF SPREADING HEAVY TO LOCALLY EXCESSIVE RAINFALL
AMOUNTS EASTWARD QUICKER. WHILE MODELS DO NOT DEPICT MUCH
PRECIPITATION ON THE NORTHWESTERN PORTION OF THE ANOMALOUS PW AXIS
FROM SOUTHERN CA INTO SOUTHERN NV AND NW AZ---SCATTERED CONVECTION
LIKELY AGAIN ACROSS THESE AREAS--WITH LOCALLY HEAVY TO EXCESSIVE
RAINFALL AMOUNTS POSSIBLE.


Threw this together from the GFS forecast PWAT and the climatological PWAT graph from OUN to demonstrate their point:

Forecast Offices Graphics
Norman

Amarillo


Drought Monitor

And just for fun, a discussion from the Oklahoma State Climatologist of the heaviest rainfall events in Oklahoma history (all due to tropical remnants):
Recommended Comments
There are no comments to display.
Create an account or sign in to comment
You need to be a member in order to leave a comment
Create an account
Sign up for a new account in our community. It's easy!
Register a new accountSign in
Already have an account? Sign in here.
Sign In Now