All Activity
- Past hour
-


-
Mike Masco
-
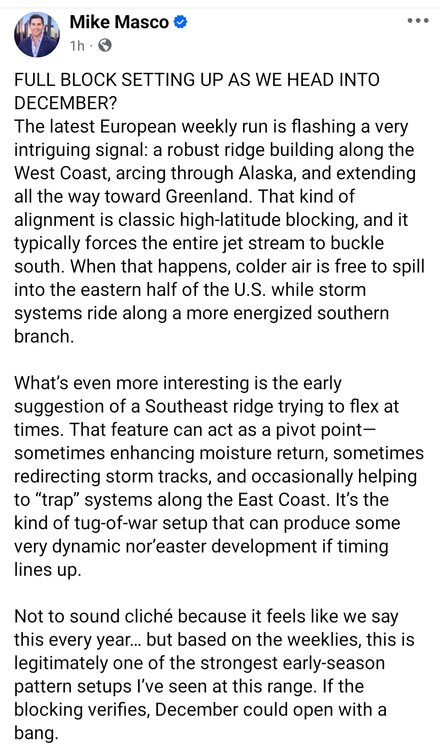
Impressive cold early next week?
-

November 2025 general discussions and probable topic derailings ...
MJO812 replied to Typhoon Tip's topic in New England
Hopefully the moose takes cover -
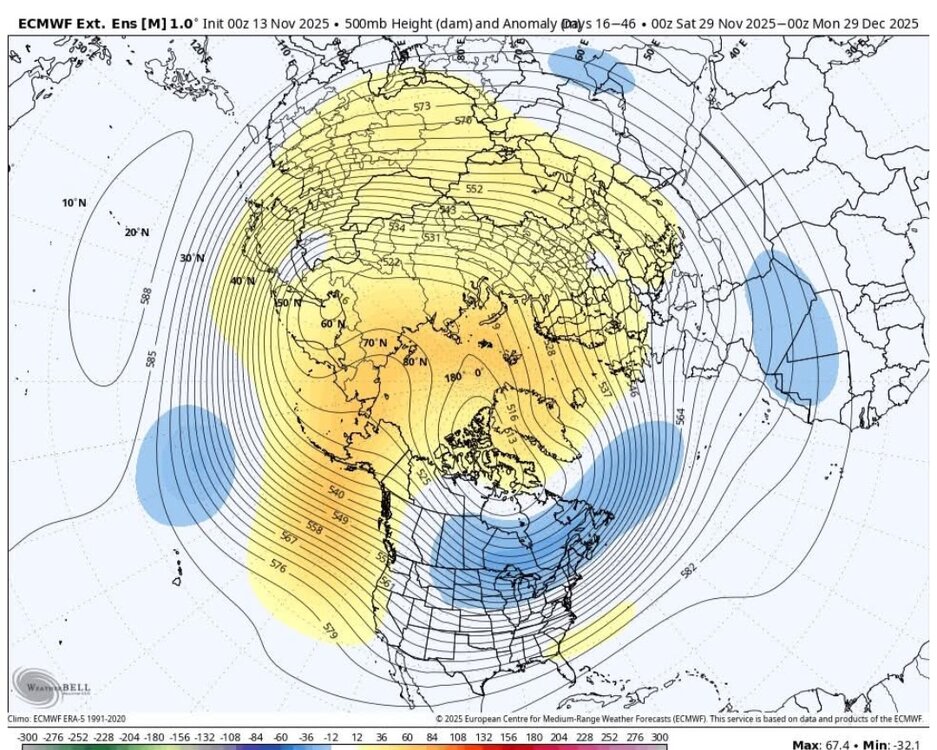
The 0z GEPS and 12z GEFS are frigid at the ends of their runs today. The EPS is lagging as it kicked the can by about 3-5 days yesterday. It still "should" get there, but have to be careful for the Charlie Brown football deal. When ensembles get that cold, chances start to go way up. Those ensembles are cold for about 75% o NA and almost all of the Lower 48. Pretty impressive.
-
I don’t believe one is a “doomer” to point out the risk of a long-term decline in seasonal snowfall. It won’t happen all at once. It will be long-term in nature. Even then, there will continue to be periodic snowy winters and occasional big snowstorms. Even a much warmer climate allows for such events. The historic Deep South snowstorm last winter is an example.
-
So cape may is somehow immune to the pac jet? Interesting.
-
 I was promised winters of yore return by 2030. Patience.
 -
November 2025 general discussions and probable topic derailings ...
dryslot replied to Typhoon Tip's topic in New England
Gives credence to the expected map because of it. -

November 2025 general discussions and probable topic derailings ...
dendrite replied to Typhoon Tip's topic in New England
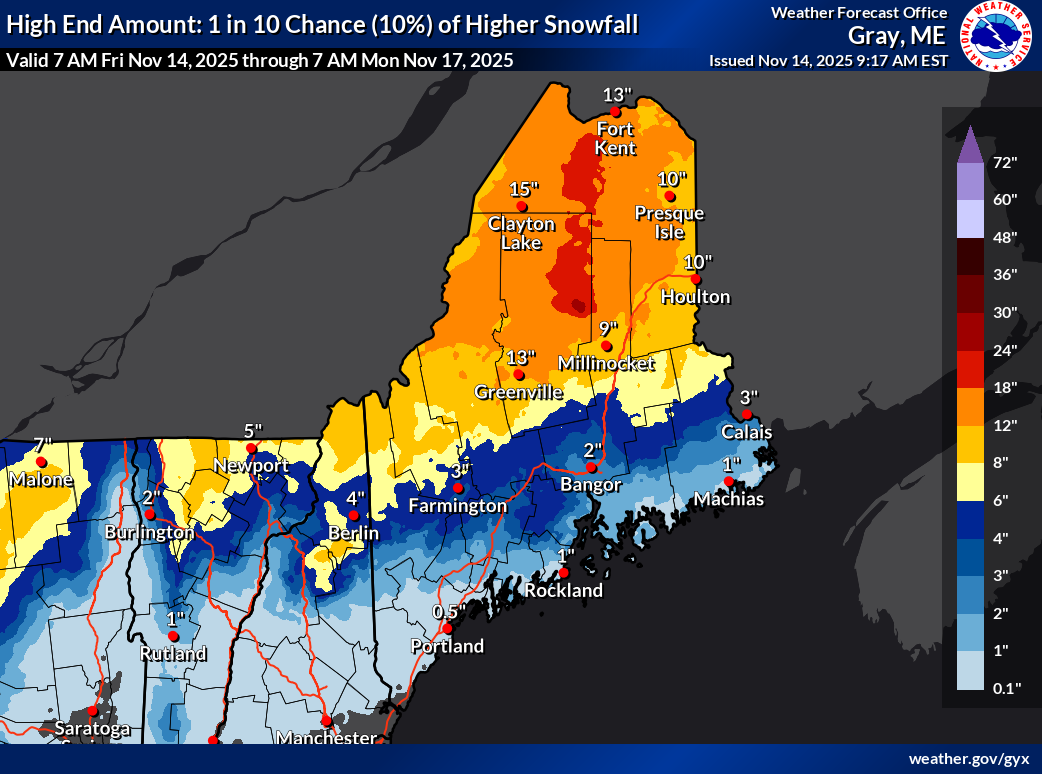
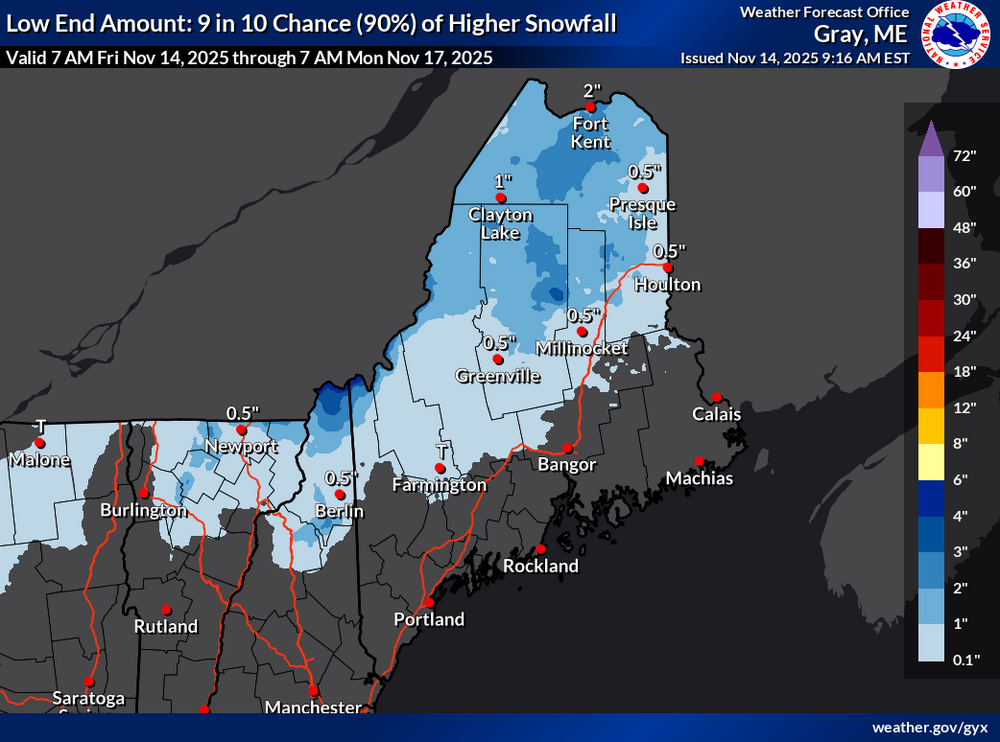
The 10% extremes are kinda funny. Big impact event vs a nothingburger.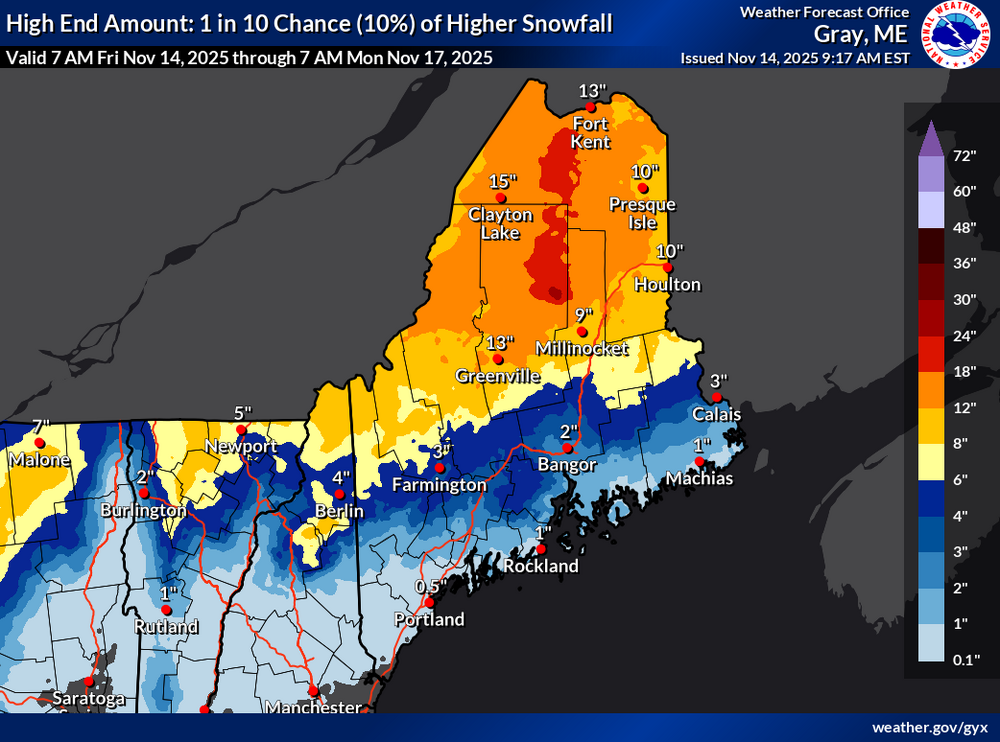
-
.thumb.png.4150b06c63a21f61052e47a612bf1818.png)
November 2025 general discussions and probable topic derailings ...
HIPPYVALLEY replied to Typhoon Tip's topic in New England
That’s a big deal in terms of sensible travel weather. Lol. -

November 2025 general discussions and probable topic derailings ...
CoastalWx replied to Typhoon Tip's topic in New England
My back still hurts from digging out of MJO812 snows. -
The 12/13 extended GEFS/EPS are both headed for phase 8 mid-Dec. For those wondering how often E US cold has been associated with phase 8 in Dec (whether well outside, just outside, near, or inside the circle), here’s the breakdown of 3+ day long phase 8 periods in Baltimore as a representative (centrally located) E US city: For 3+ day long phase 8 (includes inside circle): 23 periods (* La Niña) 12/20-22/1974: +1* 12/19-31/1975: -4* 12/14-17/1976: -2 12/10-15/1977: -6 12/16-18/1979: -5 12/26-28/1981: -2 12/8-10/1982: -6 12/19-23/1986: -3 12/2-6/1988: +1* 12/1-4/1989: -9 12/9-18/1989: -16 12/2-4/1990: +6 12/1-7/1991: +1 12/9-14/1991: +8 12/9-12/1992: 0 12/20-25/1995: -8* 12/15-17/2000: 0* 12/21-25/2001: -1 12/5-9/2002: -15 12/1-3/2007: -4* 12/6-9/2009: -4 12/20-22/2009: -7 12/21-24/2017: +5* ——— Before analyzing the temperatures, note how the frequency of 3+ day long Dec phase 8 periods has plunged since 2009: -During 1974-2009, there were 22 three+ day long phase 8s through the 36 Decs or a frequency of 0.61/Dec. -But during 2010-2024, there was only ONE 3+ day long period or a mere 0.07/Dec, which is a minuscule 1/9 as often as that for 1974-2008! -The longest drought during 1974-2009 was a mere 4 Decs. But during 2010-24, there have been two 7 Dec droughts!@bluewave -So, based on this, although I’m hoping the latest extended EPS/GEFS are correct in projecting a 3++ day long phase 8 this Dec, I’m taking it with a grain for now. —————— Now to analyze the Baltimore temps for the 23 three+ day Dec phase 8 periods 1974-2014: -# of periods: MB 4 (17%), B 10 (43%), NN 6 (26%), A 2 (9%), MA 1 (4%) -So, there have been nearly 5 times as many B/MB periods as A/MA periods! -The average daily anomaly was -4 over the 112 days. @donsutherland1
-

E PA/NJ/DE Autumn 2025 Obs/Discussion
Duca892 replied to PhiEaglesfan712's topic in Philadelphia Region
Seeing people on the Twittersphere throwing a little hype towards December -

Occasional Thoughts on Climate Change
WolfStock1 replied to donsutherland1's topic in Climate Change
Priorities. Discussion of gender as it relates to CC is of course much more important, thus why topic 14 wasn't deferred. -
But there’s a reason for the “bad luck” and that’s the Pacific jet is very unfavorable for good storm tracks here. We saw the western ridge keep getting knocked down and therefore storms couldn’t turn the corner last winter, or we would have too much of a SE ridge or the SE ridge link up with the Greenland block which causes inland tracks.
-
Last year 2009 was my top analog, and I actually think that worked out pretty well. This year it's closer to the bottom of the list and barely made the cut. I thought I would have more time once soccer ended, I coach both my kids teams, but I took on a lot more at work and honestly I'm not sure if I'll have time to do a full in depth seasonal forecast but I did take an hour to identify the analogs using my formula. I think I am going to run a new anomaly mean plot where I weight them.
-

November 2025 general discussions and probable topic derailings ...
weatherwiz replied to Typhoon Tip's topic in New England
At some point soon it will change and we will get crushed. -
November 2025 general discussions and probable topic derailings ...
dryslot replied to Typhoon Tip's topic in New England
Apparently, But its a preliminary map and i would think they would tighten that up going forward. -
November 2025 general discussions and probable topic derailings ...
dryslot replied to Typhoon Tip's topic in New England
About sums it up lol -
 3-11” is a real range now?
 -
32.8 this morning.
-
 Gotta love the 'ole 3-11" and 1-6" forecast ranges.....must really boost scores.
 -
November 2025 general discussions and probable topic derailings ...
weatherwiz replied to Typhoon Tip's topic in New England
"EPS looks good" "EPS looks good" blah blah blah, tired of hearing it. It's the same routine every year. 1. EPS shows a big pattern change around Thanksgiving 2. Looks like EPS is delaying the pattern change to around Dec 10. 3. EPS is delaying the pattern change to around Christmas, but don't worry, it's delayed not denied. 4. Well we're into the New Year, but winter us just about to begin. EPS shows the pattern changing in a big way by the 10th. 5. Well looks like the pattern change doesn't occur until the end of Jan but we should be in store for a big Feb...look at that trough on the EPS!!!! 6. winter's over. just couldn't cash in. March comes, finally get a good pattern - now a bit too warm outside of northern New England and elevation. Rinse, wash, repeat. -
There is a significant lag between an increase in global atmospheric CO2 & CH4 concentrations and an increase in mean continental surface atmospheric temperature. Most data sources show global temperature increased most significantly after about 1920. In the US, there appears to have been mean warming in the early part of the 20th century, following by cooling through ~ the 1970s, followed by the period of pronounced warming that we're in. The 1930s were warmer than parts of earlier centuries for sure. This was likely the result of a combination of astronomical and anthropogenic climate factors. The rate and magnitude of current warming is much more significant than previously observed during historical times. The data that bluewave showed does suggest that low snow years in the 1930s were more related to total precipitation than to temperature compared to the present. Though temperature in the 1930s was likely more of a factor than during the 18th or early 19th centuries. And I suspect persistent under-measurement of snowfall was also a factor.