All Activity
- Past hour
-
0.97” from the storm tonight, 8.13” for the month so far.
-
Ended up with just under 2.5 inches of rain. Five miles to my southeast got 5+ inches!
-
Wild pics from takoma park and silver spring. Sligo parkway was part of the creek today.
-
With how much rain there's been of late, I'd say that's a good thing. I hope it continues weakening. Doesn't look like a big rainmaker at this point in any event, although there are still some areas of embedded heavier downpours where I guess a quarter to half inch could fall.
-
That was from one of our county flood sensors near Sligo Creek Pkwy & New Hampshire Ave (MD 650). I've never seen water levels rise that quickly at that location. I actually wound up requesting the upgrade to a flash flood emergency. Our flood sensors inside the beltway just went bonkers so fast. Cabin John Branch, Rock Creek, Sligo Creek, and Northwest Branch just started raging in under half an hour. This was the worst flash flood event I have ever worked in my entire career. Had this persisted for just another 20 to 30 minutes, we would've had real problems in Montgomery County. The flood sensors we installed, combined with the Layhill and College Park mesonet sites raised alarm bells quickly, which resulted in us getting roads closed and water rescue assets staffed quickly. It was one of the few times in my career that I actually felt helpless as things went sideways.
-

2025-2026 ENSO
TheClimateChanger replied to 40/70 Benchmark's topic in Weather Forecasting and Discussion
See this kind of rhetoric is unnecessary. The NCEI trend for Southeast Lower Michigan is in close agreement with the Ann Arbor and Detroit data, with the exception that the mean temperature is somewhat below those sites (since the district as a whole is somewhat closer), even without any adjustments for discontinuities (location change) or changes in equipment or time of observations. Maybe a case could be made that the January trend is a little inflated, but all of these sites still show warming in January. And for the annual change, it's quite close to NCEI's numbers. It should be noted that there is NO time of observation bias in the Ann Arbor data - unlike most cooperative observers, they have maintained a consistent evening observation time. Of course, there's none in the Detroit data either (consistent midnight-midnight day, per Weather Bureau standards), but there are a couple of important site changes. -
But there’s no good reason imho to not be that way online as long as most others are that way in their interactions. People look at this in different ways. Some say that the real person may show up better online because of less inhibition to be oneself. OTOH, there are many trolls online.
-

July 2025 Discussion-OBS - seasonable summer variability
SACRUS replied to wdrag's topic in New York City Metro
dew point temps up to 70 here -
Hey Barry, He’s in my list of posters with a bearish bias. If you took an avg of bull cat5 and bear 57, do you think they’d average neutral? Interesting fact: When baby boomer 57 joined there, Gen. Zer cat5 was near birth! Cat5 was born near the time that board was born. As you can see I called out bias in these two cases despite big age diffs.
-
The mcs really broke/dried up by the time it got here. Just a trace of rain.
-

2025-2026 ENSO
40/70 Benchmark replied to 40/70 Benchmark's topic in Weather Forecasting and Discussion
He had an insight that there tends to be a mismatch period from the prevailing MC forcing when the MJO is amplified in the MC during the month of October, as it was last year. -
July 2025 Discussion-OBS - seasonable summer variability
SACRUS replied to wdrag's topic in New York City Metro
Highs EWR: 83 ISP: 83 LGA: 83 JFK: 82 * No intra hour high TEB: 82 PHL: 82 NYC: 81 New Brnswck: 80 ACY: 79 BLM: 79 TTN: 77 -
Getting slammed by storms
-

2025-2026 ENSO
michsnowfreak replied to 40/70 Benchmark's topic in Weather Forecasting and Discussion
That's the beauty of meeting in person. We were as friendly as can be. -

2025 Atlantic Hurricane Season
BarryStantonGBP replied to BarryStantonGBP's topic in Tropical Headquarters
He's way too bearish NGL -

2025-2026 ENSO
Stormchaserchuck1 replied to 40/70 Benchmark's topic in Weather Forecasting and Discussion
I don't even get where he stressed that it would be a mis-match Winter. I think every year it is said, "there is also the chance that mismatch could occur at sometime if X and Y", but that's just being wishy-washy imo. - Today
-
Another miserable July day. High of 96 with dew points around 80 most of the day
-

July 2025 Obs/Disco ... possible historic month for heat
WxWatcher007 replied to Typhoon Tip's topic in New England
I think wall to wall 70 is going to be very hard, even 20 years from now, but there’s no doubt one of the biggest changes in our summers the last 40 years has been the humidity. -
2025-2026 ENSO
TheClimateChanger replied to 40/70 Benchmark's topic in Weather Forecasting and Discussion
Heck, it aligns almost perfectly with the Detroit threaded record. A touch colder in the early decades, but not surprising considering given the siting/location of the Detroit City record in that era. In recent years, it has shown somewhat less warming, although the broad trends align VERY closely. -

July 2025 Obs/Disco ... possible historic month for heat
BrianW replied to Typhoon Tip's topic in New England
Yes. Many feel that way. -
2025-2026 ENSO
TheClimateChanger replied to 40/70 Benchmark's topic in Weather Forecasting and Discussion
I don't CHERRY PICK anything. I also am not opposed to using raw data to show broad trends, but it's important to be mindful of the possible biases in the data being presented. How is noting a bias in the data being biased? As far as any problem with the Ann Arbor data, I'm not seeing it. It's right in line with the rest of southern Michigan for data from the late 1880s - 1890s period, which is freely accessible from NCEI. -
Hey Barry, 57, a Houston area regular, is generous with his postings and is very knowledgable along with decades of experience with tropical forecasting. He runs his own tropical forecasting service. He’s one of the original regulars. So, for good reason, he’s very well respected and I’m glad he posts as much as he does. However, I do feel he tends to have a bit of a bearish lean in some of his public posts there. Again, imho as it’s subjective. And it’s by no means for nearly all posts. In addition, many times his bearish posts verify very well. I think that his desire to have quiet weekends sometimes influences his posts there toward the bear. Keep in mind that I prefer BB posters exhibit neither an explicit bearish nor an explicit bullish bias. I try my best to be perceived that way.
-
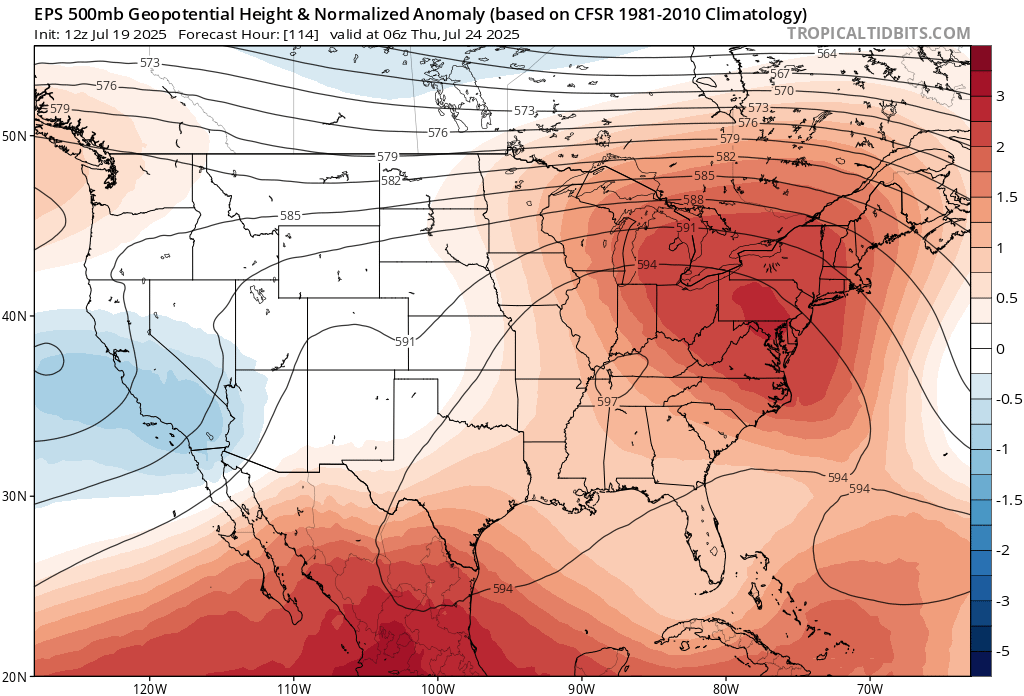
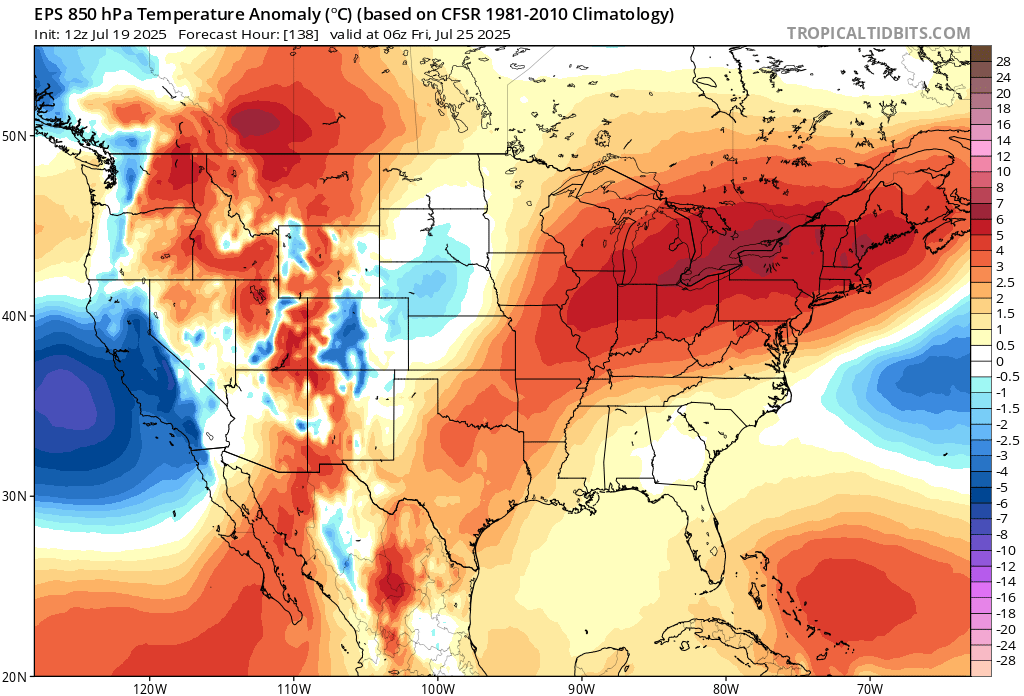
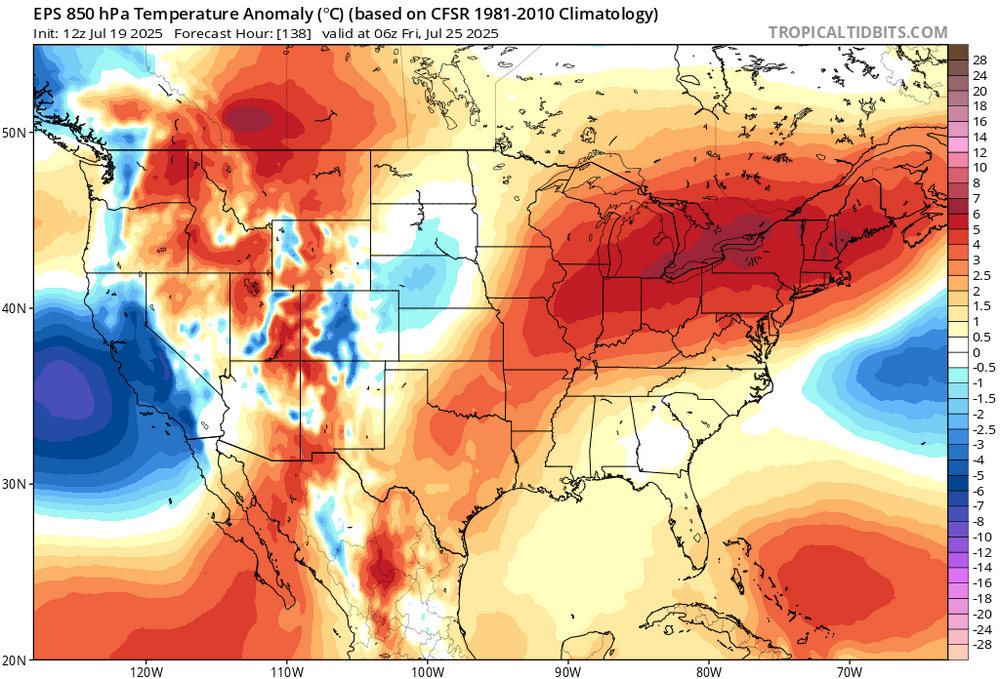
Shades of 2011 where we see the extreme June ridge return for a second time in late July, but further west this time.

-
I think the biggest surprise for me was how few 70F+ dewpoints there were in 2016 despite that being a scorching summer (hottest on record at Detroit). Only 9 hours at this point at Detroit, and 1 hour at Pittsburgh. Also, somewhat surprising, through yesterday's date, 2016 was 1F cooler than this summer to date at Detroit. It's been 10 years so my memory is getting a little fuzzy, but it must have been an all out torch from here on out that year.
-
2025-2026 ENSO
Stormchaserchuck1 replied to 40/70 Benchmark's topic in Weather Forecasting and Discussion
It was a legitimate Winter cold period. There was not a SE ridge under -NAO like the last few years had, had. I realize NYC was not at the epicenter, but that doesn't mean anything less about it.. there were Winter time temperatures late November through late February, it ended very quickly after that but it was also the first prolonged below average period like that in more than several years.. I was thinking the cold Summer H5 +NAO last Summer might create a -EPO pattern, but I was a little taken by the +PNA and how the Fall -PDO basically had no effect on Winter temps until March. Phoenix broke their previous Summer record by a lot last year.. more than 40 days of consecutive 100F+ over year number 2. Those analogs were very +PNA Dec/Jan, I guess it had valiance, but I was a little skeptical.