All Activity
- Past hour
-
And here's the part that defies common sense. So if this is the climate, you would think you WOULDN'T see snow and cold south of here as much...and yet over the last 7-8 years places south of Baltimore, and then places WAY south...have seen more snow. Like you would think that boundary shifting north=warmer and less snow south. You'd think you wouldn't see Texas freezing in 2021, onorthern. AL snowing last year, or again, Southern part of the forum having more snow than the northern. The whole thing is counterintuitive.
-
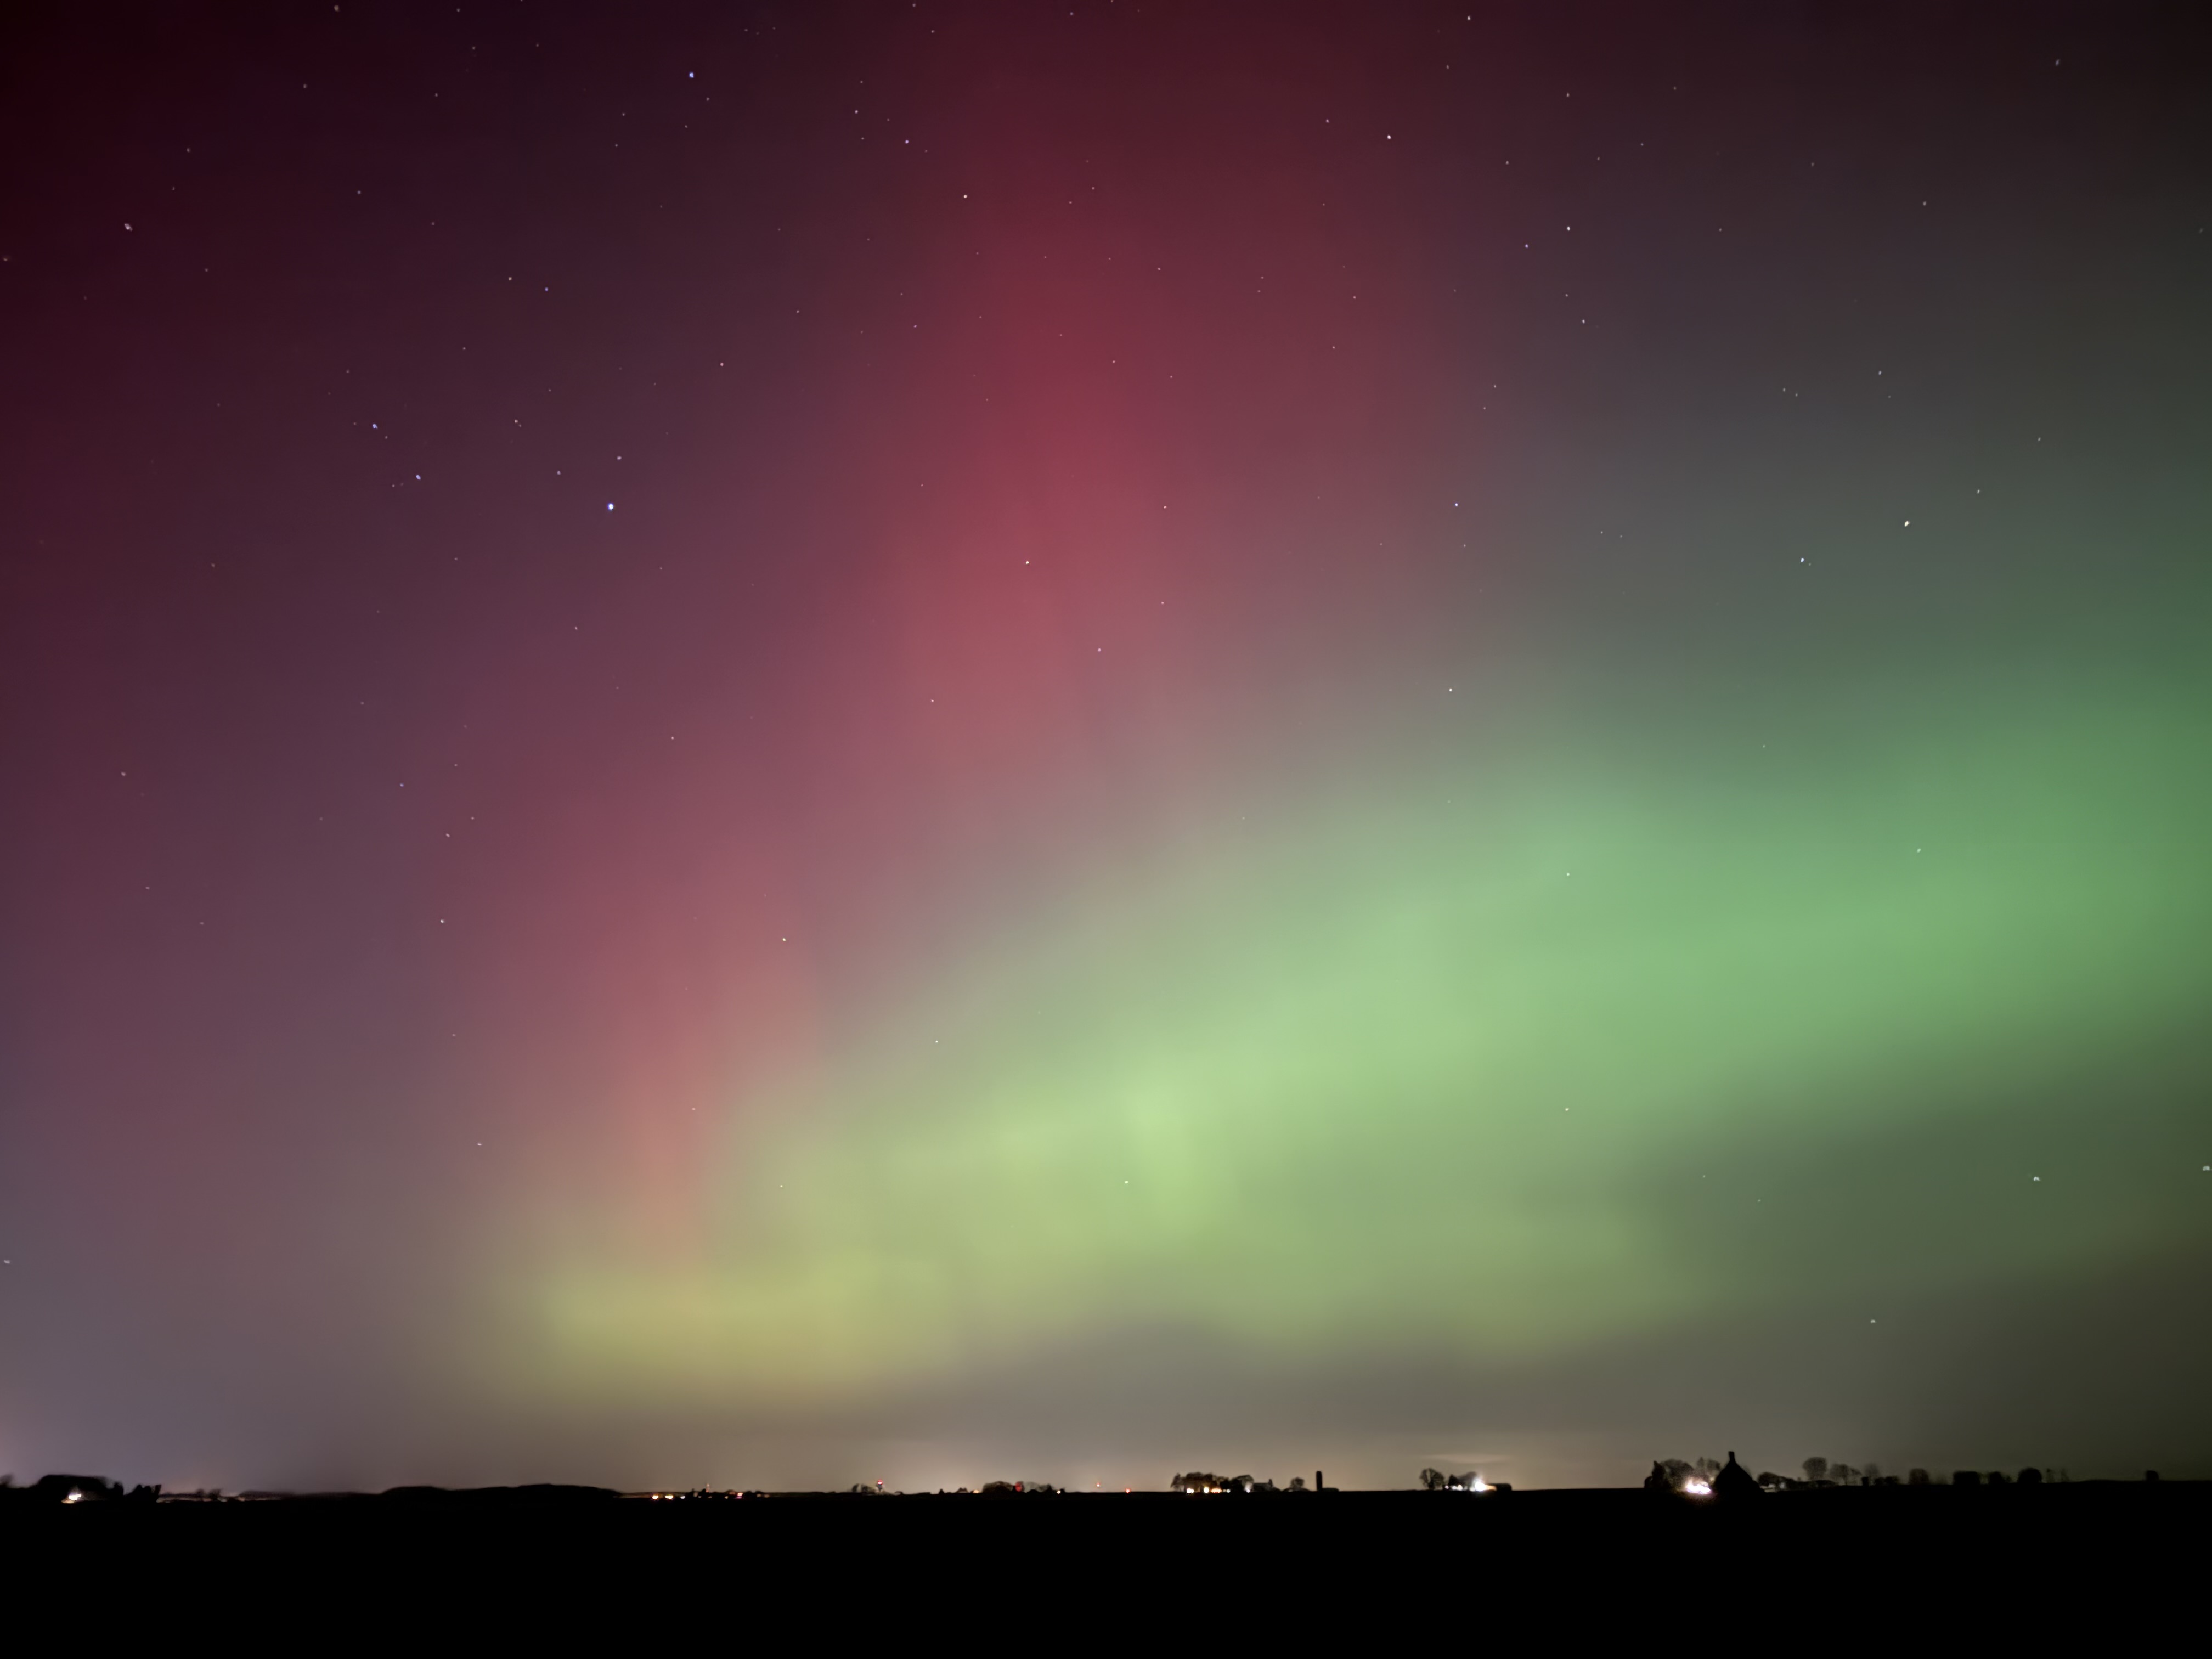
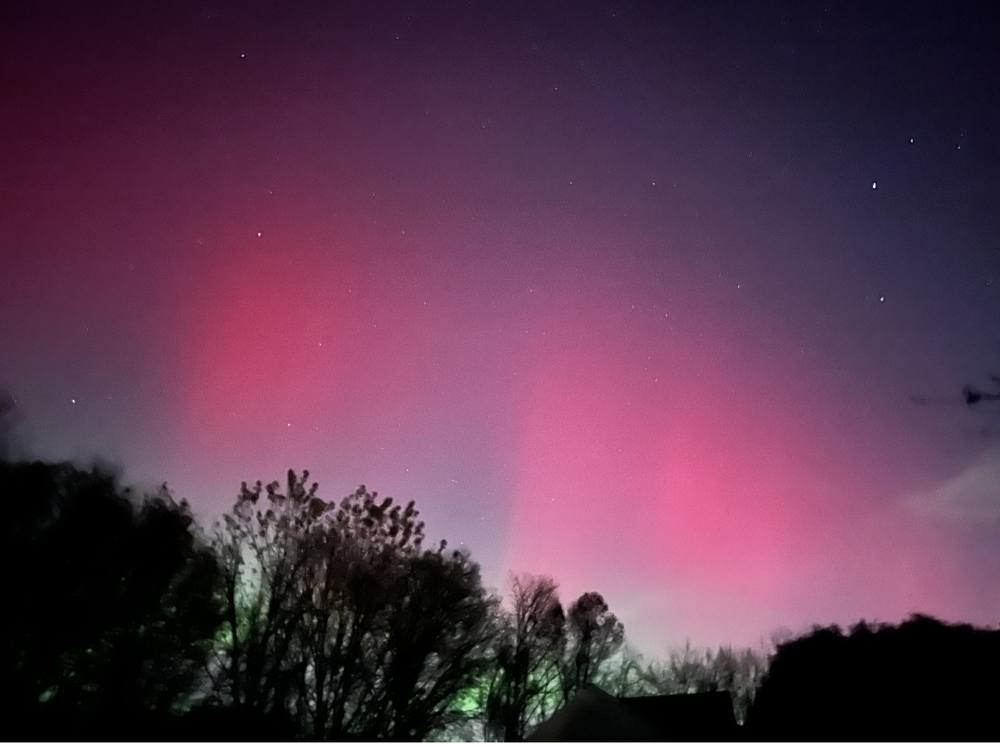
Rolled the kids out of bed last night a drove a couple miles out of town. They were mesmerized.

-
Hes always on that train. Just like youre always not along with Bluewave. We got it guys, lots of narratives. But the weather always comes out in the wash. You’ll get your 4 inches in December and Id take the high end of Accuweather seasonal fluff
-
WeatherBell CFS...
-
If that streak is gonna break I guess we can't count on it breaking in a la nina. Even dang Atlanta got flurries before we did. It baffles me to no end how the supposed boundary is inching "north" yet places just south--or WAY south--of here have seen more snow than we have over the last 8 years. Just on a commonsense level that makes zero sense. You'd think warmer would mean that wouldn't happen as much and yet here we are!
-
Last October was definitely nuts. Can anyone give me an idea of what the cloud cover will look like tn in NWCT?
-

2025-2026 Fall/Winter Mountain Thread
WeatherHawk replied to Buckethead's topic in Southeastern States
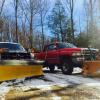
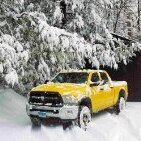
Had about 1.5" on the East Side of Elk Knob SP, about 7 miles North of Boone. Hard to tell from all the winds, lows were down around 17 over Monday night. Looking forward to a great winter with the crew on here! Best wishes folks! -
November 2025 general discussions and probable topic derailings ...
UnitedWx replied to Typhoon Tip's topic in New England
Seems it's always better to have it decaying otherwise it's congrats Snookie -

2025-2026 ENSO
donsutherland1 replied to 40/70 Benchmark's topic in Weather Forecasting and Discussion
It does seem to become skillful within a week of the following month. -
2025-2026 Fall/Winter Mountain Thread
WeatherHawk replied to Buckethead's topic in Southeastern States
Excellent shot! Believe we're expected to have more ab tonight! -
2025-2026 ENSO
donsutherland1 replied to 40/70 Benchmark's topic in Weather Forecasting and Discussion
Here's the data for December vs. January-April snowfall for New York City for La Niña winters 1979-80 through 2024-2025. 2024-2025 is officially listed as cold neutral. December 2024 had 2.8" of snow.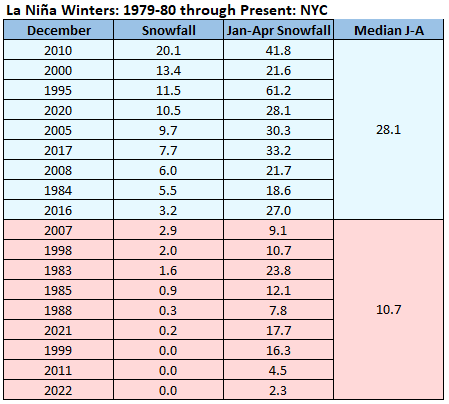
-
Sigh. Another winter of seeing places well to the south cash in while we are missed?
-

E PA/NJ/DE Autumn 2025 Obs/Discussion
Newman replied to PhiEaglesfan712's topic in Philadelphia Region
The red pillars were naked eye visible, couldn't believe it! Hoping tonight is even better, but we'll see. -
The cool departures EWR: 11/11 : 42/ 33 (-10) NYC: 11/11: 41 / 22 (-12) LGA: 11/11: 43 / 34 (-13) JFK: 11/11: 42 / 33 (-10) TTN: 11/11: 42 / 30 (-10)
-
Records: Highs: EWR: 74 (2022) NYC: 76 (1879) LGA: 69 (2022) JFK: 72 (2022) Lows: EWR: 25 (2019) NYC: 25 (2019) LGA: 27 (2019) JFK: 25 (2019) Historical: 1906 - The mercury soared to 106 degrees at Craftonville, CA, a November record for the U.S. (The Weather Channel) 1959 - Between Noon on the 11th and Noon on the 12th, a winter storm buried Helena, MT, under 21.5 inches of snow, which surpassed their previous 24 hour record by seven inches. (The Weather Channel) 1968 - A severe coastal storm produced high winds and record early snows from Georgia to Maine. Winds reached 90 mph in Massachusetts, and ten inches of snow blanketed interior Maine. (David Ludlum) 1974 - A great Alaska storm in the Bering Sea caused the worst coastal flooding of memory at Nome AK with a tide of 13.2 feet. The flooding caused 12 million dollars damage, however no lives are lost. (David Ludlum) 1987 - Heavy snow spread across much of New England. Totals in Massachusetts ranged up to 14 inches in Plymouth County. The seven inch total at the Logan Airport in Boston was their highest of record for so early in the season, and the 9.7 inch total at Providence RI was a record for November. Roads were clogged with traffic and made impassable as snowplow operators were caught unprepared for the early season snowstorm. (Storm Data) (The National Weather Summary) 1988 - Thunderstorms developing ahead of a cold front produced severe weather in the Lower Mississippi Valley during the afternoon and early evening hours. Thunderstorms produced wind gusts to 80 mph at Bovina MS. Morning thunderstorms drenched Atlanta TX with more than four inches of rain. (The National Weather Summary) (Storm Data) 1989 - Thirty-three cities reported record high temperatures for the date as readings soared into the 70s and 80s from the Southern and Central Plains to the Southern and Middle Atlantic Coast Region. The afternoon high of 80 degrees at Scottsbluff NE was a record for November, and highs of 76 degrees at Rapid City SD and 81 degrees at Chattanooga TN were the warmest of record for so late in the season. (The National Weather Summary) (Storm Data) 1993 A winter storm moved through the area on November 12th and 13th. A wintry mix of precipitation in the form of freezing rain, sleet, and snow began during the afternoon on the 12th in western portions of Minnesota, while heavy snow fell in a swath from southwest South Dakota through central and northeast parts of the state, with generally four to eight inches reported. Freezing rain also preceded the snow in south-central South Dakota. Significant accumulation of ice occurred within about a 70-mile wide area from west central Minnesota into the Arrowhead region. Up to five inches of snow fell on top of the ice, making travel extremely hazardous. In South Dakota, locally heavier snowfall amounts included 12 inches at Midland and 10 inches central Hughes County. Several schools and other community events were closed due to the ice and snow. In south central South Dakota, trees were damaged by heavy ice, some of which fell on power lines, causing an outage. Other snowfall amounts include; 8.0 inches in Blunt; 7.0 inches in Murdo and near Victor; and 6.0 inches near Onida, Faulkton, Highmore, and Leola. 2003 - Thunderstorms developed in southern California and produced torrential downpours across parts of the Los Angeles area. More than 5 inches of rain fell in just 2 hours in southern Los Angeles, producing severe urban flooding. Small hail also accompanied the storms, accumulating several inches deep in some areas of the city. Nearly 115,000 electrical customers lost power as the storms affected the area (Associated Press).
-
12z mesos look dicey on central Md cloud cover. Better for NoVA and southern MD.
-
44 / 28 clouds holding tight. Warmer tomorrow and then a bit back and forth towards / after mid month overall near / warmer than normal.
-
 What In the sam hell?
 -

E PA/NJ/DE Autumn 2025 Obs/Discussion
FPizz replied to PhiEaglesfan712's topic in Philadelphia Region
Wow, that is crazy for Florida -

November 2025 general discussions and probable topic derailings ...
dendrite replied to Typhoon Tip's topic in New England
It’s just light dinky stuff. -
E PA/NJ/DE Autumn 2025 Obs/Discussion
Newman replied to PhiEaglesfan712's topic in Philadelphia Region
Took this at 9:13 PM EST last night from Florida From my folk in Fleetwood around the same time:
-
Great stuff, Don! Since I had seen similar results in looking at the following for RDU big snows, I figured you and others might find this interesting: 21 RDU 6”+ snowstorms since 1950 (Niña or -neutral ENSO bolded)1/19/1955 Niña neut PNA, neut AO, moderate -NAO12/11/1958 mod +PNA, neut AO and NAO3/2-3/1960 mod -PNA, neut AO and NAO3/9/1960 weak -PNA, strong -AO, neutral NAO2/26/1963 -neutral strong +PNA, mod +AO, neutral NAO1/26/1966 neut PNA, strong -AO and -NAO2/9/1967 -neutral mod +PNA, weak +AO, moderate +NAO3/1/1969 strong +PNA/-AO, moderate -NAO1/7-8/1973 weak +PNA, neut AO, strong -NAO2/18-9/1979 neut PNA/AO/NAO3/1-2/1980 neut PNA/AO, moderate +NAO3/24/1983 mod +PNA/-AO, neutral NAO2/6/1984 -neutral mod +PNA/+AO, strong +NAO1/7/1988 mod +PNA, neut AO, weak +NAO2/17-8/1989 Niña neut PNA, strong +AO/+NAO1/24-5/2000 Niña mod +PNA, neut AO, moderate -NAO1/2-3/2002 -neutral strong +PNA, neut AO, moderate -NAO2/26-7/2004 neut PNA, strong -AO, weak -NAO12/26/2010 Niña weak -PNA, strong -AO, moderate -NAO1/17/2018 Niña neut PNA, weak +AO, strong +NAO12/9-10/2018 mod +PNA, neut AO, moderate +NAO—————————For the 21 storms-11 (52%) +PNA, 7 (33%) neutral PNA, 3 (14%) -PNA-7 (33%) +NAO, 6 (29%) neutral NAO, 8 (38%) -NAOSo, whereas 52% had a +PNA vs only 14% with a -PNA, 38% had a -NAO vs 33% with a +NAOSo, whereas there were almost 4 times as many with a +PNA vs a -PNA, -NAO vs +NAO has been much more balanced.————The above is for all ENSO.What about for just -ENSO?-5 (56%) +PNA, 3 (33%) neutral PNA, 1 (5%) -PNA-4 (44%) +NAO, 1 (11%) neutral NAO, 4 (44%) -NAOSo, whereas 56% had a +PNA vs only 5% with a -PNA, 44% had a -NAO vs 44% with a +NAOSo, whereas there were 5 times as many with a +PNA vs a -PNA, -NAO vs +NAO has been totally balanced. ————— I found similar results for Greensboro and Atlanta. Bottom line: in the SE US, a +PNA is a bigger driver of big snowstorms than is a -NAO.Daily PNA link: https://ftp.cpc.ncep.noaa.gov/cwlinks/norm.daily.pna.index.b500101.current.ascii Daily NAO link: https://ftp.cpc.ncep.noaa.gov/cwlinks/norm.daily.nao.index.b500101.current.ascii ———— *Edit: Interestingly, looking back at big storms at RDU and GSO, the last 6 (2014-18) were all with a moderate to strong +NAO! So, there hasn’t been even one 6”+ snow at either RDU or GSO with a -NAO (even a weak one) since way back on 12/26/2010! This could, of course, be from randomness. But I’m not sure about that considering what @bluewavehas said about -NAO ridges tending to hook up with SE ridges more often than in the past. Hmmmm…. Edit #2: I just noticed this for the 21 RDU big snowstorms for the AO:5 +AO, 11 neutral AO, 5 -AOSo, neutral has been favored.
-

E PA/NJ/DE Autumn 2025 Obs/Discussion
LVblizzard replied to PhiEaglesfan712's topic in Philadelphia Region
Hearing on social media that tonight’s solar storm could be even more intense than last night. It looks like there will be some clouds around but nothing to significantly impede aurora viewing. -

November 2025 general discussions and probable topic derailings ...
weatherwiz replied to Typhoon Tip's topic in New England
IMO, the expansion of the western Pacific warm pool (which Ray did a great discussion on within his winter outlook, which I will hopefully finish reading today or tomorrow and comment on) in recent decades probably elicits far more weight on the global regime versus ENSO (maybe even a stronger ENSO event) given the expansion of 29-30C SSTs which is going to contribute to a great deal of convection and latent heat release...oh and add in the regime of the WHWP. -

November 2025 general discussions and probable topic derailings ...
CoastalWx replied to Typhoon Tip's topic in New England
Find me some weather excitement.