All Activity
- Past hour
-
See attachment for PDS bliz and ice storms. Goes into effect 10/1/26. I thought the NWS was trying to *reduce* the number of types of watch/warning products b/c there were too many. For instance, Blizzard Watch was removed several years ago. I am not a fan of PDS b/c it diminishes those events not labeled such that can be just as impactful. It's like Tornado Emergency. First, all tornadoes are emergency situations that require immediate action. Second, hearing "only" a tornado warning can be perceived as not as urgent to many. So a PDS blizzard or ice storm, same thing. And what exactly constitutes a PDS really? It is not always due to the meteorological severity or hard numbers. If a large population is impacted, does that mean a PDS is warranted. It's like saying a smaller population is less important than a larger one. Meteorological intensity and impact are two different things and not necessary correlated. I can just see PDS being overused from factors that have nothing to w/ the wx event itself. And it gives an excuse for the media and all the hype masters out there to ratchet things up even more, which promotes warning apathy further. The idea of PDS may look good on paper and in theory, but how it is handled in a practical sense in reality is an entirely different ballgame, and the way wx is handled these days in itself as if all inclement wx is "extreme," "unusual," and "not supposed to happen?" The ordinary is turned into the extraordinary far too often. What's next, a PDS for a hurricane landfall? Dense fog? Dust storm? More warning is not necessary better. There comes a point of diminishing returns. pds.pdf
-
-
Highs: PHL: 81 TEB: 81 New Nrnsck: 77 TTN: 76 NYC: 75 ACY: 75 EWR: 74 LGA: 74 JFK:73 ISP: 73 BLM: 72
-
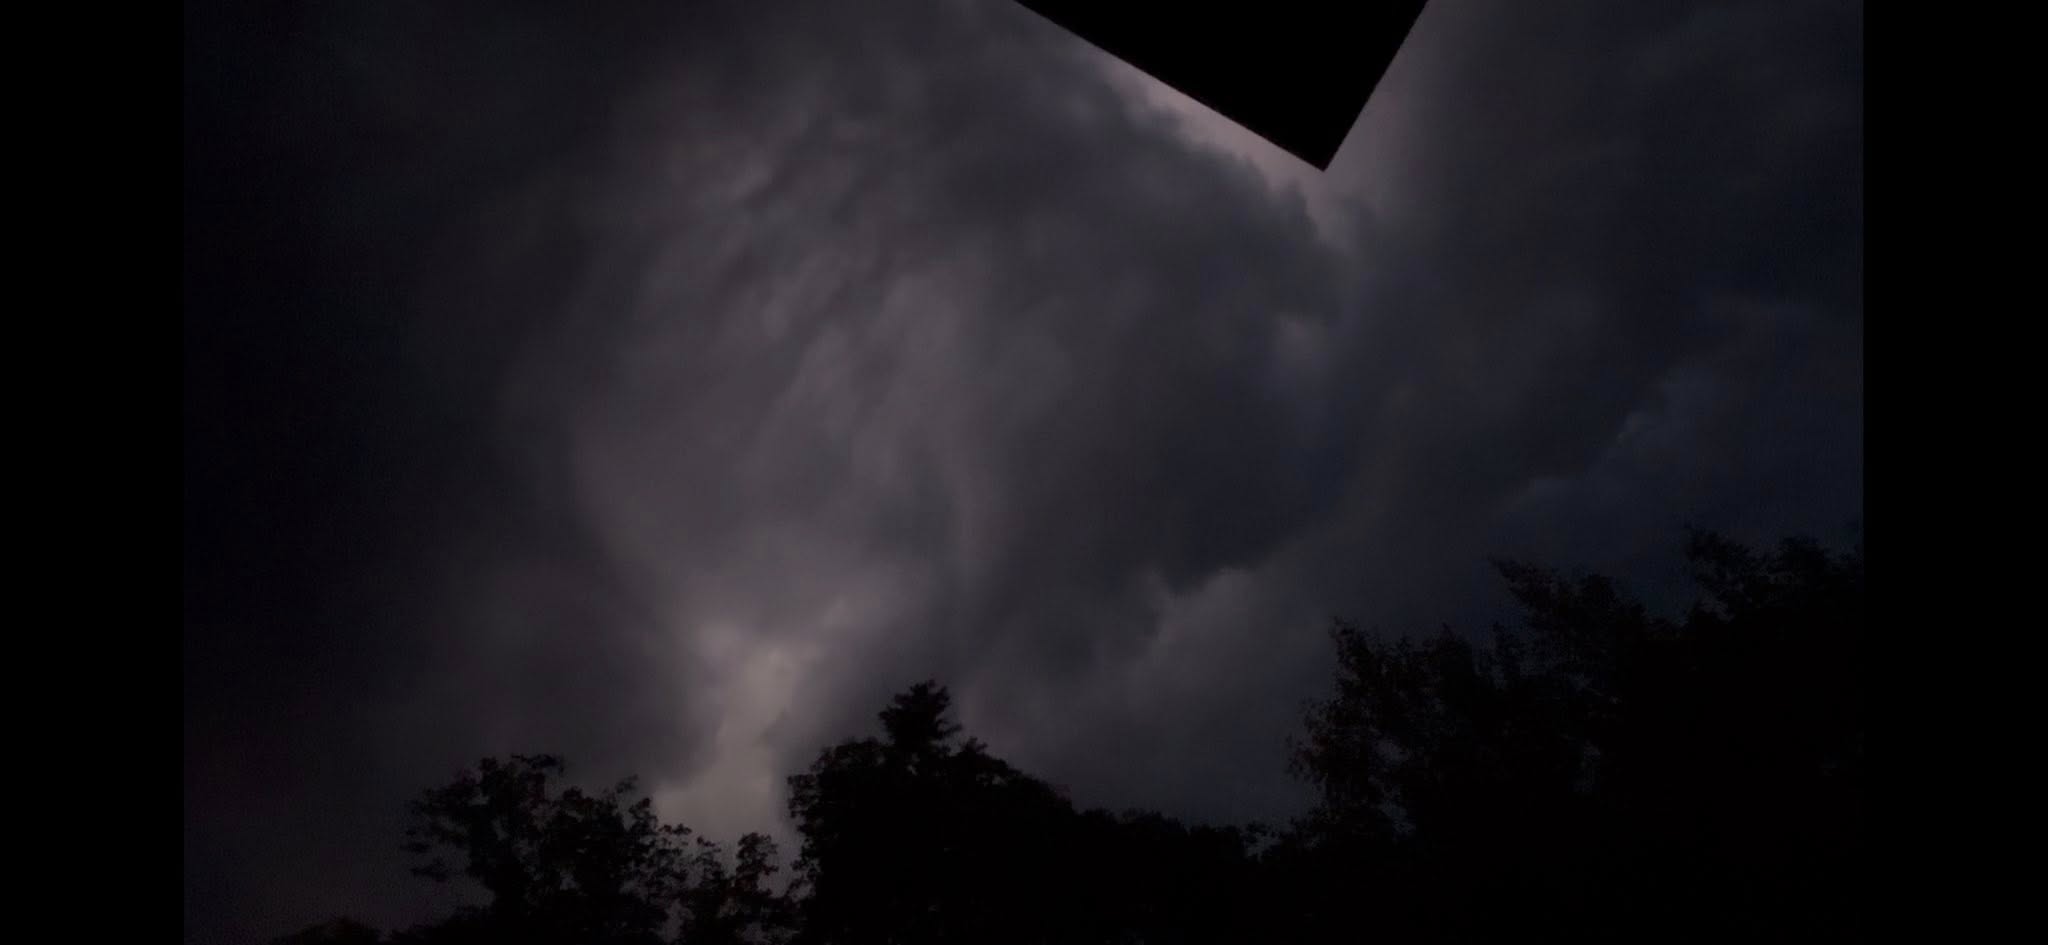
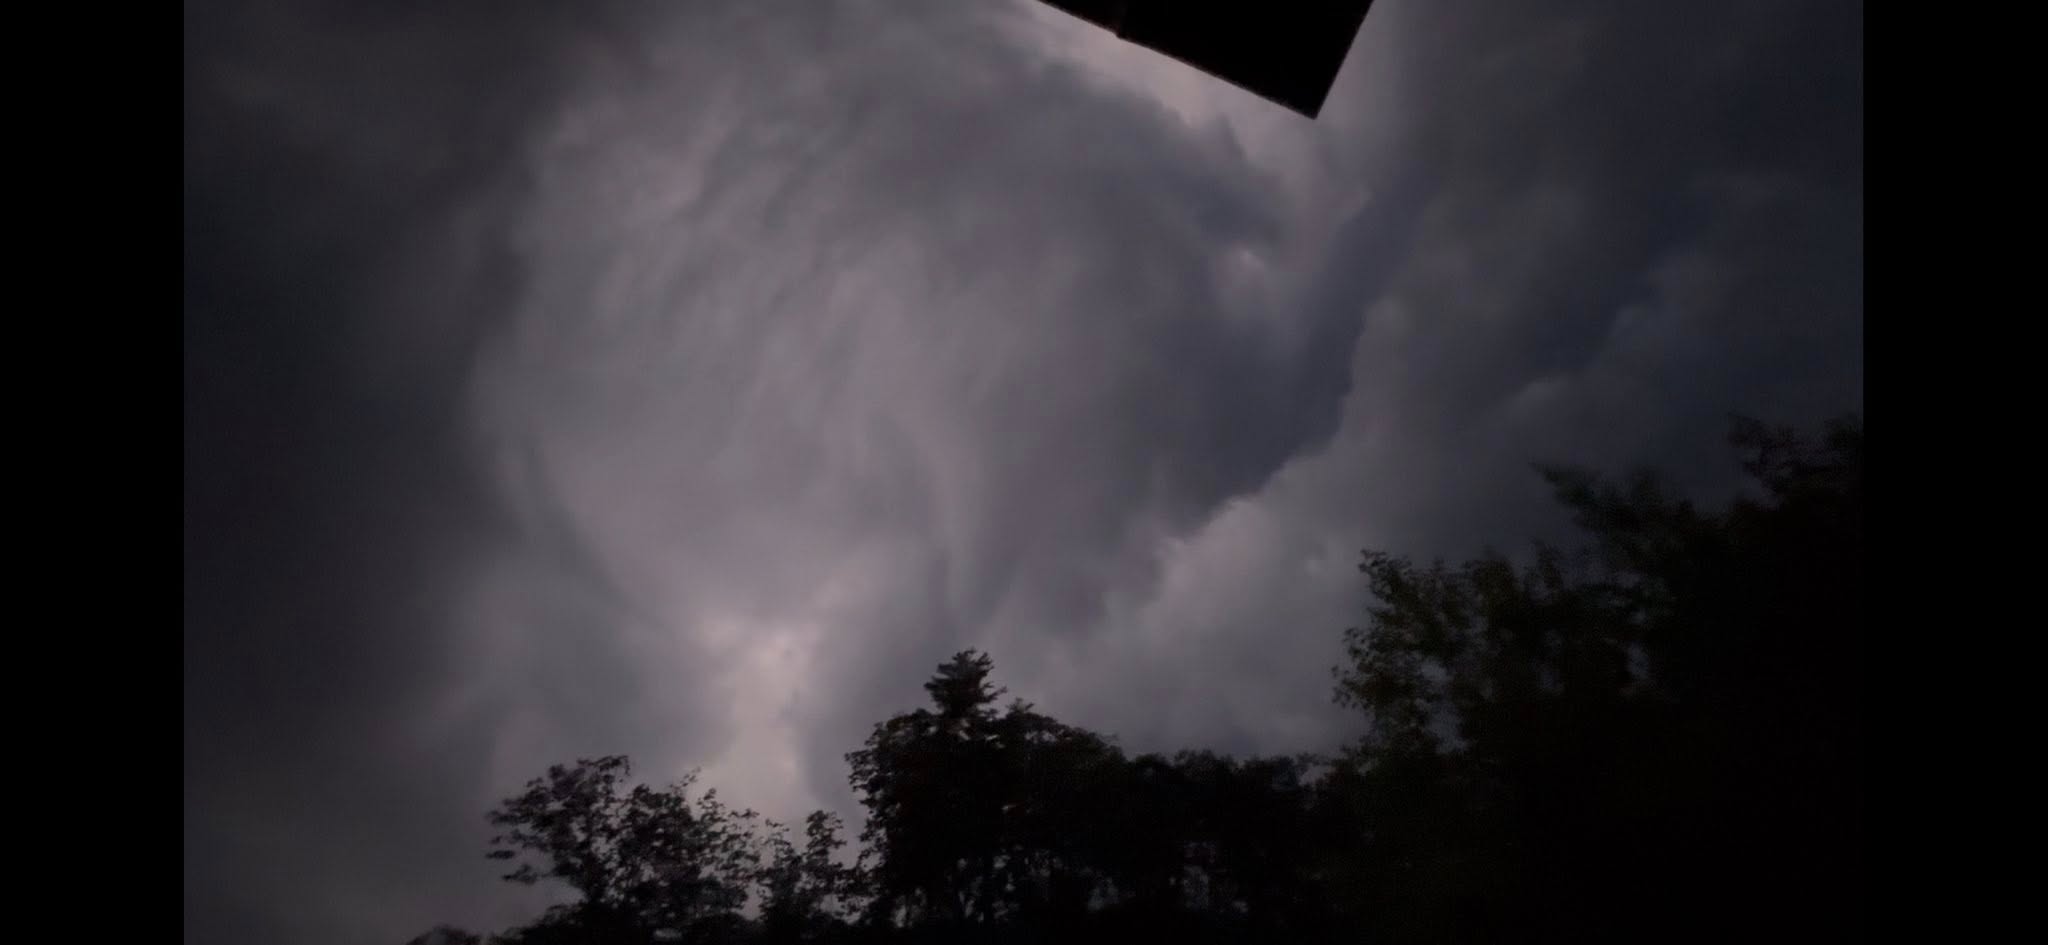
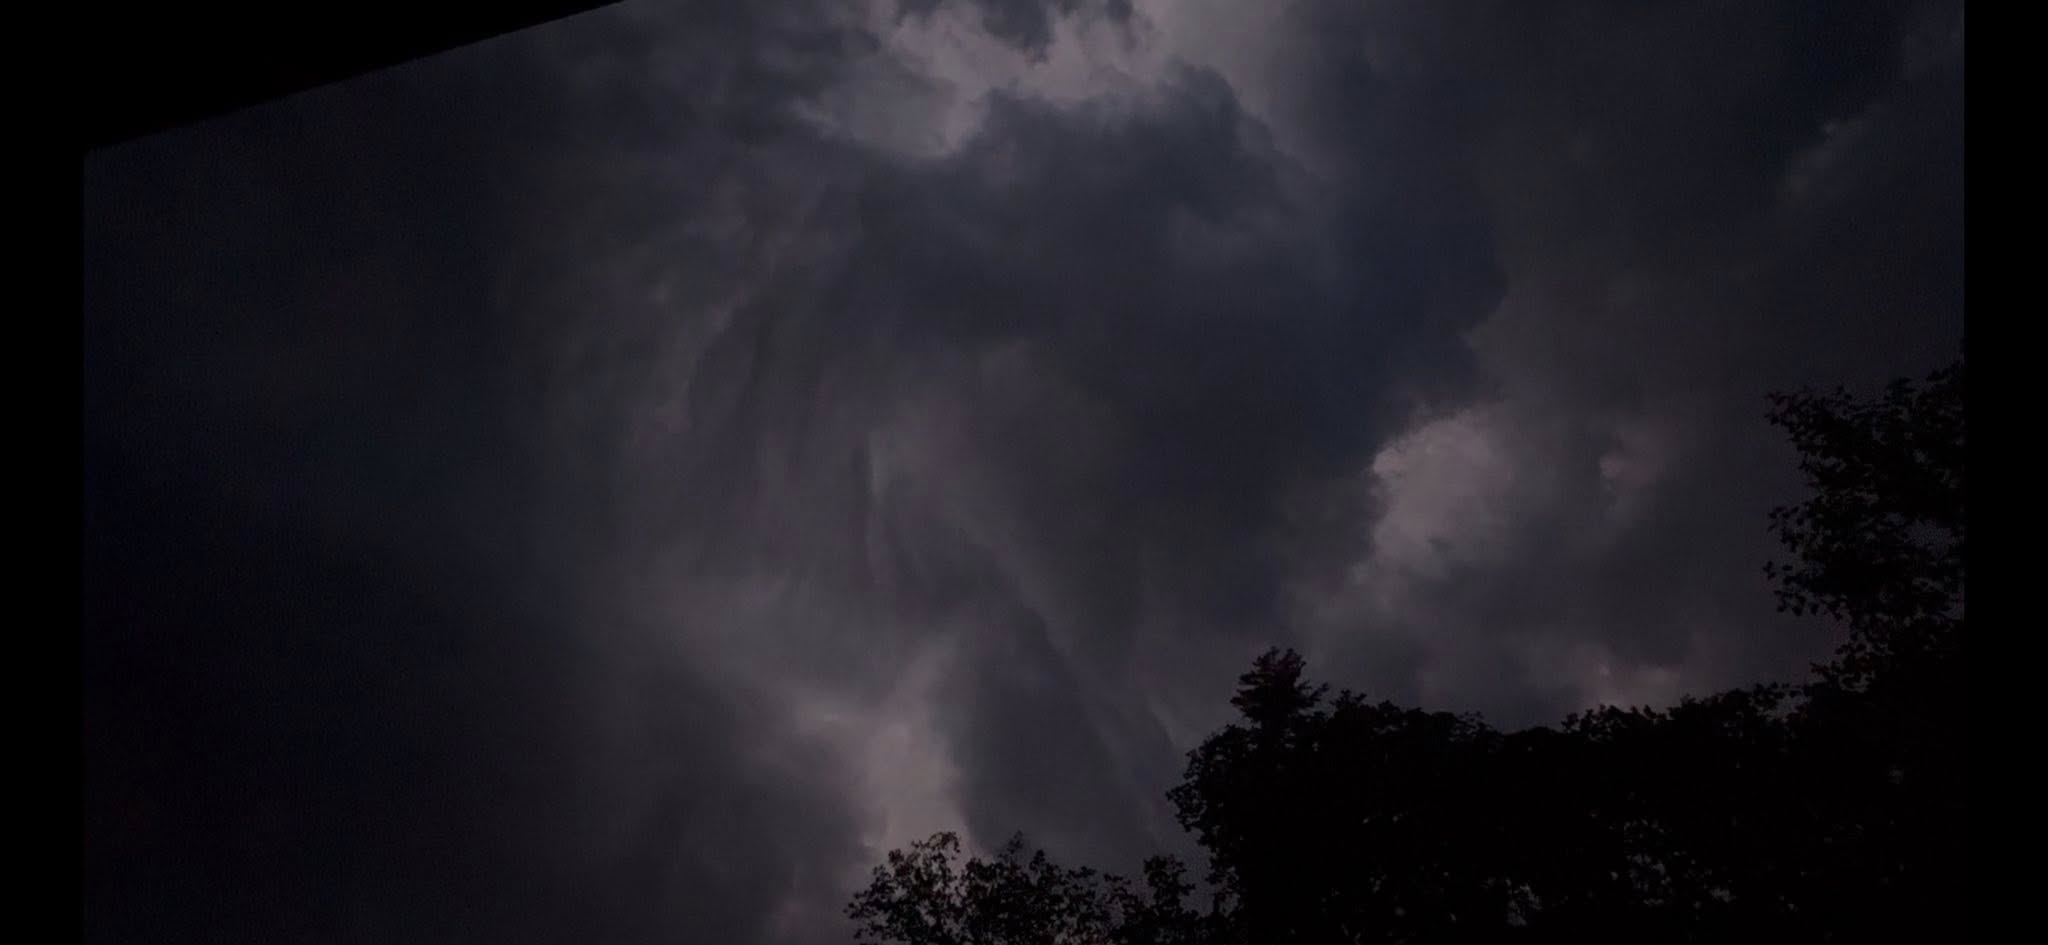
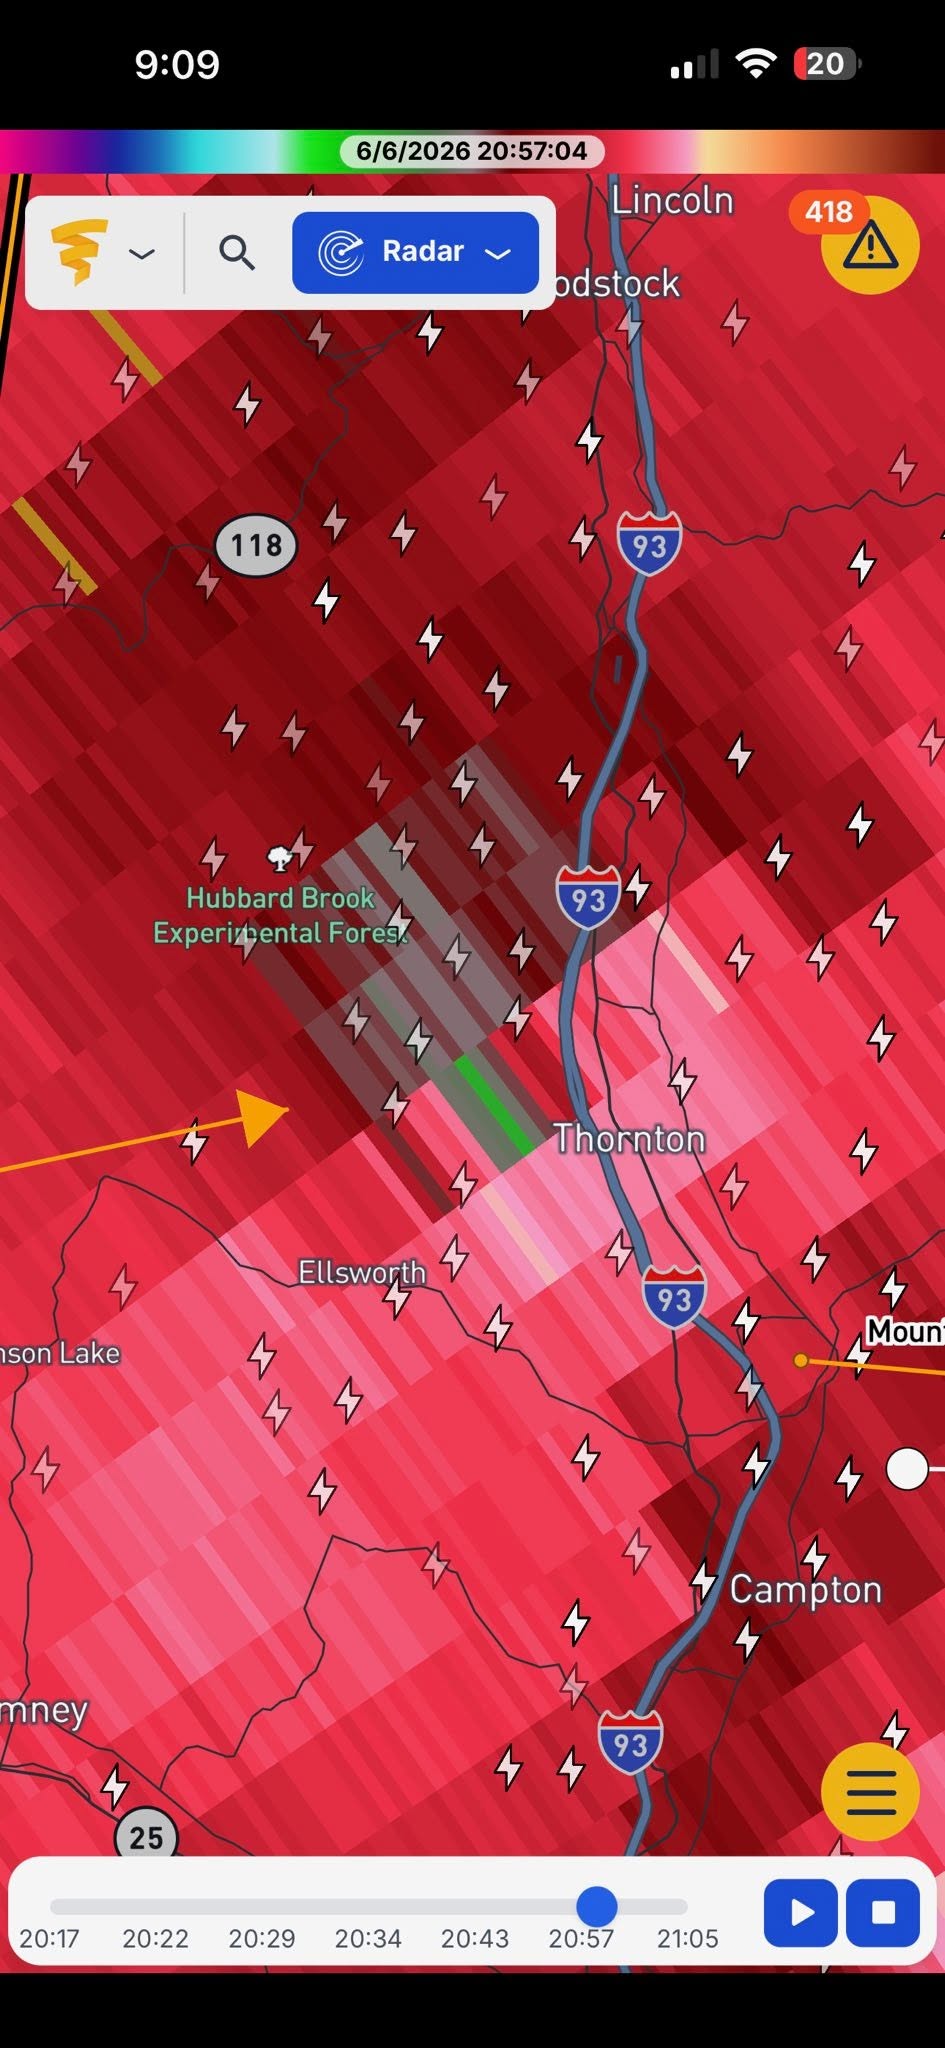
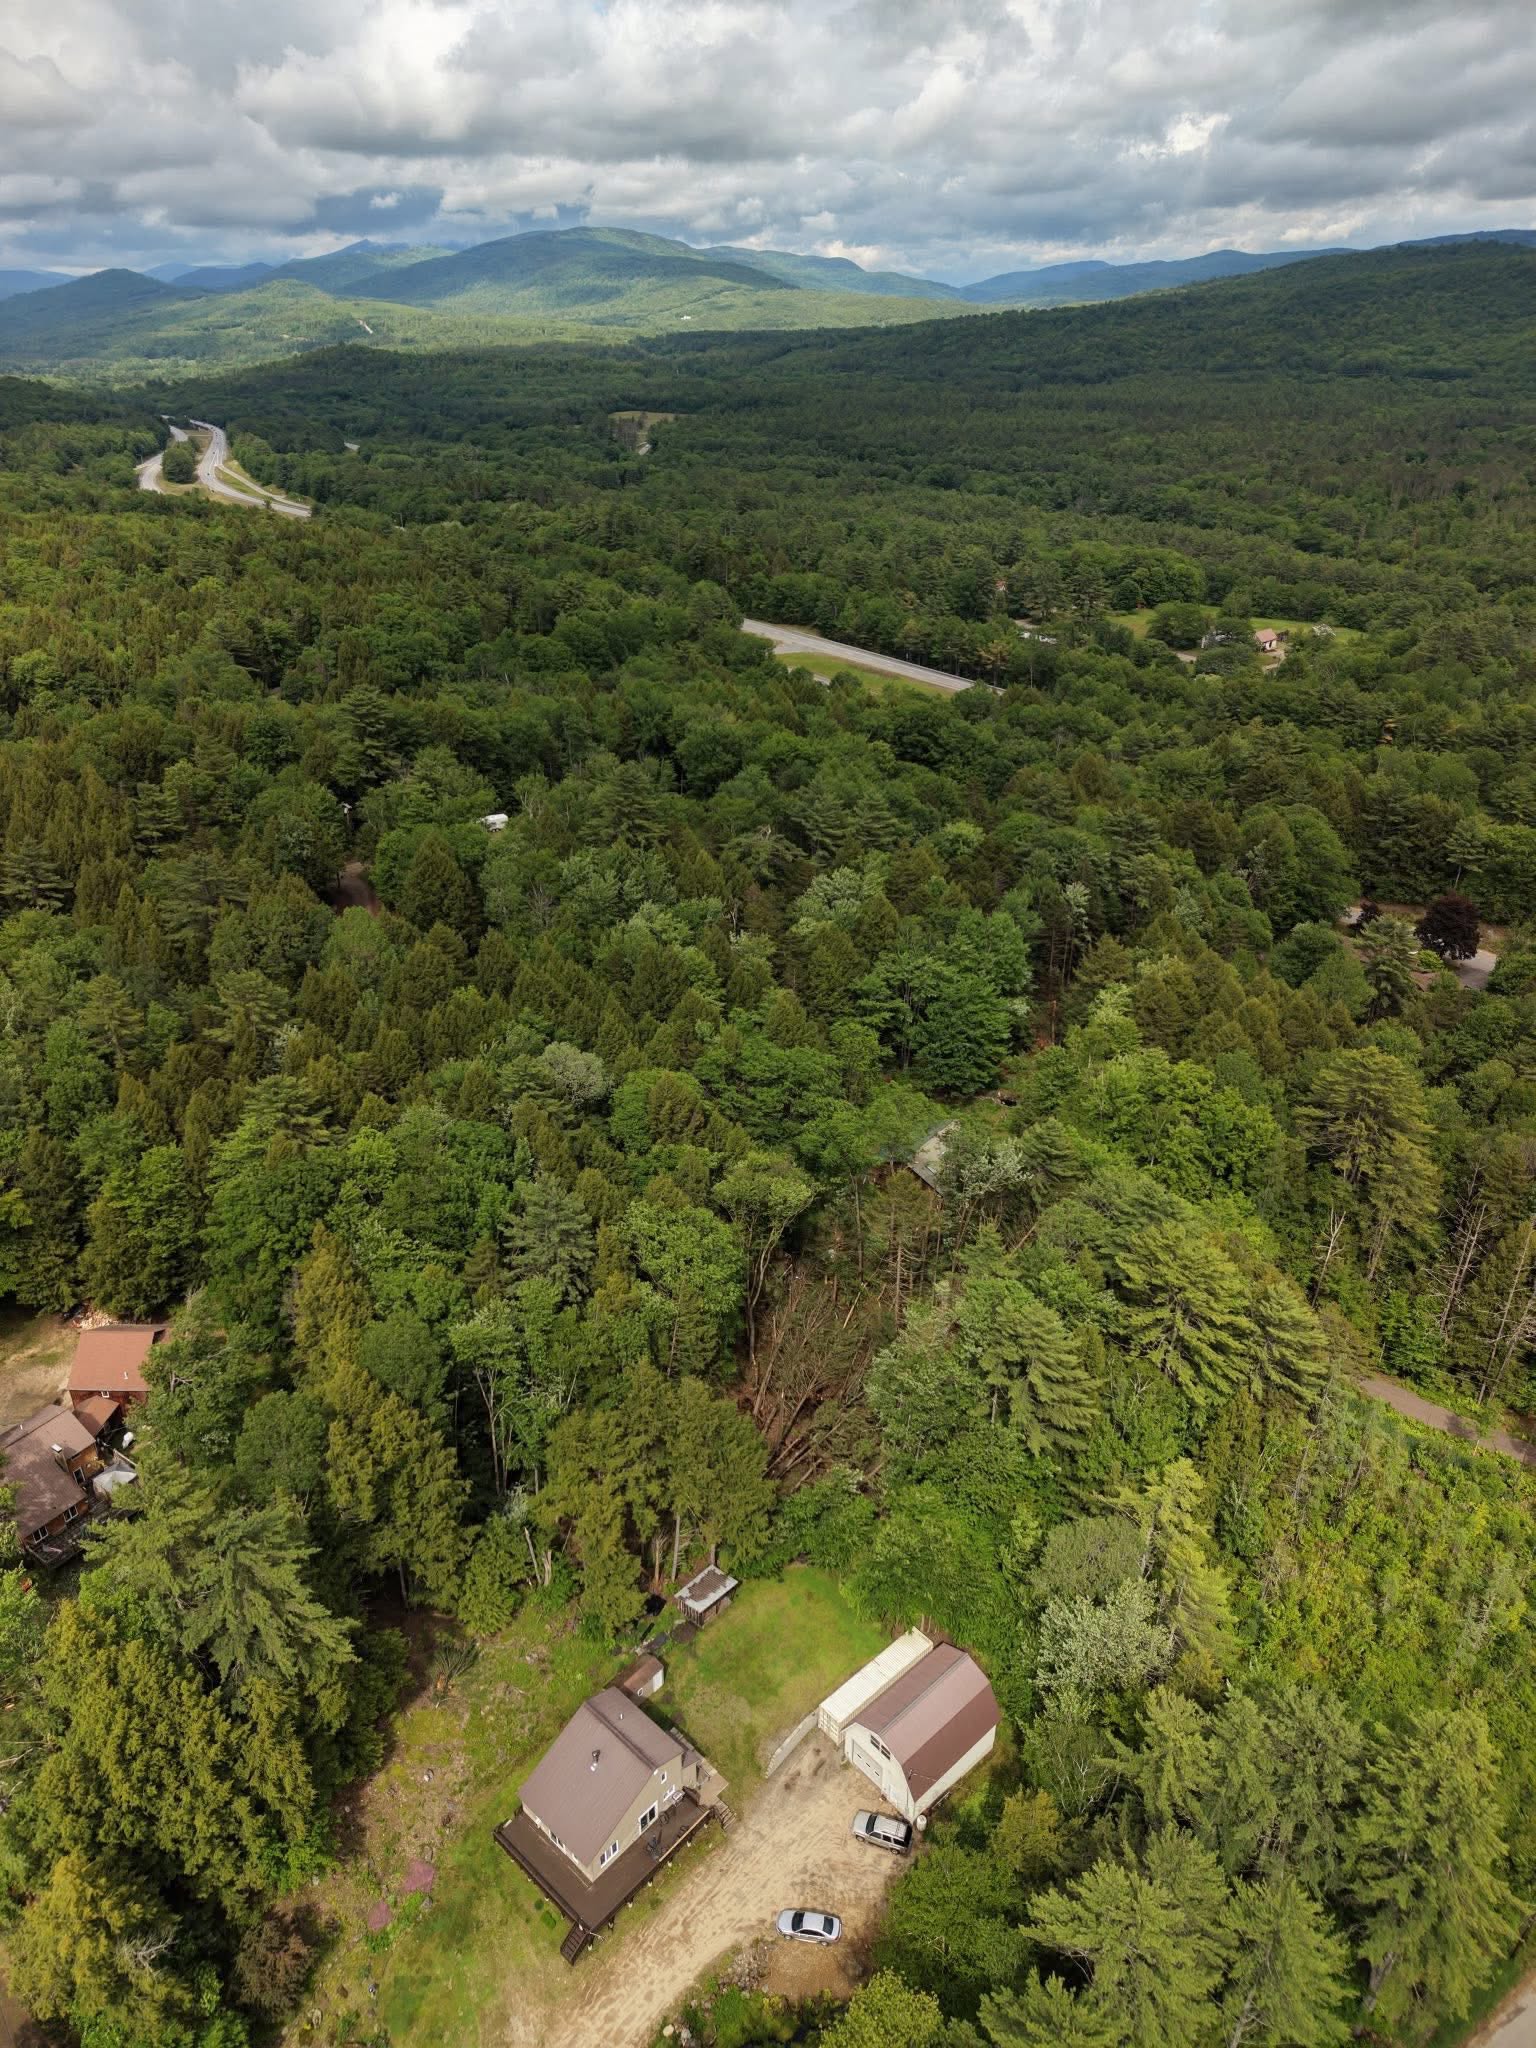
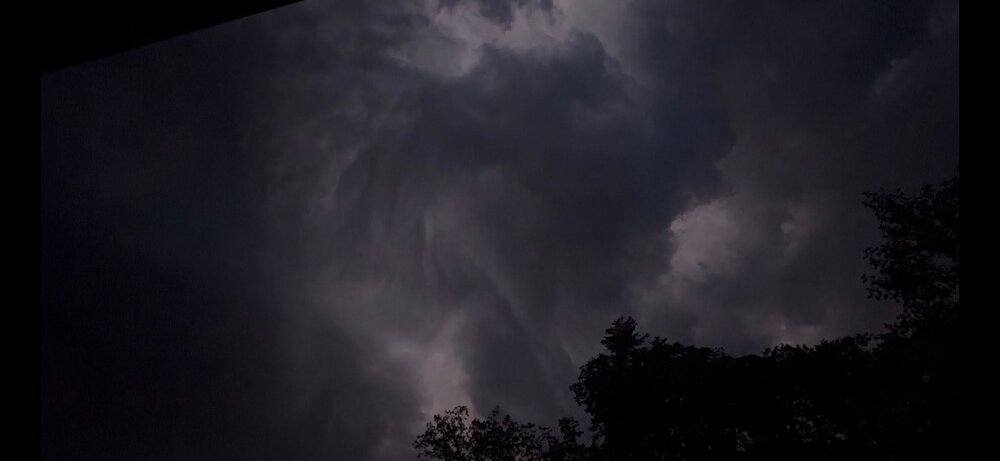
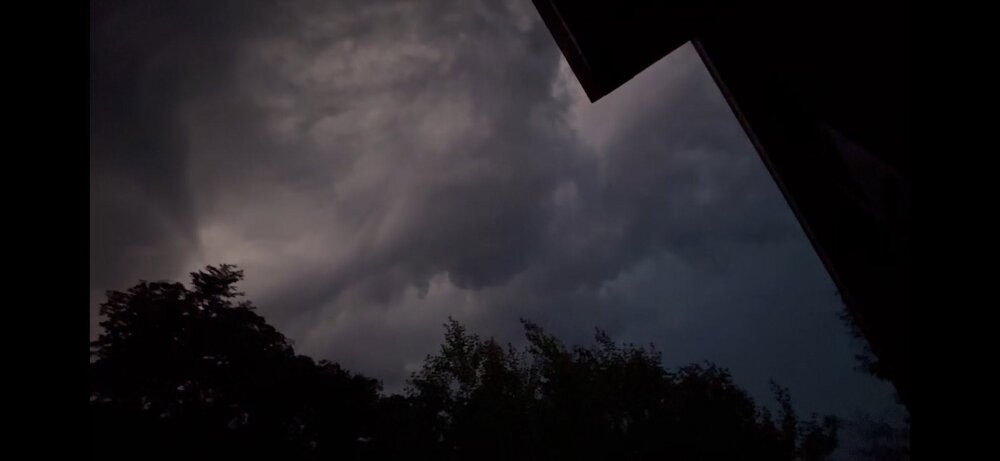
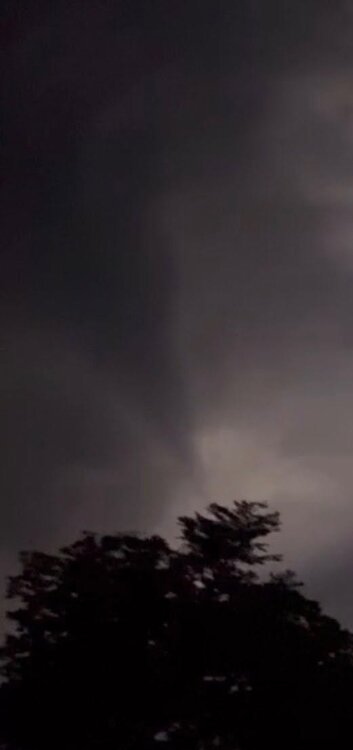
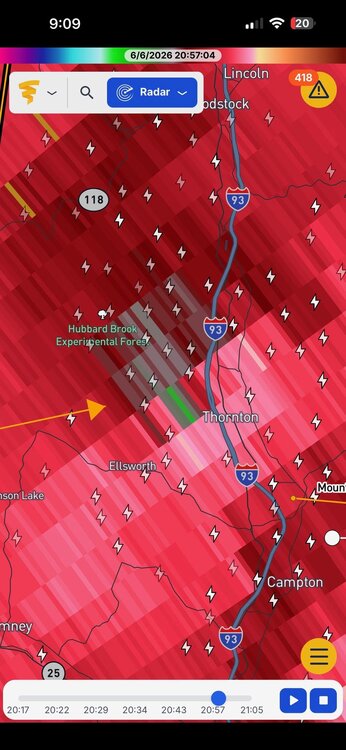
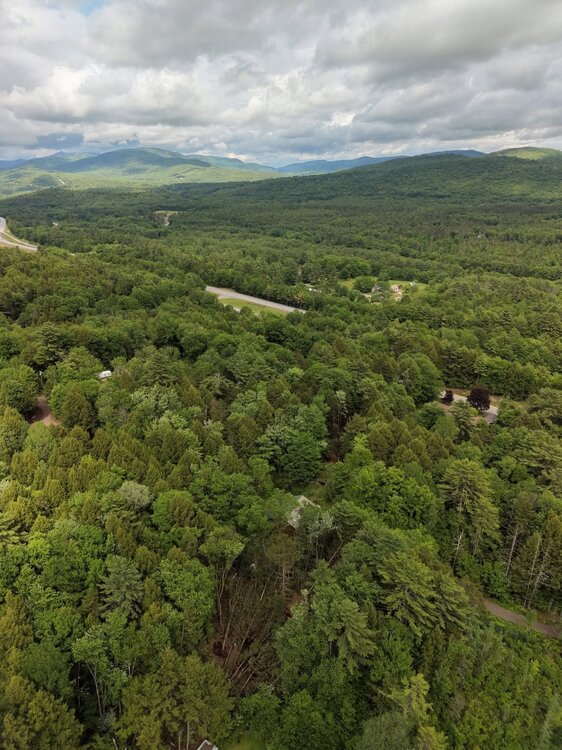
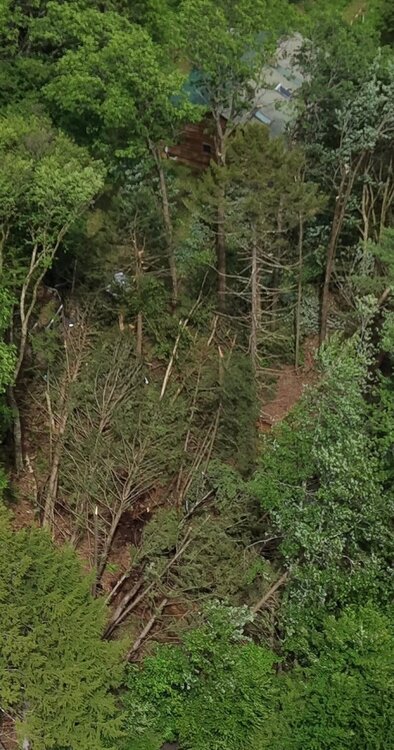
Thornton NH 852 pm 6/6. Probable Scott spinner. Video link and video stills attached. https://www.facebook.com/TheWizardline/videos/1009799924785673/ This looks like a classic brief spin-up tor on the S side of a comma head associated w/ a bow echo. These are more common than once thought, and sometimes you can get a bunch clustered from the comma head. The cloud structure is not classic back edge of the storm w/ a clear wall cloud. This is b/c the comma head makes it more chaotic/messy from a visual standpoint. It is not raining that hard near the funnel as the visibility is good, and that would make sense given the lower echoes in the rear of the comma head. The drone pix shows very localized tree damage. Too small amd sharp for a miroburst. Yes, the trees are all laying in one direction but that can be misleading. The bow echo was moving E 40-50 mph, so a weak tornado moving that fast can easily have it winds on one side of the circulation negated to a point no tree damage occurs, and the other side enhanced, so trees would all fall in the same direction. And we know from observations in the field now, brief tornadoes like this are much more common than we once thought. So many spotters, chasers, cameras, and now drones make detection much more likely. This is about 65 mi from GYX WSR-88D and that would make it about 5000 ft at VEL1. A little high to catch the best low-level rotation, so I bet there was better below 5000 ft. I send all this to WFO GYX.


-
 A few notes on the edits: Using Martz's own data, I changed the format to recognize the most recent date on which a given high was set. Showing only the earliest occurrence, of course, is going to favor earlier years. For Maryland, I recognized the higher 106°F reading from Baltimore Science Center in 2012, which was omitted by Martz. For North Carolina, I added the 107°F tie from 2012 at a cooperative station that was missing from Martz's data. Note that several RAWS stations were even hotter, in the 107–109°F range, but I did not recognize those here. For Maine, Fryeburg and other coop stations reached 101°F in 2025, matching the value Martz had listed. Rachel Carson RAWS reportedly reached 103°F, but again, I went with the lower conventional station mark. For New York, I removed the absurd 105°F reading from 1919. No other station in New York was above 98°F that month. The site that supposedly reached 105°F is in the elevated northern interior, and on the same day several nearby stations reported highs only in the 88–92°F range. The same station also supposedly had a low of 50°F, implying a 55°F diurnal range. That reading is not credible. I used 104°F from 2012 instead, though even that may be too high. The next value would be 103°F, which was most recently reached in 2025. There are also a few older records that are probably questionable, but I left them in place because the goal here was mainly to update Martz’s map rather than fully reconstruct every state record from scratch. Pennsylvania’s 107°F from 1933 is almost certainly erroneous as it is far above surrounding observations. But I left it because the next-highest readings were either from that same year at other stations, including on the opposite side of the state, or from the same general era. In other words, changing it would require a deeper reconstruction rather than a simple update. Wyoming is another interesting case. There is a reported 114°F reading from 1988 that Martz rejects apparently because it was several degrees higher than other Wyoming observations. But that one does not strike me as obviously impossible. Montana set its state record in 1988, Minnesota tied its June record in 1988, and the Wyoming site was near western Nebraska, where there were observations in the 110–112°F range. Even if the 114°F were 3°F too high, it would still match the 111°F record from 1919 shown here. Note that the 111°F record recognized by Martz was also the highest by several degrees that month. So yes, there are likely other discrepancies and judgment calls buried in the record book. But the big picture does not depend on any one marginal station. Once you present the most recent tied occurrence, correct the obvious omissions/data issues, and add the 2025 New England records, the map changes dramatically.
 -
1.87" total here between yesterday and today.
- Today
-
This is what Martz’s June statewide high-temperature record map looks like if you present the most recent occurrence of each record, correct a few omissions/data errors, and add in the 2025 records that were set or tied across New England. With the updated/tied values included, 23 of 51 U.S. jurisdictions (50 states plus DC) have set or tied their statewide June high-temperature record in just the past 14 years, from 2012 through 2025. That is a huge chunk of the record book, especially considering that many of these records extend back into the 19th century. A lot of the changes come from the brutal 2012 heat wave, when numerous states tied or set June records. Then 2025 added another cluster in New England. The result is a map that looks a lot less like “the old records still dominate” and a lot more like what you would expect in a warming world: the upper tail keeps getting pushed higher, and old records keep getting matched or exceeded. Here is a table showing all June statewide record high temperatures set or tied from 2012-2025: State / Jurisdiction June Record Year Colorado 114°F 2012 Georgia 110°F 2012 Illinois 109°F 2012 Kansas 118°F 2012 Kentucky 111°F 2012 Maryland 106°F 2012 Missouri 112°F 2012 Nebraska 116°F 2012 New York 104°F 2012 North Carolina 107°F* 2012 South Carolina 113°F 2012 Tennessee 110°F 2012 Virginia 106°F 2012 District of Columbia 104°F 2012 Idaho 116°F 2015 Hawaii 96°F 2019 Oregon 119°F 2021 Washington 120°F 2021 Massachusetts 105°F 2025 Maine 101°F* 2025 New Hampshire 102°F 2025 Rhode Island 100°F 2025 Vermont 103°F 2025
-

Spring 2026 Pattern Discussion Thread
WintryMixmaster replied to Carvers Gap's topic in Tennessee Valley
I did end up with 0.35" according to my new rain gauge, but there was some significant flooding closer to downtown Knoxville. Very localized rain today apparently, it was weird seeing the Flash Flood Warning and seeing dry ground outside haha -

2026-2027 Super El Nino
GaWx replied to Stormchaserchuck1's topic in Weather Forecasting and Discussion
Note that Nino 3 anomalies are stronger than Nino 1+2. So, this prog isn’t severely E based as of 2/1/27. -
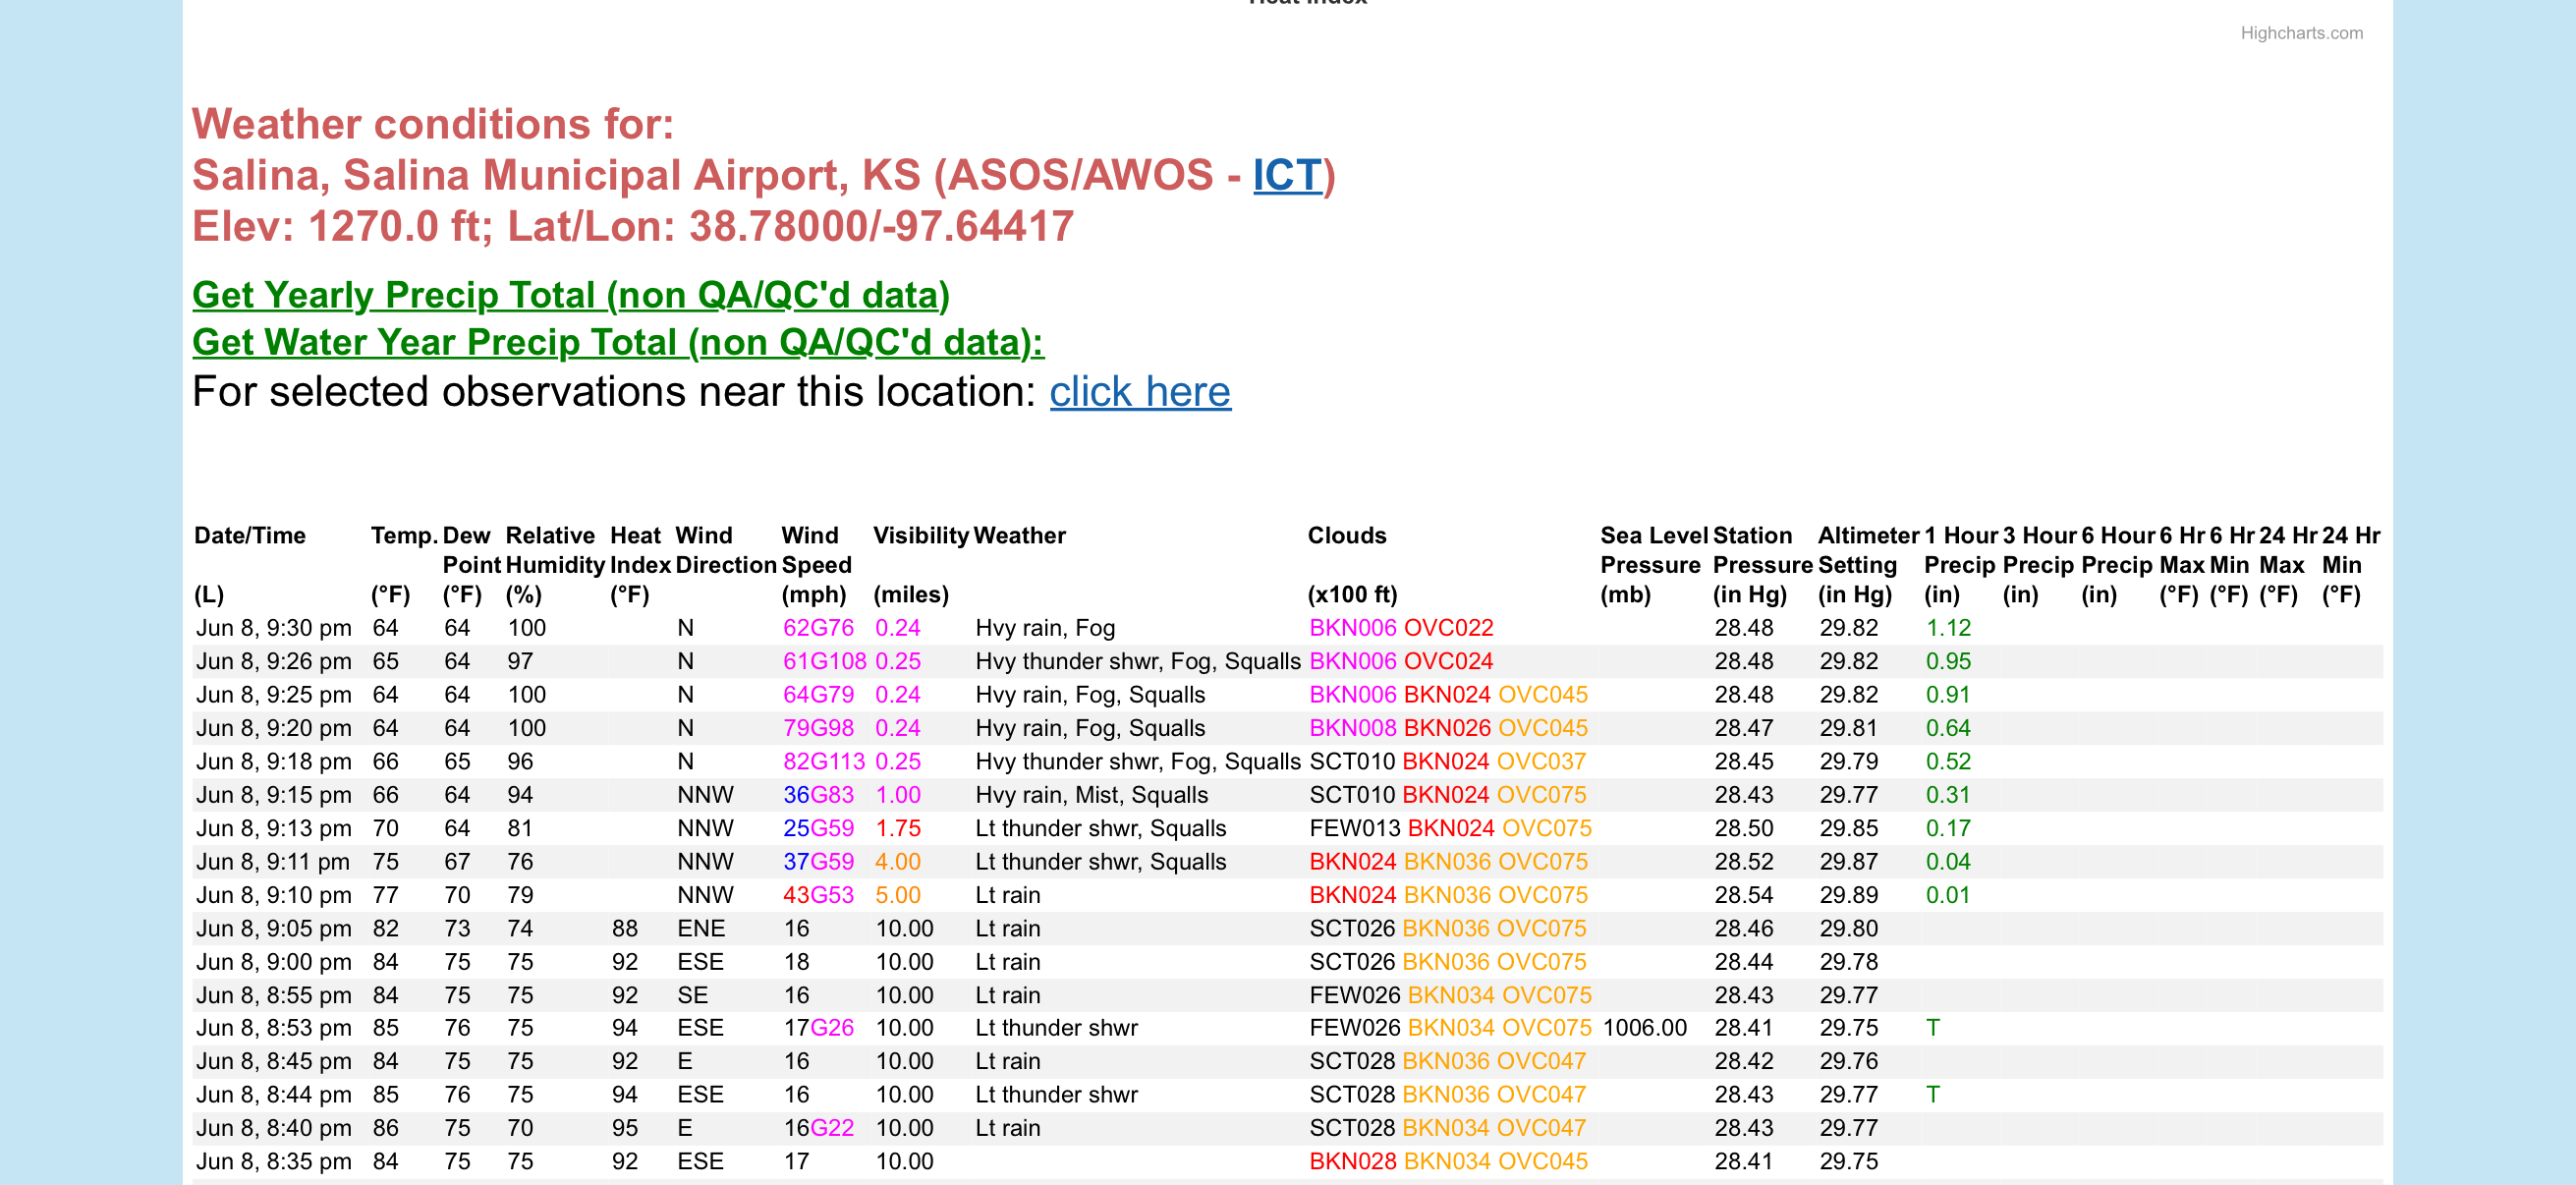
Is the anemeter tuned correctly at Salina KS? If so, they are having some incredible wind gusts in that line of storms right now. 82mph gusting to 113!

-

2026-2027 Super El Nino
snowman19 replied to Stormchaserchuck1's topic in Weather Forecasting and Discussion
-
-
2026-2027 Super El Nino
GaWx replied to Stormchaserchuck1's topic in Weather Forecasting and Discussion
1877-8 followed by cold neutral and then weak La Nina 1888-9 followed by strong La Niña and then weak La Niña But in neither of these cases were they immediately preceded by La Niña like ‘26. -
11/30/2025: T (A mix of rain/sleet from the 4am hour through about 9am. Intensity got up to light/moderate intensity at times. Temps: low/mid 30s 12/02/2025: T (Probably had a brief period of sleet w/ rain sometime between 4:30am and 5am when precip started before quickly changing to a cold rain that became moderate at times during the morning.) 12/05-06/2025: 1.4" (Flurries/very light snow starting in the 4am hour intensifying to light snow between 6am and 10am (light/moderate at times). Flurries to very light snow showers continuing through the rest of the morning ending during the 12pm hour. ETA: Another few bursts of sometimes moderate snow with big aggregates between 10:30pm and around midnight or so dropping an additional 0.2".) 12/11/2025: T (A few flakes in the air during the morning on a northwesterly surface wind.) 12/14/2025: 0.9" (Mixed rain/snow starting after midnight on the 14th, changing over to snow sometime during the 3am hour and lasting through about 6:30am. Snow was moderate at times between 4am and 5:45am. It was graupelly in consistency.) 12/26/2025: T (A mix of light rain/sleet between 10:30am and 12pm. It was briefly freezing rain/sleet as temps fell to 31F during the precip.) 1/01/2026: 0.1" (A squall of heavy snow blew through between 5:18am and 5:35am with visibilities dropping to <= 1/4 mile briefly between 5:21am and 5:25am. Note: could have been 0.2" but the wind 25-30mph gusts made it difficult to tell.) 1/11/2026: T (A few wet flakes with a dying snow/graupel squall around 1:30-1:45pm.) 1/17/2026: 0.4" (Flakes started falling around 8:45am. At 8:48am intensity rapidly jumped from flurries to moderate+ within 15 seconds. Between 9-9:05am the snow was fairly heavy at times. Snow tapered off to flurries by 9:15am. There was a snow/graupel mix that briefly got up to light/moderate intensity around 10am. Snow/graupel tapered off by 10:30am as the last flakes concluded.) 1/18/2026: T (Off and on light rain, probably mixed in with mangled flakes predawn (1:30am-6:30am). An afternoon round of flurries between 4 and 5pm.) 1/24-25/2026: 8.0" (Flurries starting in the 11pm hour on the 24th intensifying into a light snowfall after midnight. Snow becoming moderate at times through the predawn hours. Some moderate+ rates in the 6am hour, then light/moderate through 7:30am when sleet mixes in. Back and forth between sleet and snow/sleet mix through 8:10am when sleet takes over for good. Sleet was moderate at times with snow grains mixed in throughout the morning. Waves of heavy sleet moved through during the afternoon (mainly between 1:30pm and 4pm). Sleet continued in light/moderate intensity afterwards until 5:30pm when it became light. Light sleet continued until precip wrapped up around 7pm. Snow grains were mixed in w/ the sleet (especially before 3pm.)) 2/06/2026: 0.3" (Flurries starting after midday becoming a period of light snow between 2:30pm and 4:30pm. Snow tapering off to flurries afterwards and ending by 5:20pm.) 2/07/2026: T ( Flurries/light snow showers associated with a strong cold front that moved through from NW to SE in the 2am hour.) 2/22/2026: 2.6" (Snow starts mixing in with rain around 2pm. More mixes in until it’s a moderate wet snow by 4pm. Snow becomes moderately heavy during the 5pm hour. Snow tapered off to light intensity during the 6 and 7pm hours. Became moderate again with the western snow band by 8pm w/ increasingly gusty winds. Snow lightened up during the 9pm hour and stopped with the exception of a few flurries throughout the night by 10pm.) 3/02/2026: 0.7" (Flurries w/ big flakes starting in the 11am hour w/ bursts of light+ snow from 12-1:30pm. A burst of moderate-mod/heavy snow late in the 1pm hour. Tapers off to flurries 2-3pm before another period of light-light/moderate snow between 3:10-4:30pm. Snow tapers to occasional flurries into the evening before ending.) 3/12/2026: 1.0" (Sleet starts mixing in with rain around 9:30am. Snow starts mixing in by 10:30am. Precip flips back and forth between rain/sleet and rain/snow/sleet until 11:35am when it finally changes into all snow. Snow is moderate/heavy in intensity briefly becoming heavy during the 12pm hour. Snow tapers to flurries by 1pm and ends by 1:30pm.) Snow totals as of June 8th, 2026 (and the snow calendar final total unless Yellowstone erupts ): 15.4" SUPER LATE! I know.
-
ahhh yes you're right. Comes out of convection which evolves in the upper-Midwest. Certainly can work but...that is definitely more of a long shot,
-
I hope machine learning ( which is very bullish) regarding severe weather is somewhat accurate. See below: Upper level ridging is expected to build overhead on Thursday, with several models also showing a shortwave disturbance passing through the top of the ridge. How this disturbance evolves will have a large impact on our forecast locally. If the disturbance passes through early in the day, we could have large scale subsidence and relatively low coverage of showers and thunderstorms. If it were to approach at peak heating, we could have a much greater coverage of thunderstorms. Upstream convection will likely have a large impact on how that disturbance evolves, so confidence in the forecast details on Thursday is lower than normal. What models are in good agreement about, is that the background environment will be highly unstable (CAPE values likely in excess of 3000 J/kg). There will also be enough dry air in the mid-levels to support strong downdrafts (DCAPE in excess of 1000 J/kg), and just enough shear (around 20 kt) to give storms some weak organization. Such an environmental setup is common in many of our more impactful summer severe thunderstorm events. As a result, there appears to be a conditional threat for severe thunderstorms on Thursday. That threat for severe thunderstorms may continue on Friday as a shortwave disturbance passes to our northwest through the Great Lakes causing the upper ridge to break down and a surface cold front to approach from the northwest. With greater synoptic scale forcing, confidence in the occurrence of storms is higher on Friday, but instability might be slightly lesser. Machine learning guidance is very bullish on the severe thunderstorms threat for both Thursday and Friday. We will continue to monitor this potential threat over the upcoming days.
- 440 replies
-
- 1
-

-
- severe
- thunderstorms
- (and 7 more)
-

2026-2027 Super El Nino
Stormchaserchuck1 replied to Stormchaserchuck1's topic in Weather Forecasting and Discussion
Good question. I was going to ask if anyone wants to discuss the snap-back tendency that the historical Strong Nino analog has given us, but I think a lot of attention is on this event because it may end up extreme. I think the Nina snap-back won't be as strong this go around, but it's early. Something to watch is if cold water starts to get going in the western and central subsurface, through the next few months and into the Fall and Winter. The big, long lasting Nina's all had major cold in the subsurface during the height of previous Strong Nino peak. Here is the historical dataset: Climate Prediction Center - Relative Oceanic Niño Index (RONI) 72-73, 82-83, 97-98, 15-16, and 23-24 are your Super Nino's. Subsurface data since 1979 can be found here: Data Display and Delivery | Global Tropical Moored Buoy Array 20c Isotherm depth is probably the easiest variable to hone in on. -
Weather got a lot nicer this afternoon. Clouded up and cooled off thankfully.
-

2026-2027 Super El Nino
Maestrobjwa replied to Stormchaserchuck1's topic in Weather Forecasting and Discussion
Anybody got any data pn how often super niños spawn double-dip la ninas? -
We go 0.8" in less than an hour, though I don't know how much of that was skewed by the hail.
-
Not sure it’s actually a shortwave though. Follow it backwards, looks like convectively driven vorticity to me. Don’t get me wrong, it can work, but worried we’re missing the S & L of SLIM.
-
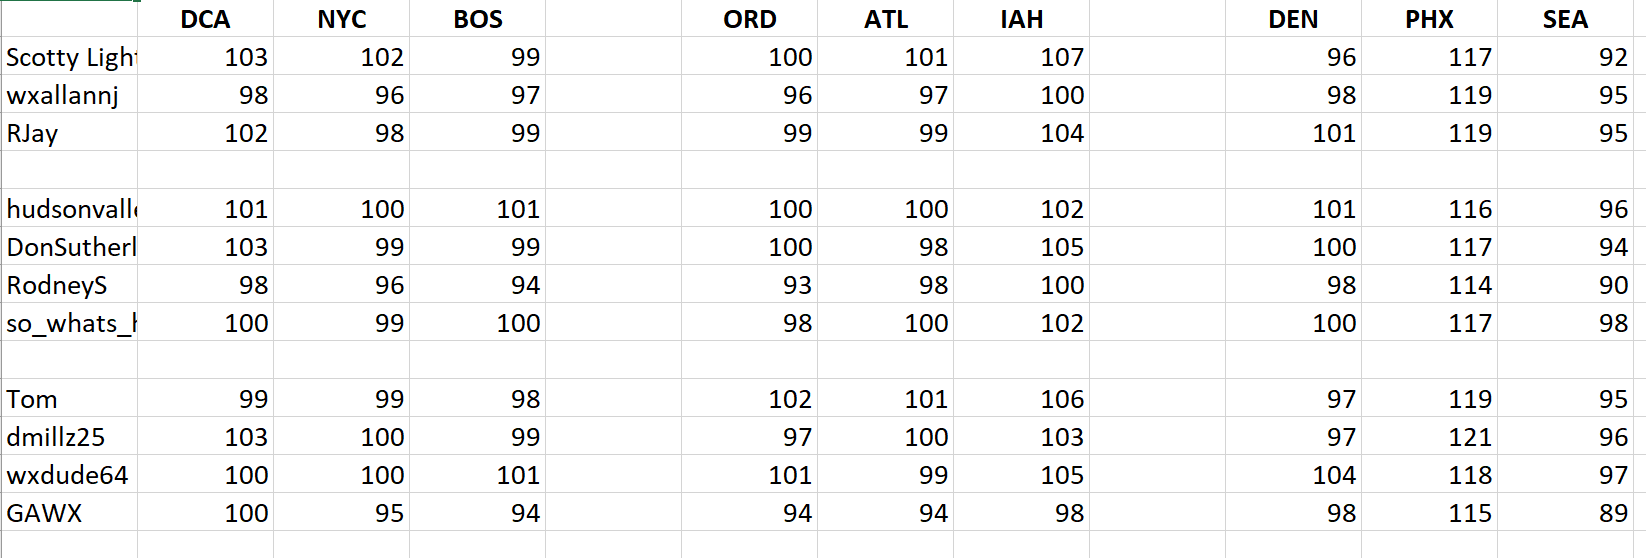
 Here are the Max Temp forecasts
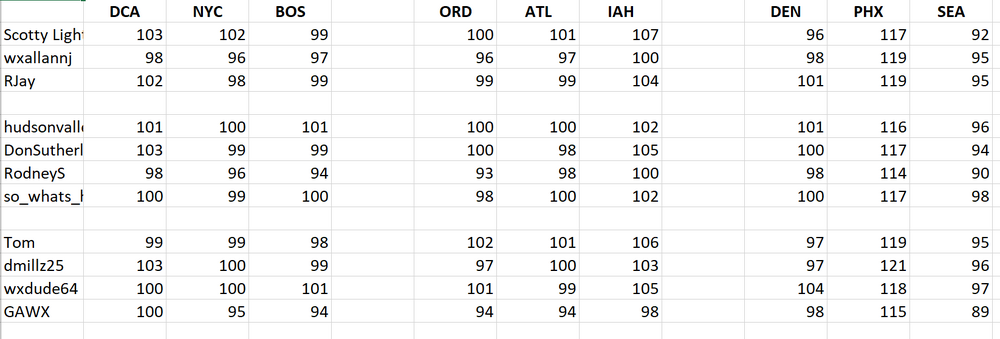
-
Late May/June 2026 Medium/Long Range
Stormchaserchuck1 replied to JenkinsJinkies's topic in Mid Atlantic
Euro weeklies for July 13-20 lol -
That’s a good thought. I didn’t think of that. It seems though the question is the trajectory of that shortwave diving southeast out of Canada and where the front becomes positioned. I am really intrigued by this but I hate how it’s just really the NAM that is showing a robust EML. The euro may be as well but I only have weather models so limited on euro products.
-
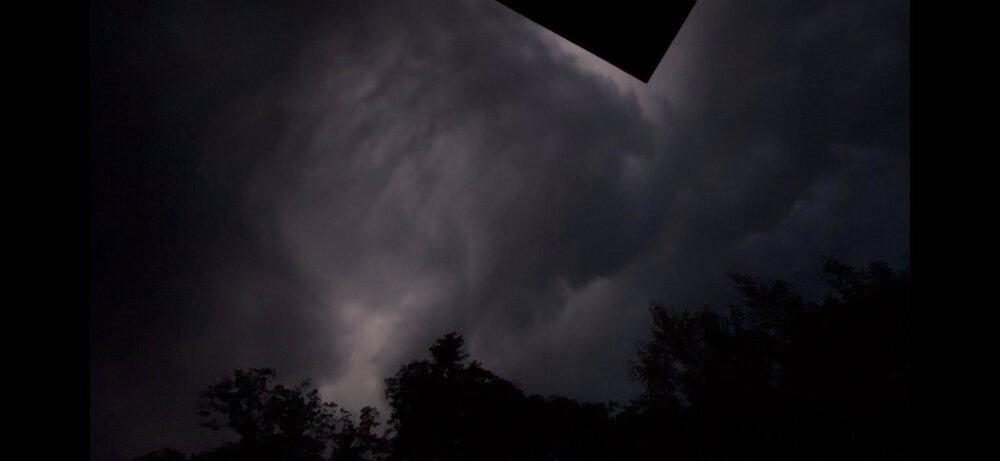
I get excited when there is hail lasting several mins, 85 mins is ott. Same with the cloudburst. Purple rain & lightning glow. Dream shot. Also lasted.