All Activity
- Past hour
-
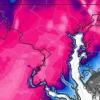
This year has to be a record for cloudy mornings. I was on the swim team for many years as a kid. We had practice every morning. It was never cloudy.
-

July 2025 Obs/Disco ... possible historic month for heat
kdxken replied to Typhoon Tip's topic in New England
Wiz's Friend agrees. -

July 2025 Obs/Disco ... possible historic month for heat
Baroclinic Zone replied to Typhoon Tip's topic in New England
57F -

July 2025 Obs/Disco ... possible historic month for heat
klw replied to Typhoon Tip's topic in New England
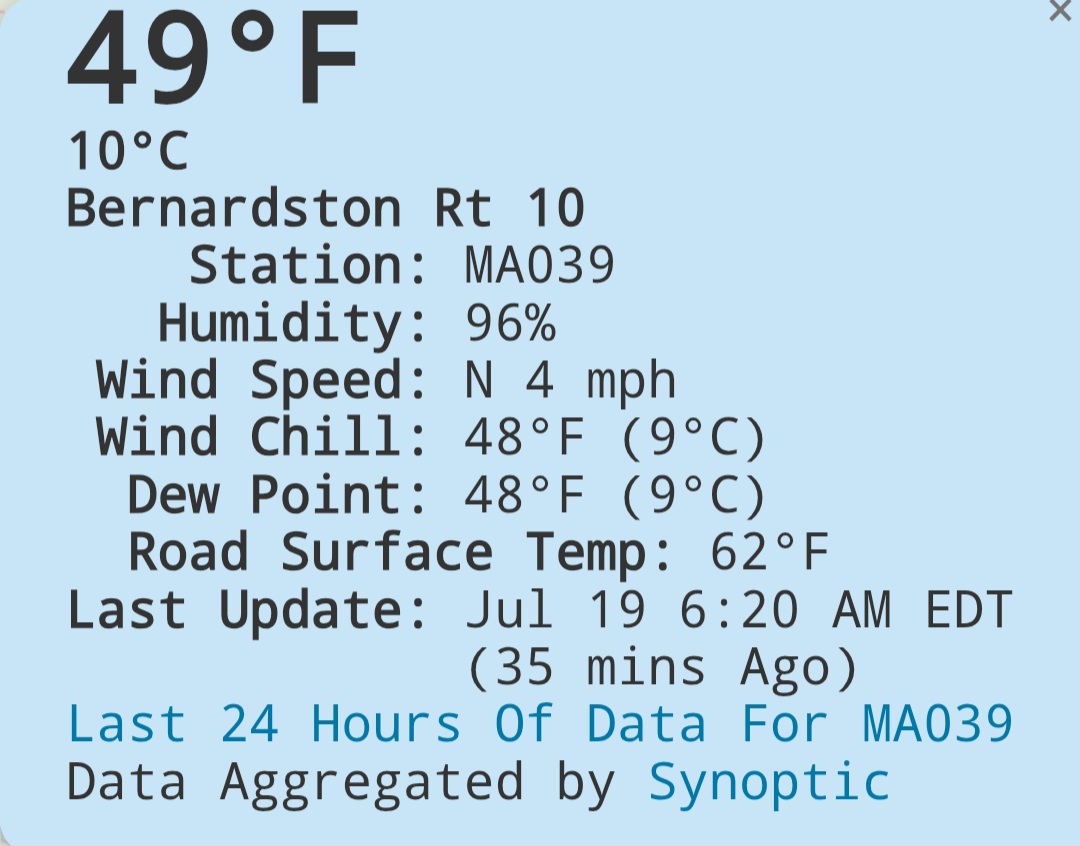
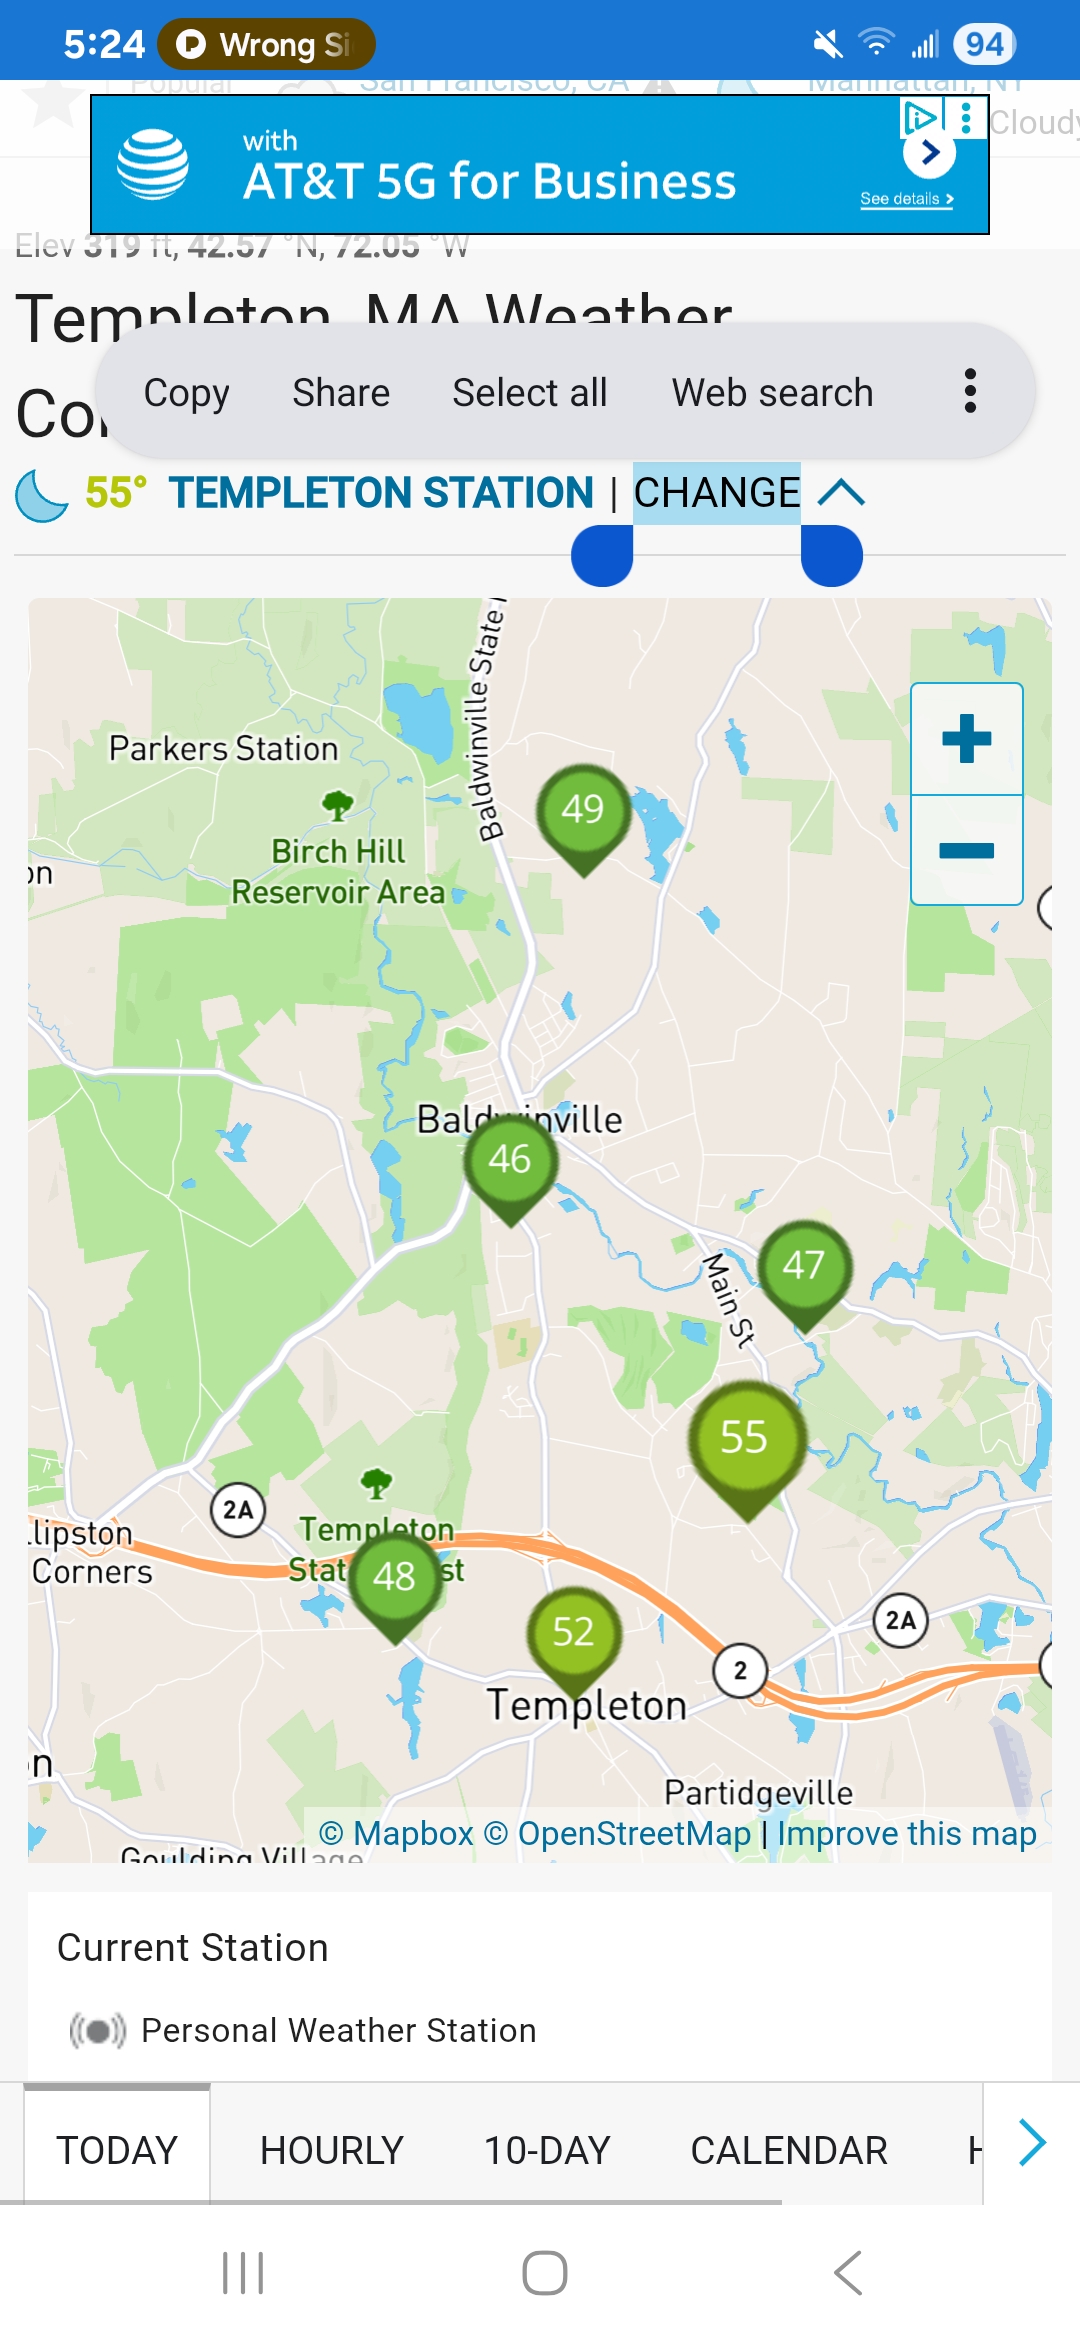
48 was the low here. -

July 2025 Discussion-OBS - seasonable summer variability
doncat replied to wdrag's topic in New York City Metro
First low below 70° here in 13 days with a 68° reading...some clouds moved in after 3 am popping temp back up to 70. -

July 2025 Discussion-OBS - seasonable summer variability
steve392 replied to wdrag's topic in New York City Metro
69 degree's this morning. Gorgeous morning!!! Windows down cruising to work. -
July 2025 Obs/Disco ... possible historic month for heat
kdxken replied to Typhoon Tip's topic in New England
What is it with the wind chill? Oh sure, NWS puts out heat index advisorys every damn day but we can't buy a wind chill advisory. AHATT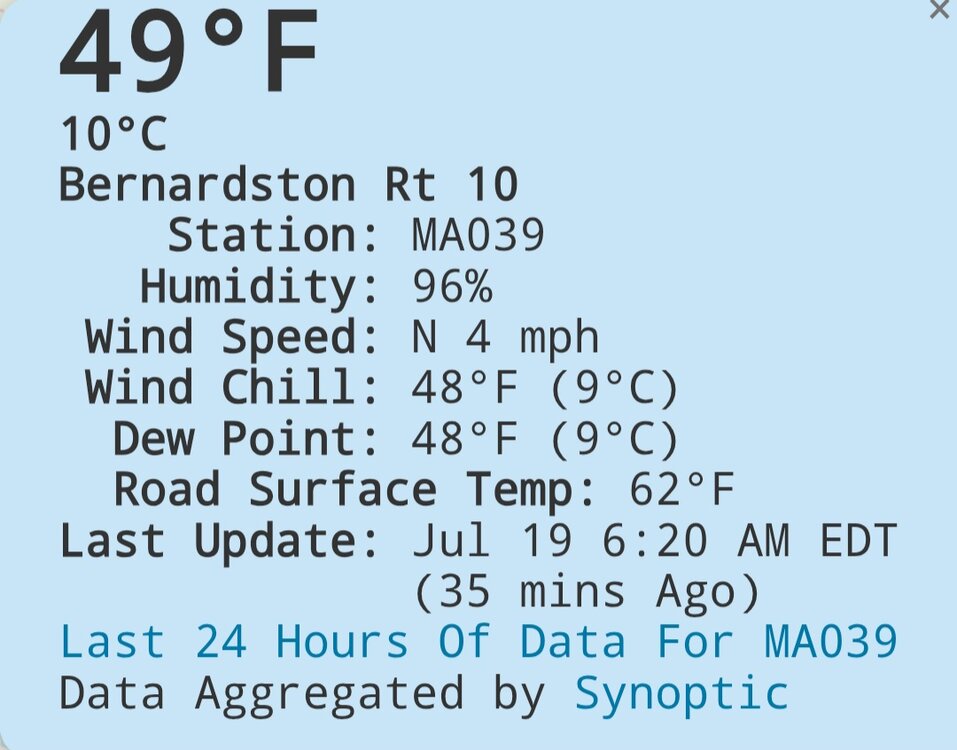
-

July 2025 Discussion-OBS - seasonable summer variability
SnoSki14 replied to wdrag's topic in New York City Metro
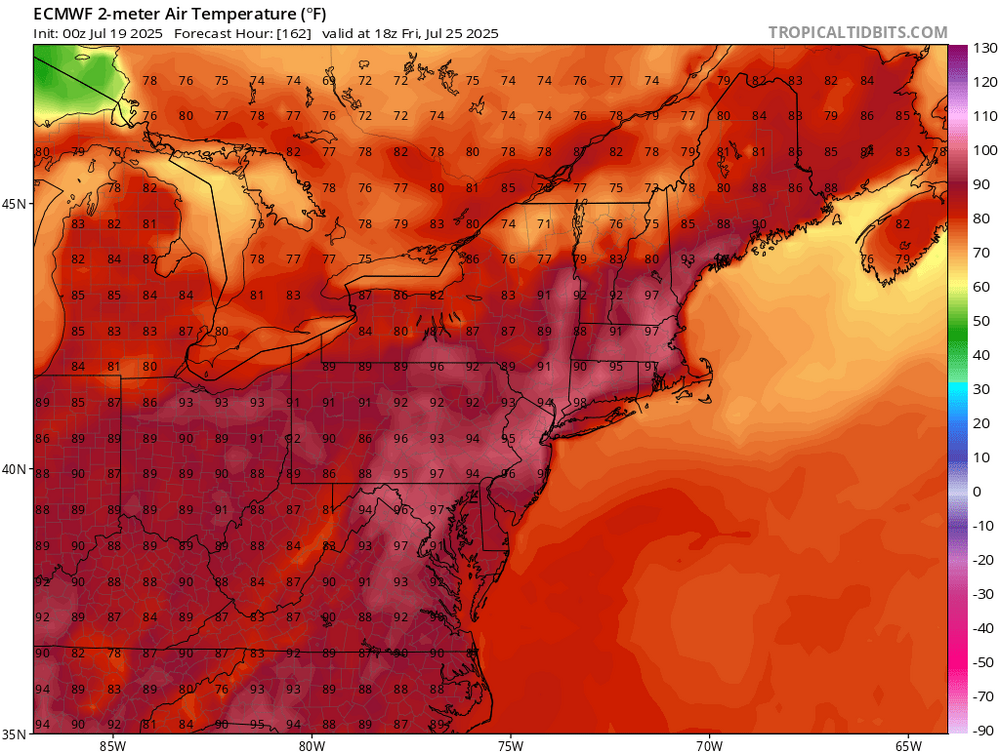
Secondary heat peak latter next week looks likely. If models continue to ramp up the ridging then more 100+ isn't out of the question -
July 2025 Obs/Disco ... possible historic month for heat
kdxken replied to Typhoon Tip's topic in New England
58° here. Probably the first 50s in a long while. It was 79 and 75 Wednesday and Thursday morning. -

July 2025 Discussion-OBS - seasonable summer variability
bluewave replied to wdrag's topic in New York City Metro
Looks like a strong sea breeze especially South Shore. The 95°-100° heat potential later next week will probably be focused more in NJ. This doesn’t look as widespread or as warm as the late June record 100° to 105° warmth. So especially for spots like JFK, the late June heatwave will remain the strongest of the summer so far.
-
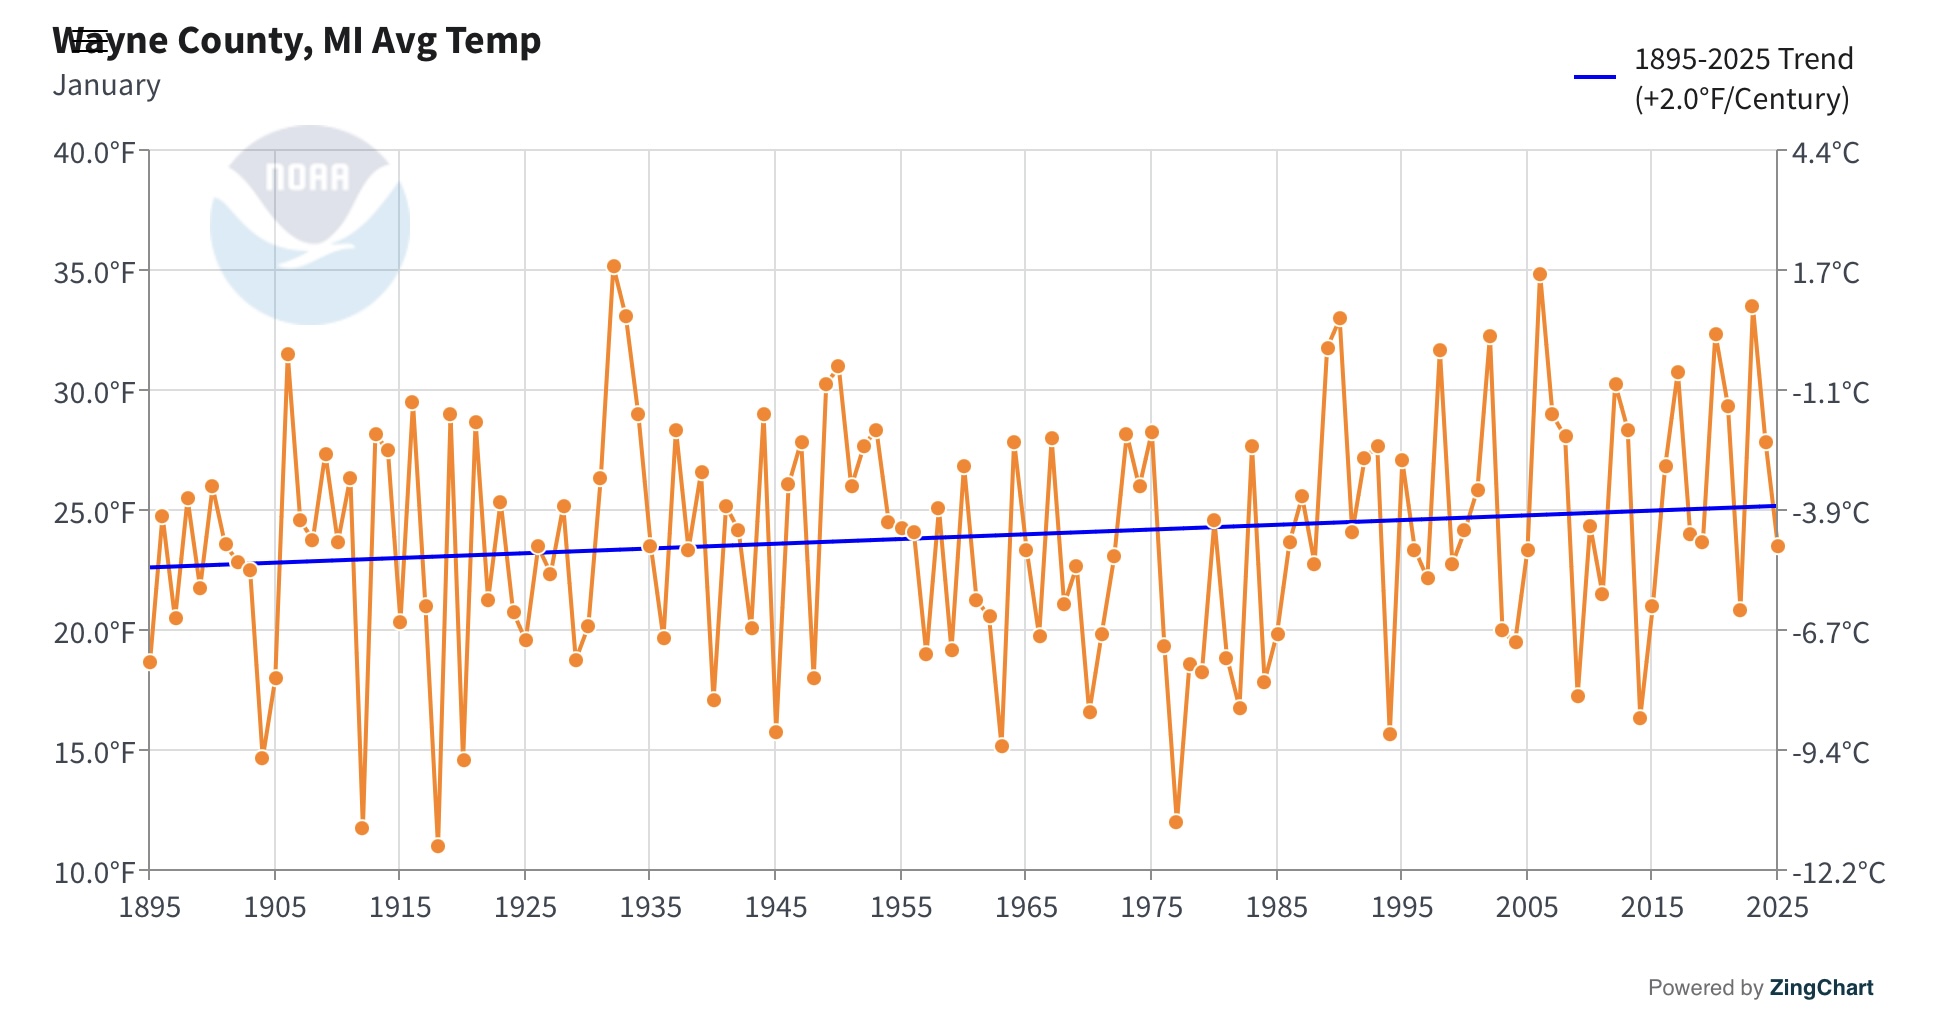
We each have our different perspectives. If you look at Don's charts and compare today vs 100 years ago, there has been 4-5F warming in both the warmest and coldest days; but, the 100-year path is different. The warmest 1% have had fairly steady warming but the coldest days have been a roller coaster. Despite the roller coaster, the coldest days are still warmer vs 100 years ago. What Don's analysis indicates to me is that we have to be careful in picking our start and end dates when looking at winter cold extremes. Metro and City airport have a long overlap period. During that period Metro is roughly 2F colder than the City airport so any analysis that starts with the city airport and ends with Metro will be contain both a station shift and a weather trend. If you don't account for the station change you won't get the correct weather trend. I would need to see more data to be convinced that the midwest winters are warming at a slower rate. I haven't seen that in any study or apples-to-apples data comparison. The only geographic trend I am aware of is somewhat faster warming further north. Canada is warming faster than the US for instance. Found one study when googling midwest winters, which looked at midwest winter storm tracks between 1959 and 2021. The findings aren't surprising. The midwest winter storm track has shifted north and the midwest is getting wetter and warmer storms. Could help explain why some midwest stations are getting more snow. https://agupubs.onlinelibrary.wiley.com/doi/epdf/10.1029/2024GL109890
-

July 2025 Discussion-OBS - seasonable summer variability
winterwarlock replied to wdrag's topic in New York City Metro
What's new? Another Grey weekend #yearwithoutasummer rolls on - Today
-
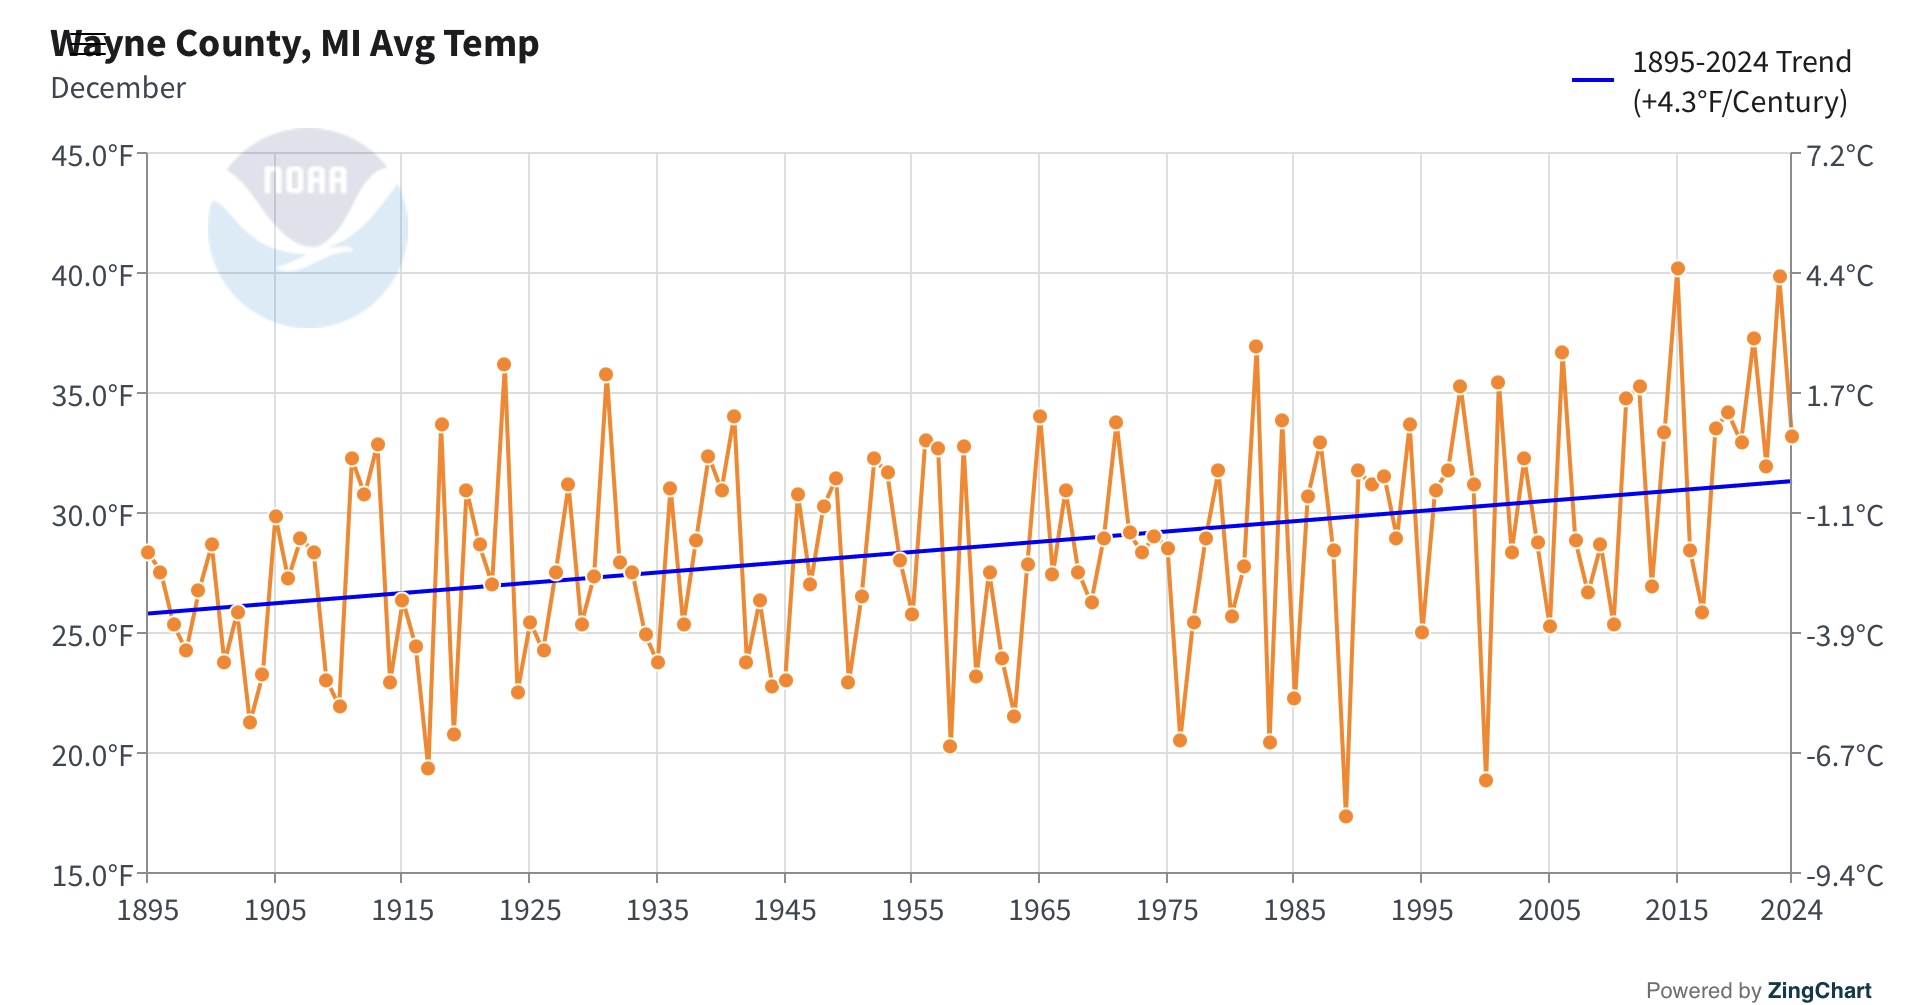
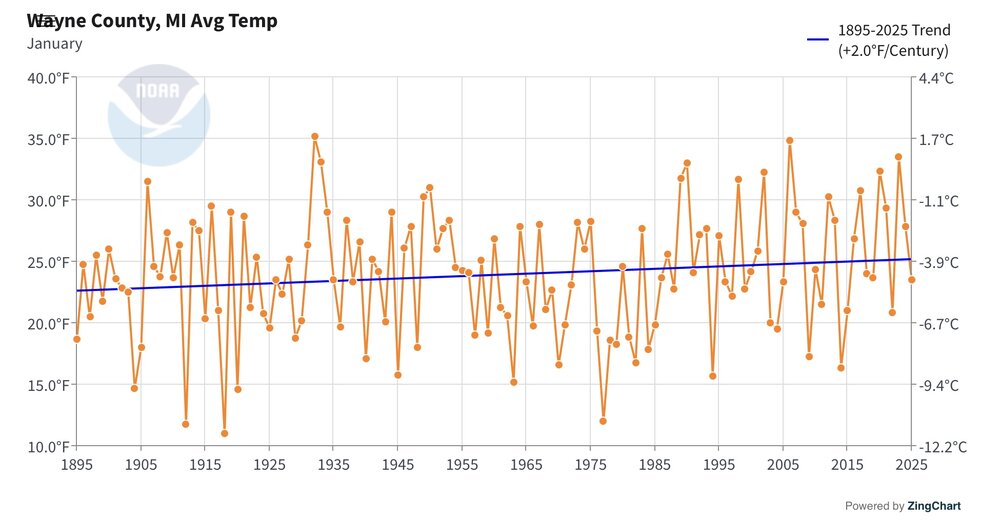
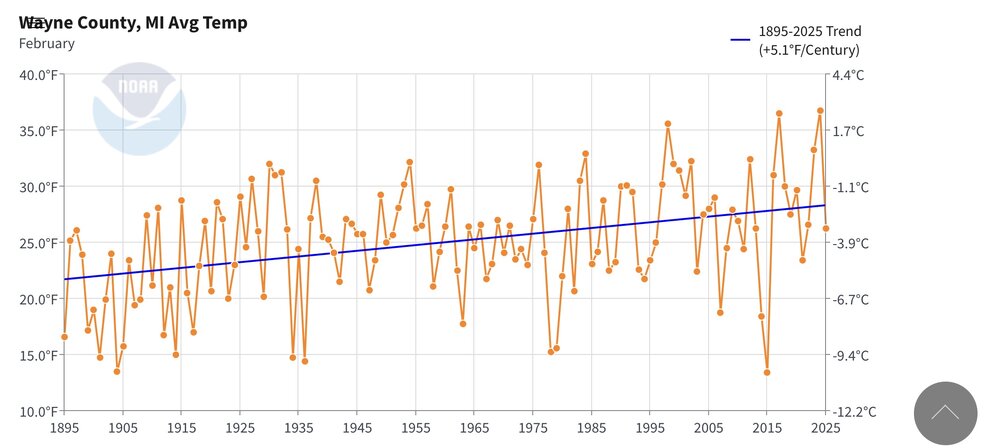
It’s good that they have a continuous record at Ann Arbor since it shows a similar long term trend is Wayne County. The NCDC takes into account station moves like Detroit compared to the rest of the county. As you said, January has seen the slowest warming since 1895. But December and February have warmed at a faster pace. This makes sense since the falls have also been warming. So it takes longer for winter to get started and the winters across the U.S. are getting shorter with more warming in February. December +4.3°/Century January +2.0°F/Century February +5.1°F/Century

-
-
Weather World otersnpSdot2ttli017cclml9uh9hm4i64i1ic2m3u4a1344uhtc707m54ii · Big heat should stay a bay for the final days of July with the pattern favoring a few days of below average temperatures thanks for a northwesterly flow. With a "ring of fire" set up to our west, there should be multiple chances for rain in PA, but it's hard to pinpoint timing.
-
July 2025 Obs/Disco ... possible historic month for heat
Baroclinic Zone replied to Typhoon Tip's topic in New England
Much better. -

July 2025 Obs/Disco ... possible historic month for heat
Damage In Tolland replied to Typhoon Tip's topic in New England
61.5 as we back from 5 miler. This is cool? Lol -

July 2025 Obs/Disco ... possible historic month for heat
OceanStWx replied to Typhoon Tip's topic in New England
I'm off, but now I'm kinda itching to put myself up for OT. -

July 2025 Obs/Disco ... possible historic month for heat
CoastalWx replied to Typhoon Tip's topic in New England
I’m up at Winnie. Let’s level everything. -
July 2025 Obs/Disco ... possible historic month for heat
OceanStWx replied to Typhoon Tip's topic in New England
Oldie but a goodie. -

2025 Atlantic Hurricane Season
BarryStantonGBP replied to BarryStantonGBP's topic in Tropical Headquarters
That what I’m wondering I just posted a map tf It’s gonna continue to rapidly warm imo -
July 2025 Obs/Disco ... possible historic month for heat
CoastalWx replied to Typhoon Tip's topic in New England
61. No 50s thankfully. -

July 2025 Obs/Disco ... possible historic month for heat
ineedsnow replied to Typhoon Tip's topic in New England
Some mid 40s even around here feels amazing out!
-

July 2025 Obs/Disco ... possible historic month for heat
powderfreak replied to Typhoon Tip's topic in New England
Looks like SLK hit at least 40F, a couple 39s scattered in on 5-min data. -
July 2025 Obs/Disco ... possible historic month for heat
powderfreak replied to Typhoon Tip's topic in New England
Fogged out at 47F.