All Activity
- Past hour
-
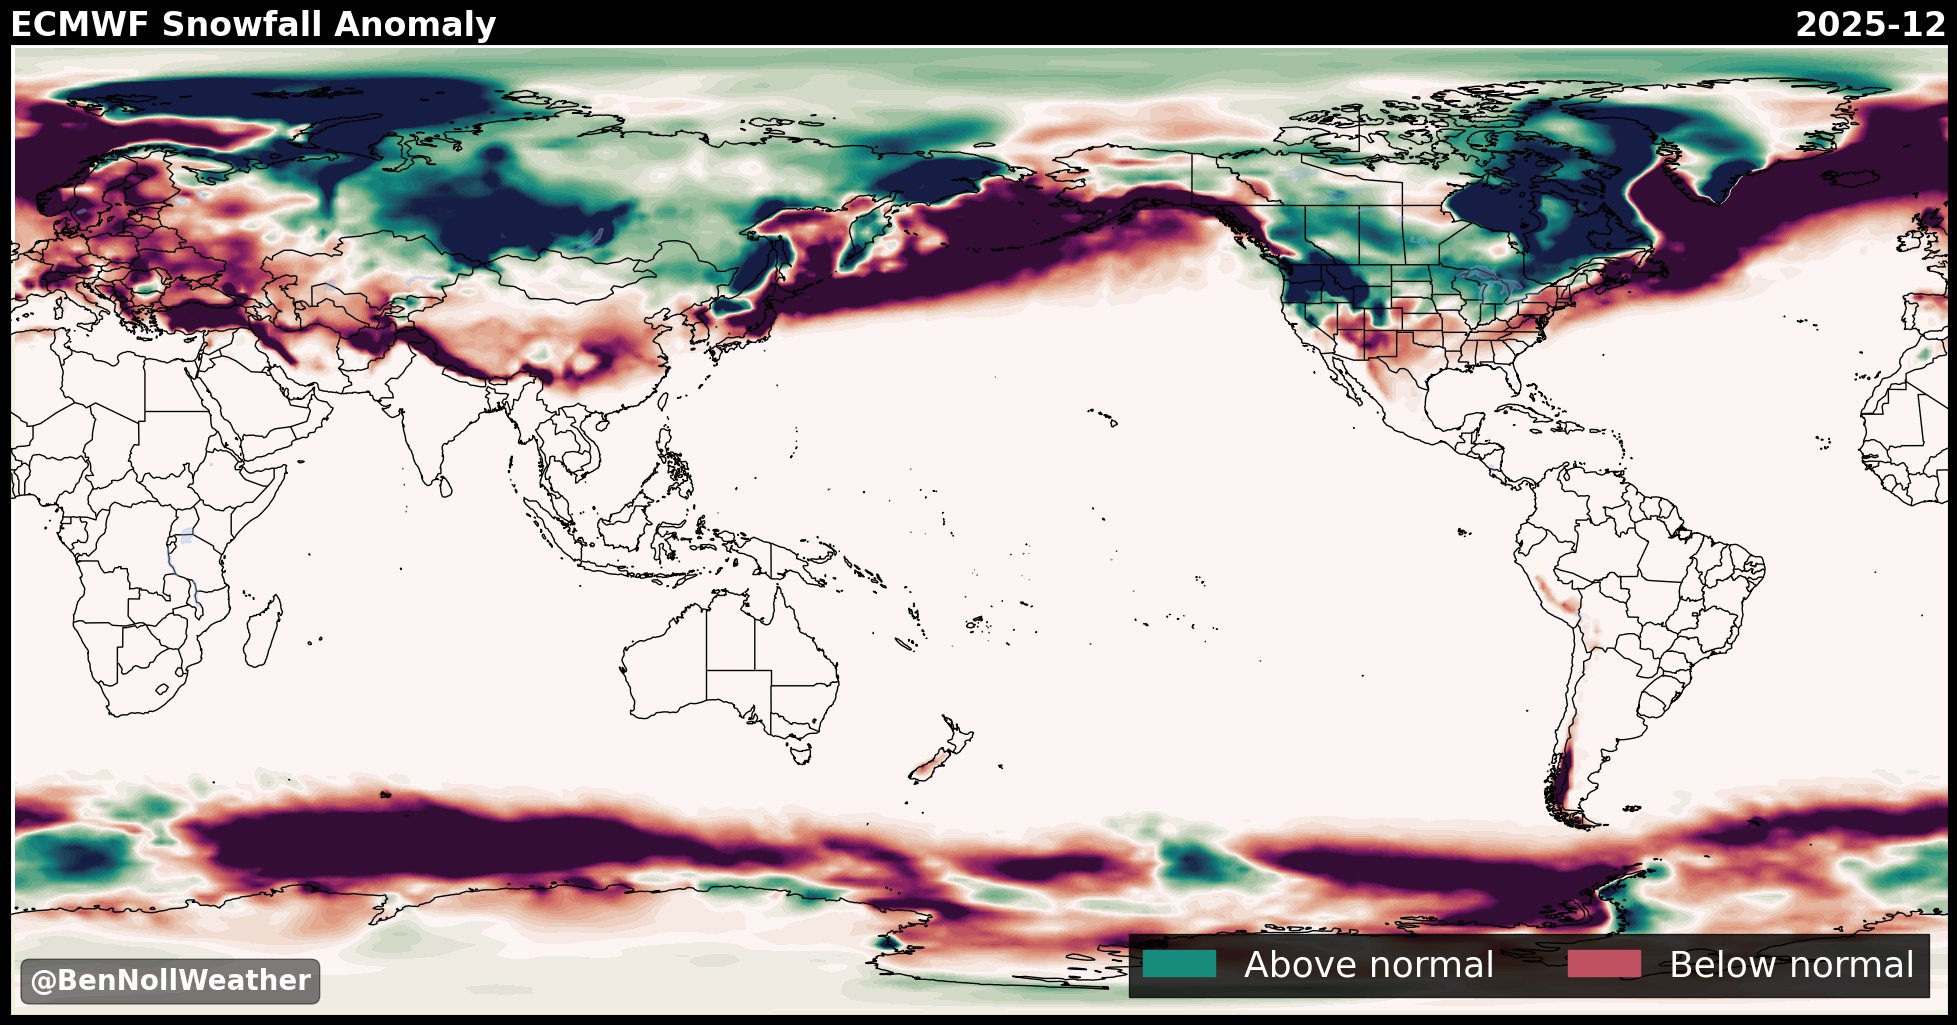
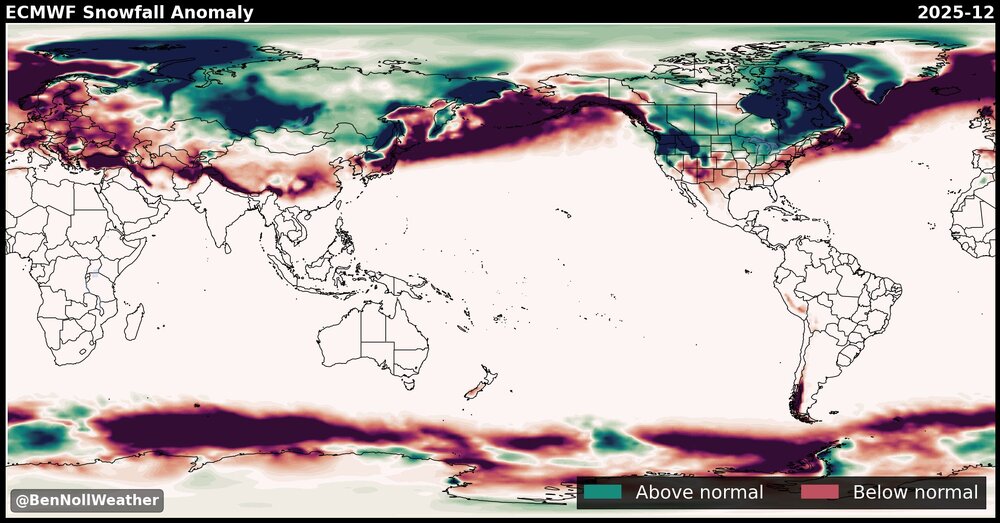
I've seen that long range snowfall monthly/seasonal anomaly map look like that a lot. And in reality over the last 20 years it has looked like that...look at some of the snowfall anomaly plots for this century. I think some of that is probably just the model reflecting the changes due to warming, and the fact that the "averages" it's using to calculate what is "normal" snowfall are lagging due to the warming. Look where the low and high anomalies are around the entire hemisphere. Higher anomalies to the north, lower along the south...what you would expect if climate zones were shifting north (which they are) in the means.
-

November 2025 general discussions and probable topic derailings ...
Typhoon Tip replied to Typhoon Tip's topic in New England
expanding this ( humorously ) further ... a lot of seasonal forecaster selling and promotion lending to readers purchasing, and costing "a lot of emotional money", too. LOL -
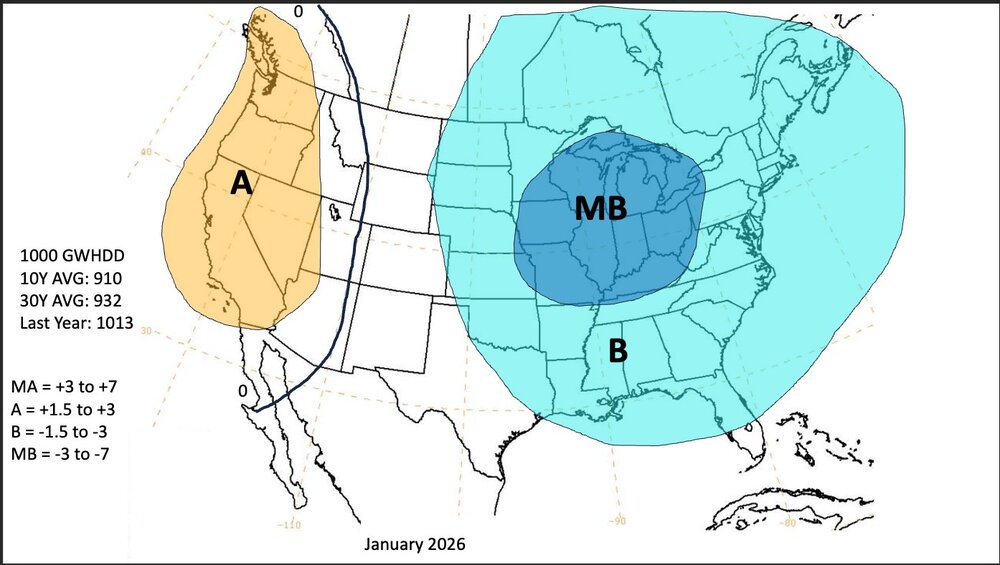
Focus on Jan 2026 from Allan Huffman @RaleighWx I posted my winter forecast on my patreon page with reasoning last week. But I will post my maps here just for reference/accountability. Last year my winter forecast stunk so take it for what it is worth.
-

Central PA Fall Discussions and Obs
WmsptWx replied to ChescoWx's topic in Upstate New York/Pennsylvania
I think you're gonna get a 65-70°F day. -
Looks like a complete 180 on the overnight CFS with a hammer drop all winter //fingers crossed//
-
-
 And not even a wind advisory! Yet gusts to 60. Insane
 -
Lastest updated snowfall probs for December from the ECMWF. This is the fourth month in a row with sub normal December snowfall. I would think with all the changes taking place over the HL during the next weeks a lot can change in regards to December snowfall in the East. .
-
2025 Atlantic Hurricane Season
WxWatcher007 replied to BarryStantonGBP's topic in Tropical Headquarters
Moving into winter mode so probably my final post in this subforum for a while, but wanted to share this. I concur with a lot of the analysis and 2024 certainly factored into my 2025 forecast. -
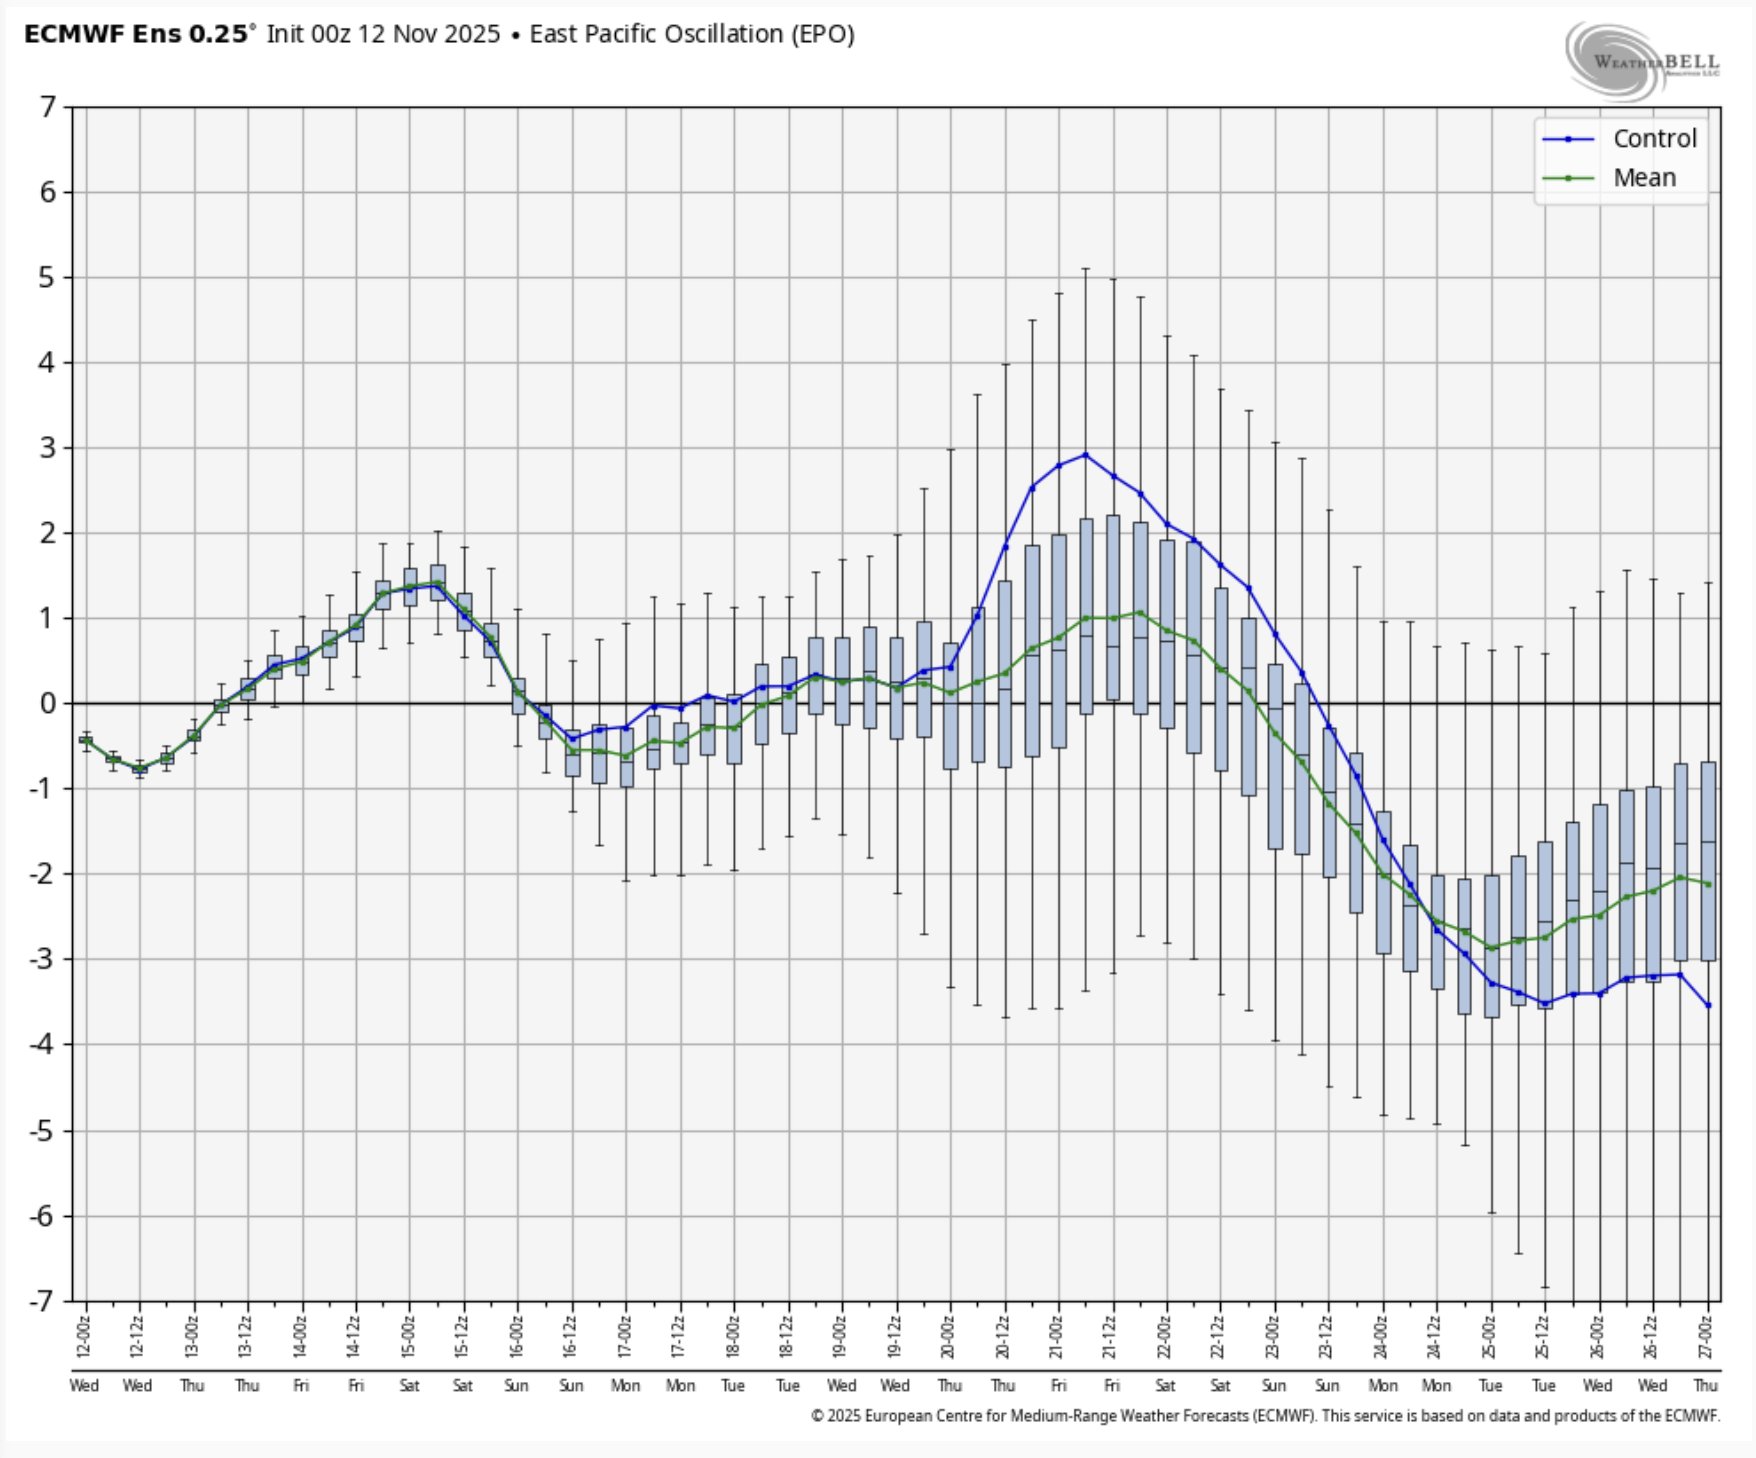
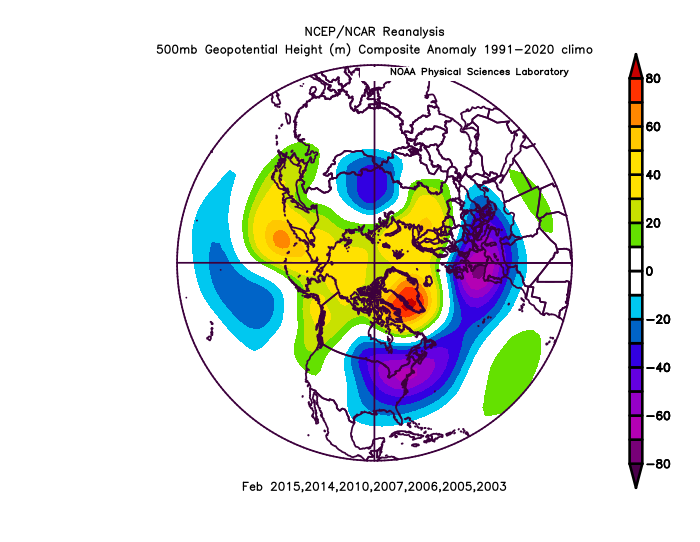
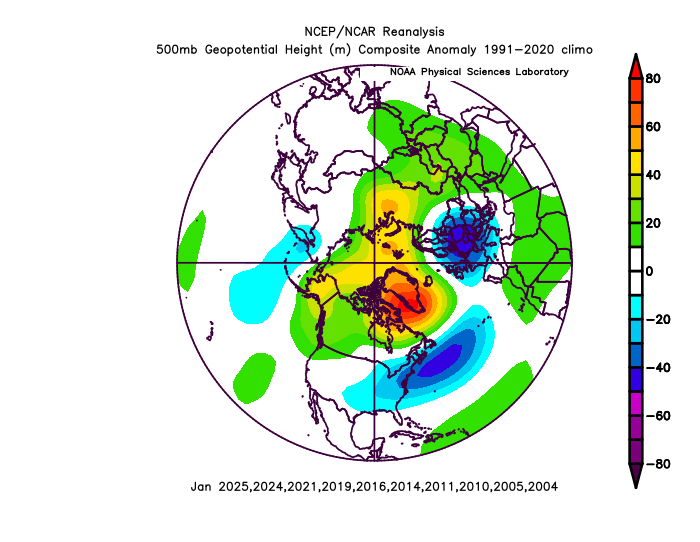
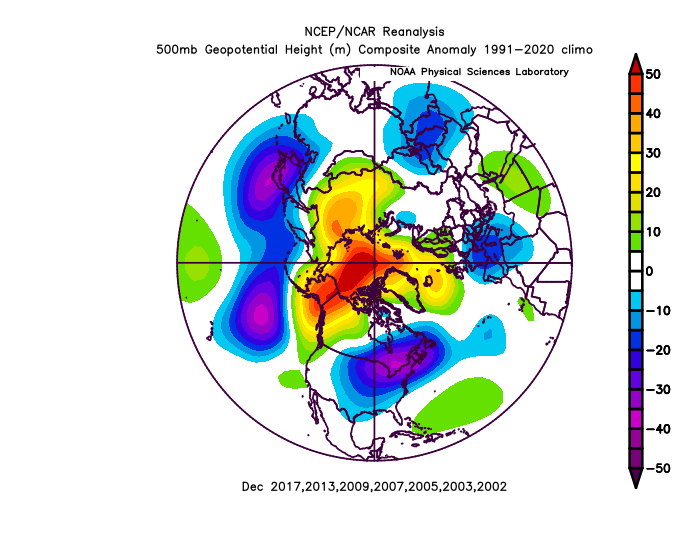
Below are the mean h5 anomalies for all the above normal snowfall months at BWI since 2000. What our ideal "snowy" pattern looks like changes a bit through the season. In December the pacific is much more important, with the most important anomalies being the EPO and AO regions. Later in winter the NAO anomalies are more strongly correlated with snowfall. Across the board the AO remains the most consistent predictor of snowfall probabilities. December January February
-
Some stuff we might find useful as we head into winter While February remains our snowiest month by the means (due in large part to 2010) January is the Winter month with the best odds of being above normal snowfall since 2000. Odds of an above avg snowfall month since 2000 at BWI Dec: 28% Jan: 40% Feb: 28% Mar: 20%
-
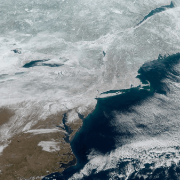
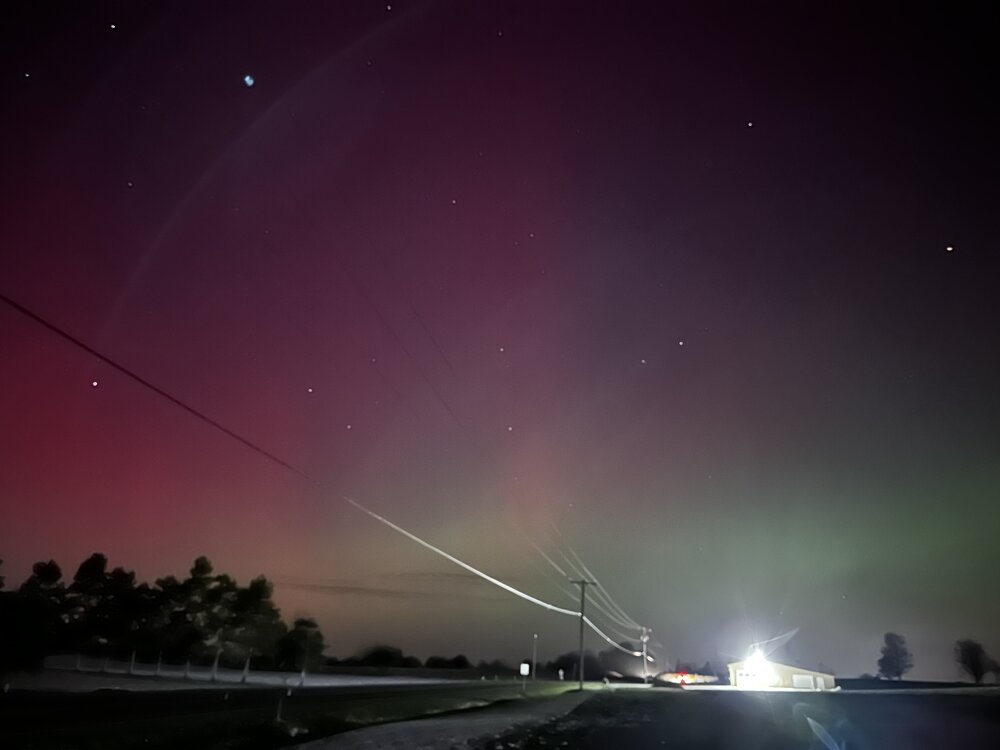
Clouds here but my kids at college in Ohio sent this photo.
-
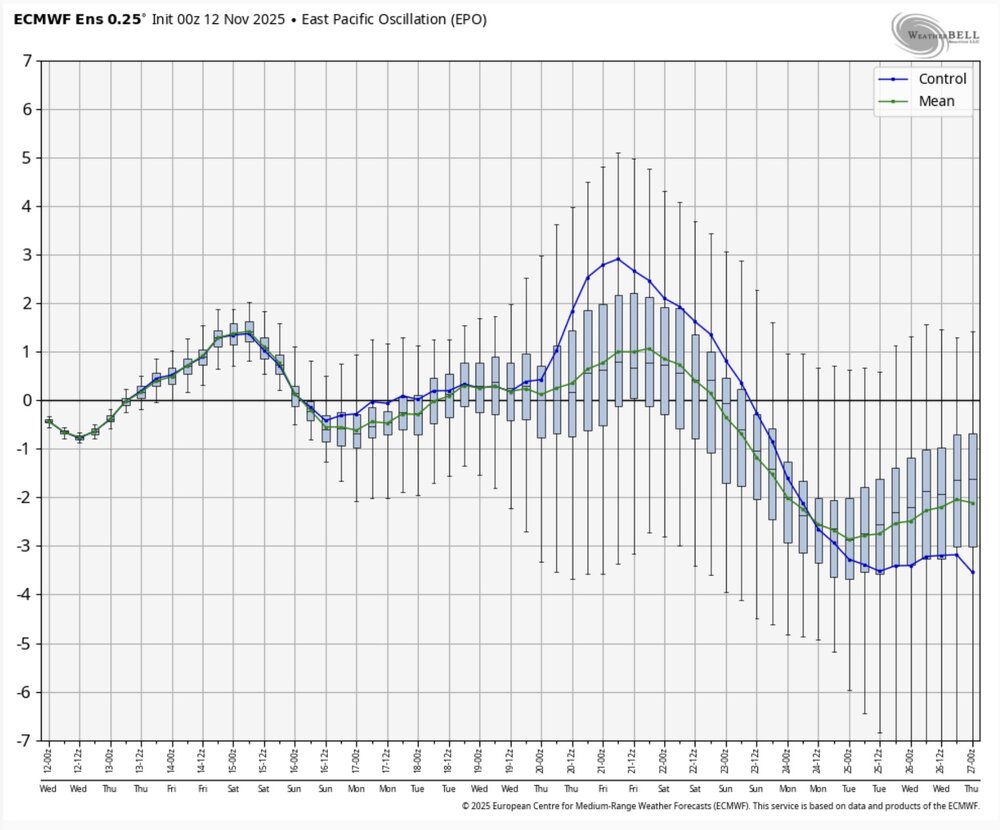
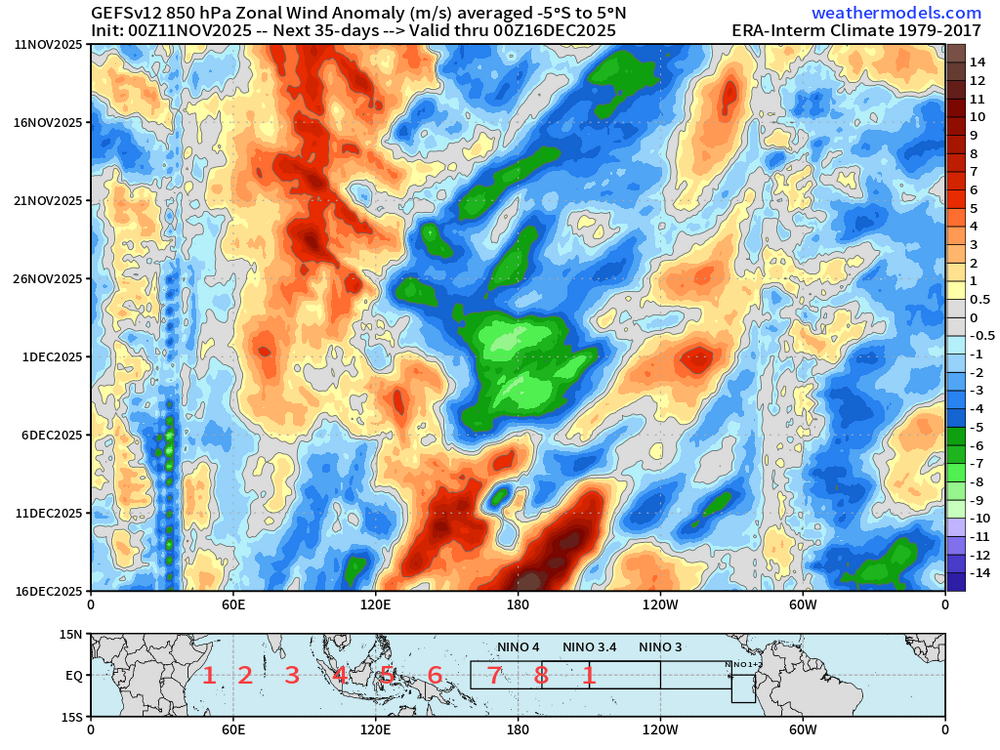
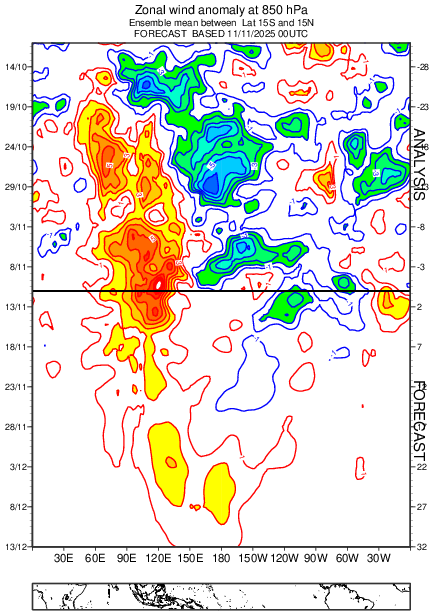
Yeah, that will be interesting to watch evolve. Extended range EPS and GEFS are advertising this WWB to push out to the dateline. Which has proven difficult to do in other recent La Niña years. So I'm curious to see how this one goes as we move into December.
-
SE trend, where are you?
-
Last October was epic, no? I remember running outside because a friend of mine sent me a picture his mom took in West Hartford...I was watching a Bruins game and missed a goal. Pretty sure that was October last year.
-

November 2025 general discussions and probable topic derailings ...
weatherwiz replied to Typhoon Tip's topic in New England
There was a paper I read a few years ago about the use of the RONI and how it is a better indicator of the true state versus the traditional ONI. There were multiple examples used, but there was one that looked at the 2015/2016 event, which per ONI was super strong. Based on forecasts and guidance for a super strong EL Nino certain measures were taken (I want to say it was western Africa) in preparations for impacts to precipitation, etc and ultimately took too aggressive measures and it cost some industries alot of money. But per the RONI, the event was not nearly as strong and their weather for the winter season was more reflective of that of a moderate event. Essentially, the study indicated if they used the RONI they wouldn't have taken as aggressive measures. -
 Who is we?
 -
I like watching the daily run of the CFSv2 seasonal. I generally watch trends. It does bounce a round quite a bit, so be forewarned. Today's run was an extreme run. Cold December, followed by a colder January, followed by a colder February. This is about the time of year that we can peek into early winter and see if our thoughts over the summer were correct. We can also begin to sort through analogs. I think Cosgrove's ideas have some merit in that winter will have a cold finish. He is just one of these guys who has seen a lot of weather, and has experience of decades of forecasting. But what if he is right, AND those of us(who are calling for a cold start to winter) are both correct? It has been a while since we have had a wall-to-wall winter. While I think wall-to-wall is unlikely, I do think a cold 2-3 weeks to start December, followed by 3-4 weeks of meh, followed by mid-late Jan into Feb cold...is on the table. But here is the extreme. And that might not look overly extreme, but given the configuration of the surface pressure maps below...there is an increasingly strong possibility of very cold temps being released into the lower 48. During a La Nina, the SE extent of the cold will often be more blunted than below. However, during weak La Nina winters...we can see that SE extent do exactly as modeled below. Not always, but there are precedents for that look. Over time, I have learned to look at surface pressure maps. I do this in order to see where the coldest air is. They are counter intuitive in that we look for BN heights at 500mb for but we look for AN heights at the surface. During winter, that can be a strong signal for cold air. Cold air anchors itself into the Canadian Prairies, and builds. As the season modeled progresses(below), the cold pushes. This is an "old school" winter setup where winter just kept coming. FTR, I am not saying this will happen, but it does catch my attention when modeling shows it - even LR ext modeling during shoulder season.
-
Some mood flakes yesterday afternoon, plus about 2 minutes of S+ that whitened the ground (0.1"). Saw 1.0-1.5" in the Augusta and Brunswick regions, also in southern Somerset County to our east.
-
November 2025 general discussions and probable topic derailings ...
Typhoon Tip replied to Typhoon Tip's topic in New England
I will say one thing in defense of the NAO ... it's more important for NW Europe. -
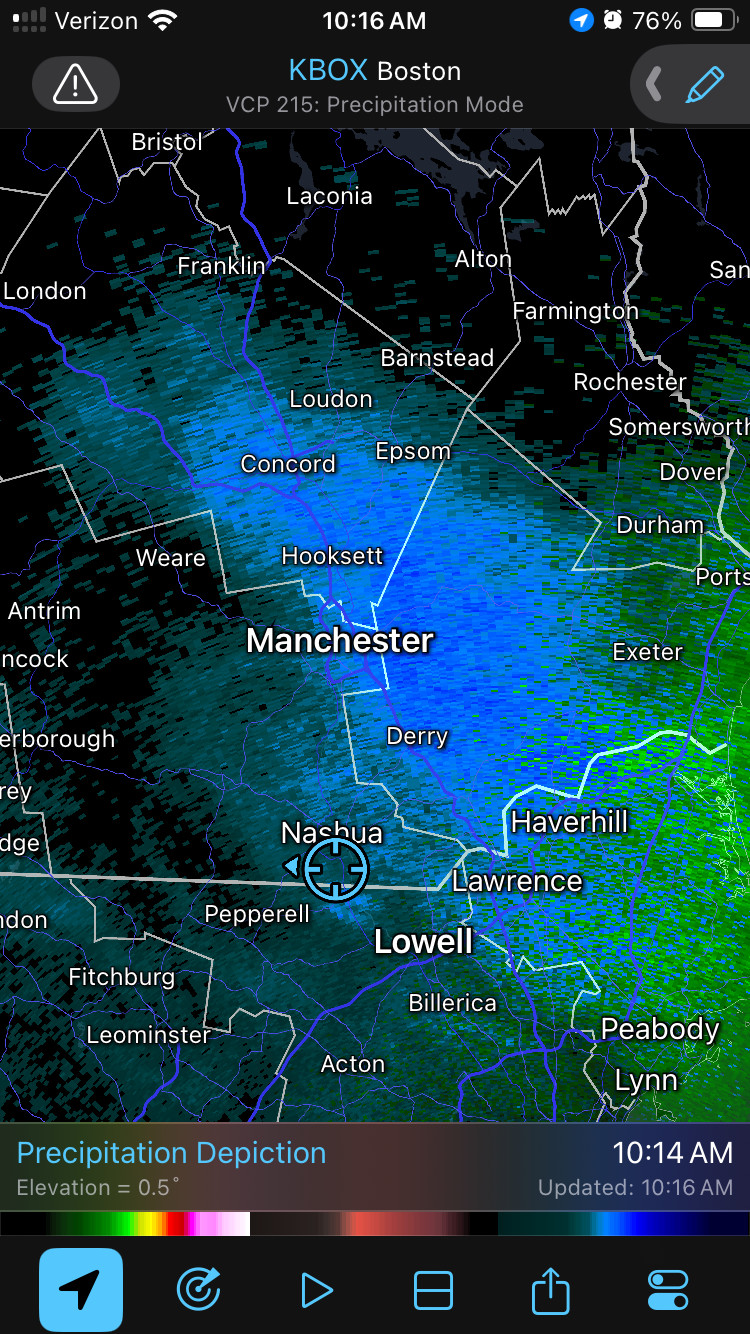
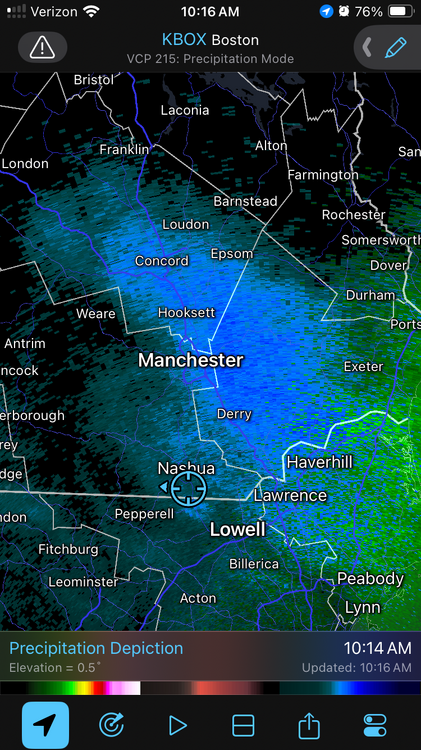
Sign of things to come this year? Heavy band setting up on 93 in NH. Frustratingly close but porked in subsidence.
-
That was the best one imo. Although sounds like I missed the good stuff around midnight last night.
-
I missed an event on October 24?!? This whole having a kid thing and going to bed at 8p really screws this.
-
November 2025 general discussions and probable topic derailings ...
Typhoon Tip replied to Typhoon Tip's topic in New England
Adding to the bold ... RONI studies, which are hugely necessary and thank god imho, there has to be revamp in correlations - or evolution .. maybe not complete overhaul. I remember writing posts suggesting something like a RONI was needed, jesus .. 15 years ago? In the end days of Eastern, that the ENSO cannot mean the same thing when the Hadely Cell is expanded. Most spurned the notion ... typical. There may have, and probably was, already research going on about the HC expansion ... but I hypothesized that on my own decades ago. It started in 1998 for me actually, at the tail end of that super nova El Nino ...when I noticed ( and came up with the "Miami Rule" ) that the heights over the Caribbean and adjacent SW Atlantic were failing to recede as far in the winters. It's subtle... like 3 to 5 measly hgh contours goes under the radar. But, that means the flow is compressing whenever troughs press east across the continent. That compression means higher geostrophic base wind velocity and guess what ...that's been verified(ing) ever since. And it's gotten worse. This is not merely ENSO...as it is observed regardless of cool and warm phases. It occurred to me that those large scale mechanical balances were possibly overwhelming ENSO forcing... That's gotten more obvious since. Some of these ENSOs are not registering nearly as obviously as they used to around the common climo expectation regions where it was known to do so in the past. The boa constrictor of CC. -
Waiting on the CME arrival to know for sure what we are dealing with.