BlizzardWx
-
Posts
313 -
Joined
-
Last visited
About BlizzardWx

Recent Profile Visitors
1,391 profile views


-
What are you thinking favors that? Although I am slightly west of the Mississippi so maybe that's fine too
-
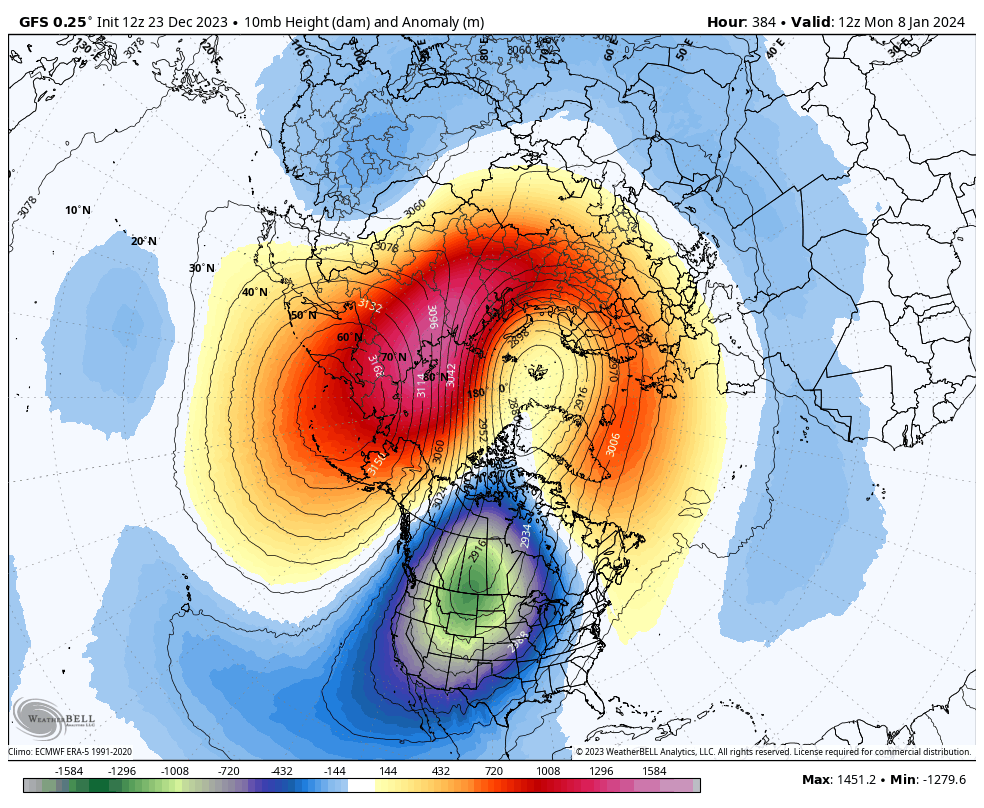
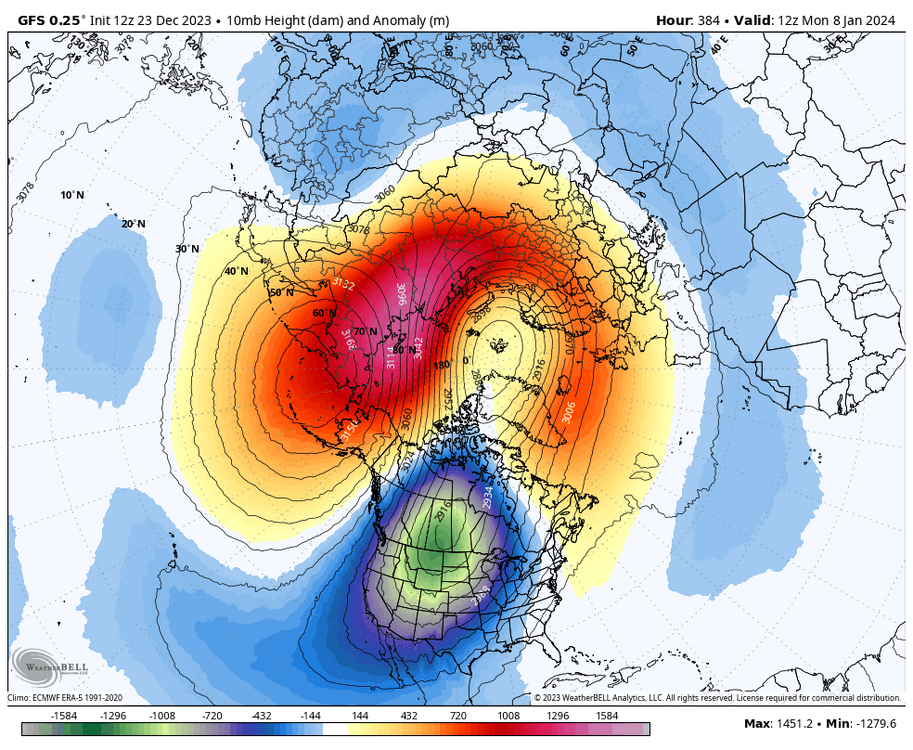
First time I've seen the a PV lobe modeled to sit over NA so far. This extends down to 50 hPa as well.
-
We lost a lot of the strong +u members though for the period in question. Definite consolidation run towards the mean.
-
Is there any work with respect to the location of the initial 10 hPa warming in a SSW and where the cold anomalies eventually settle? It seems as of now the warmest anomalies will focus over east Asia and North America with the remnant of the PV over Europe.
-
MEI will likely get a good bump from this pattern going forward, but hard to say how much over a two month average.
-
If you were issuing now, what would you change?
-
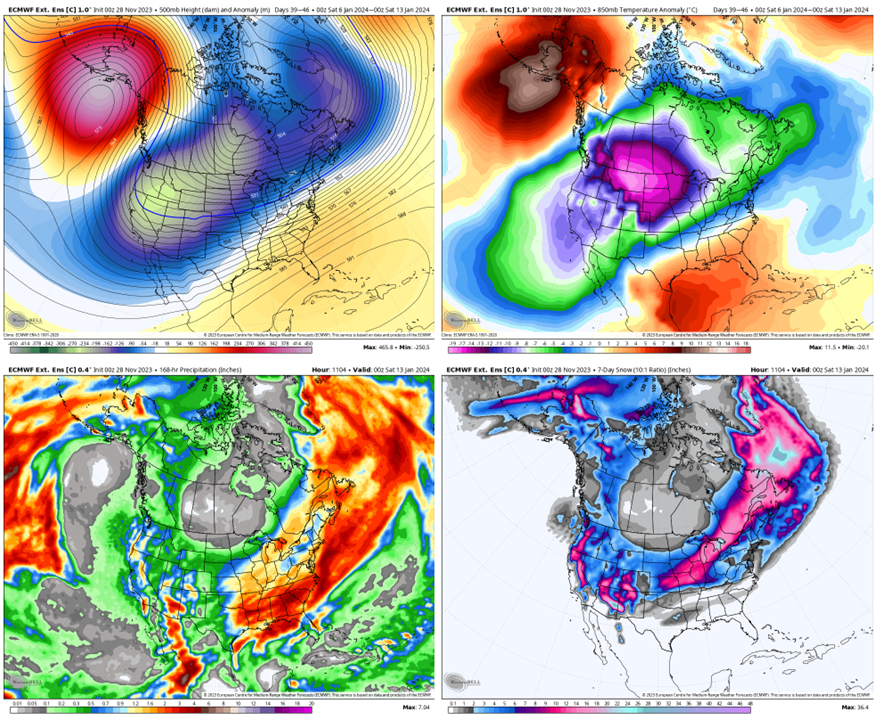
Certainly interesting on the ECMWF weekly run this morning. The control run would probably result in more snow or ice for me.
-
Actually now that you say that I can see it. If you move 2014 east just a bit it matches up relatively ok.
-
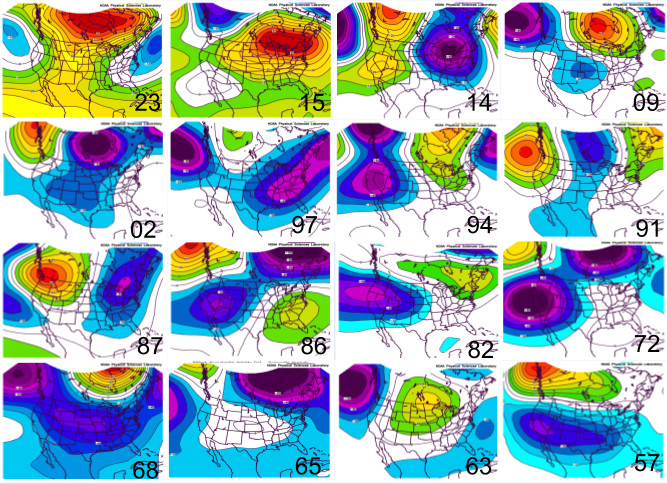
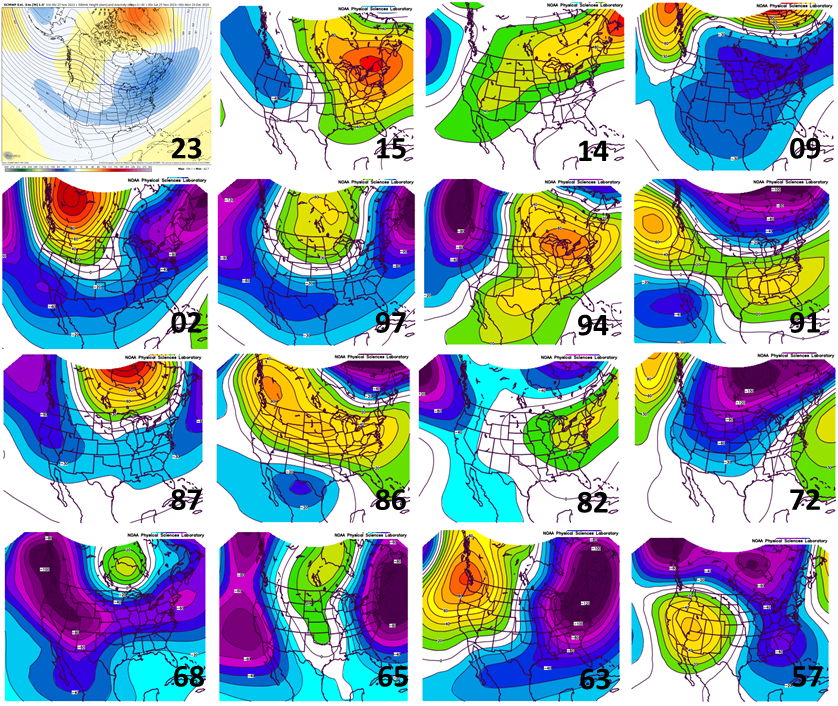
Here is a comparison of the height anomalies for the fall so far, obviously it won't change that much over the next couple days as we round out November. I forgot to normalize the scales as a full disclosure, but it wouldn't have made that much difference in the plotted colors. Anyway, pretty interesting how persistent and widespread ridging has been compared to other El Ninos. There has been a notable lack of a STJ for most of the fall as well as incredibly broad ridging extending from the Great Basin through much of Canada. No other year matches well, though if you skewed the anomalies more positive I suppose 1997 could sort of work. Below is the next month on the EPS weeklies versus the other El Nino years I included. Interesting to see that the +PNA/-NAO pattern showed up in only a few others cases. I thought the best matches were 2002 and 1963, with 2009 not being a bad match either. You could make an argument for a few other years, but they don't have the ridge axis in the right place which I view as essential. I suppose all this is to say, I like what I am seeing at this point.
-
This is a good set up for my area. Might see our first snow or ice in this pattern if it works out right.
-
I mean you aren't wrong, but I'd still maintain its a different problem. For the same reason that our struggle to predict the weather in 2 weeks is basically irrelevant to forecasting long term climate change. In one you are trying to nail down the exact state of the atmosphere and the other you are trying to forecast the average state of it and smooth out the noise.
-
I'd say that's not a fair comparison. Monthly averages factoring in peak ENSO forcing are more likely to verify than snapshot forecasts 2-3 weeks out in many cases. But as others noted, 18/19 was much weaker and therefore you would assume the predictability would be lower too.
-
Is there any historical dataset of NAO/AO (etc) that has a sub monthly resolution? If you know of one, please pass it along. Thanks.
-
Thanks, I will take a look! Also, excellent work on your outlook.
-
I've been reading all the back and forth for the last few months trying to improve my knowledge on seasonal forecasting matters. Thank you for all the great work everyone! I moved to the Tulsa area about a year ago. I'd been in the west before that my whole life. My question is, do any of you have any thoughts on how the ideal combination of indices for winter weather varies between here and the east coast? It seems obvious to me that there is a lot of overlap, but that my best snow patterns aren't going to be the same ones where the northeast scores big. Anyway, let me know if you have any thoughts. Thanks